11.1 – What is Statistical Power?
Introduction
Simply put, the power of a statistical test asks the question: do we have enough data to warrant a scientific conclusion, not just a statistical inference. From the NHST approach to statistics, we define two conditions in our analyses, a null hypothesis, HO, and the alternative hypothesis, HA. By now you should have a working definition of HO and HA (Chapter 8.1). For the two-sided case (Chapter 8.4), HO would be no statistical difference between two sample means, whereas for HA, there was a difference between two sample means. Similarly, for one-sided cases, HO would be one sample mean greater (less) than or equal to the second sample mean, whereas for HA, one sample mean is less (greater) than the second mean. Together, these two hypotheses cover all possible outcomes of our experiment!
However, when conducting an experiment to test the null hypothesis four, not two outcomes are possible with respect to “truth” (Table 1), which we introduced first in our Risk analysis chapter and again when we introduced statistical inference.
Table 1. Possible outcomes of an experiment
| In the population, Ho was really… | |||
| True | False | ||
| Inference: | Fail to reject Ho | Correct decision
p = 1 – α |
Type II error
p = β |
| Reject Ho | Type I error
p = α |
Correct decision
p = 1 – β |
|
We introduced false positives and false negatives in our discussion of risk analysis, and now generalize these concepts to outcomes of any experiment.
(1) We do not reject the null hypothesis, we state that we are 95% (P = 1 – α) confident that we’ve made the correct decision, and in fact, that is the true situation (“correct decision”). As before this is a true positive.
For example, mean acetylsalicylic acid concentration in a sample of 200 mg, brand-name aspirin tablets really is the same as generic aspirin.
(2) We reject the null hypothesis, we state there is a 5% chance that we could be wrong (P = 1 – β), and in fact, that is the true situation (“correct decision”). As before this is a true negative.
For example, ephedrine really does raise heart rates in people who have taken the stimulant compared to those who have taken a placebo.
Two additional possible outcomes to an experiment
The other two possible outcomes are not desirable but may occur because we are making inferences about populations from limited information (we conduct tests on samples) and because of random chance influencing our measure.
(3) We do not reject the null hypothesis, but in fact, there was a true difference between the two groups and we have therefore committed a Type II error. As before this is a false negative.
(4) We reject the null hypothesis, but in fact, there was no actual difference between the two groups and we have therefore committed a Type I error. As before this is a false positive.
What can we do about these two possible undesirable outcomes?
We set our Type I error rate α, and, therefore our Type II error rate β before we conduct any tests, and these error rates cover the possibility that we may incorrectly conclude that the null hypothesis is false (α), or we may incorrectly conclude that the null hypothesis is true (β). When might these events happen?
The power of a statistical test is the probability that the test will reject the null hypothesis when the alternative hypothesis is true.
A type I error is committed, by chance alone, when our sample is accidentally obtained from the tail of the distribution, thus our sample appears to be different from the population… Below, we have a possible case that, by chance alone, we could be getting all of our subjects from one end of the distribution (Fig. 1).
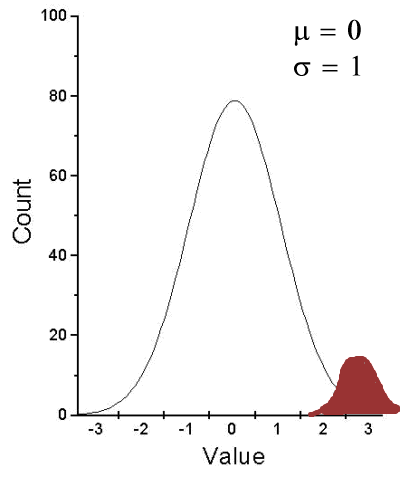
Figure 1. Population sampling from tail of distribution.
We would likely conclude that our sample mean is different (greater) than the population mean.
A type II error is committed, by chance alone, when our sample is between two different population distributions. The implication for our study is drawn in Figure 2. Instead of our sampling drawn from one population, we may have drawn between two very different populations.
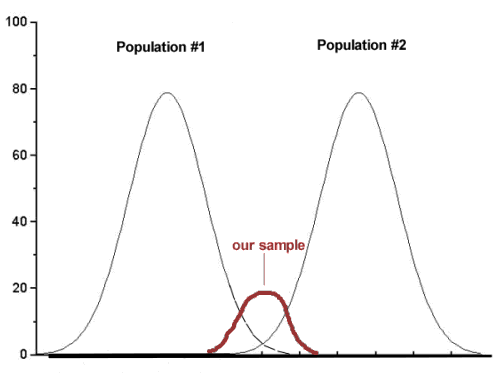
Figure 2. Without us knowing, our sample may come from the extremes of two separate populations.
How did we end up with “the wrong” sample? Recall from our first discussions about Experimental Design how we distinguished between random and haphazard sampling. The key concept was that a program of recruitment of subjects (e.g., how to get a sample) must be conducted in such a way that each member of the population has an equal chance of being included in the study. Only then can we be sure that extrinsic factors (things that influence our outcome but are not under our control nor do we study them) are spread over all groups, thus canceling out.
Why do we say we are 95% confident in our estimate (or conclusions)?
(1) Because we can never be 100% certain that by chance alone we haven’t gotten a biased sample (all it takes is a few subjects in some cases to “throw off” our results).
(2) For parametric tests, at least, we assume that we are sampling from a normal population.
Thus, in statistics, we need an additional concept. Not only do we need to know the probability of when we will be wrong (α, β), but we also want to know the probability of when we will be correct when we use a particular statistical test. This latter concept is defined as the power of a test as the probability of correctly rejecting Ho when it is false. Conducting a power analysis before starting the experiment can help answer basic experimental design questions like, how many subjects (experimental units) should my project include? What approximate differences, if any might I expect among the subjects? (Eng 2003; Cohen 1992)
Put another way, power is the likelihood of identifying a significant (important) effect (difference) when one exists. Formally, statistical power is defined as the probability, p = 1 – β, and it is the subject of this chapter.
Questions
- Be able to define and distinguish statistical power and statistical inference.
Quiz Chapter 11.1
What is statistical power