Table of Critical values of Student’s t distribution.
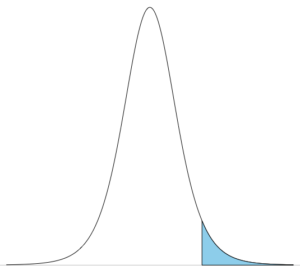
Figure 3. Right-tail probability (> t) Student’s t distribution critical value (area shaded blue).
| α(1) | 0.25 | 0.1 | 0.05 | 0.025 | 0.01 | 0.005 | 0.0025 | 0.001 | 0.0005 |
| α(2) | 0.5 | 0.2 | 0.1 | 0.05 | 0.02 | 0.01 | 0.005 | 0.002 | 0.001 |
| DF/1 | 1.000 | 3.078 | 6.314 | 12.706 | 31.821 | 63.657 | 127.321 | 318.309 | 636.619 |
| 2 | 0.816 | 1.886 | 2.920 | 4.303 | 6.965 | 9.925 | 14.089 | 22.327 | 31.599 |
| 3 | 0.765 | 1.638 | 2.353 | 3.182 | 4.541 | 5.841 | 7.453 | 10.215 | 12.924 |
| 4 | 0.741 | 1.533 | 2.132 | 2.776 | 3.747 | 4.604 | 5.598 | 7.173 | 8.610 |
| 5 | 0.727 | 1.476 | 2.015 | 2.571 | 3.365 | 4.032 | 4.773 | 5.893 | 6.869 |
| 6 | 0.718 | 1.440 | 1.943 | 2.447 | 3.143 | 3.707 | 4.317 | 5.208 | 5.959 |
| 7 | 0.711 | 1.415 | 1.895 | 2.365 | 2.998 | 3.499 | 4.029 | 4.785 | 5.408 |
| 8 | 0.706 | 1.397 | 1.860 | 2.306 | 2.896 | 3.355 | 3.833 | 4.501 | 5.041 |
| 9 | 0.703 | 1.383 | 1.833 | 2.262 | 2.821 | 3.250 | 3.690 | 4.297 | 4.781 |
| 10 | 0.700 | 1.372 | 1.812 | 2.228 | 2.764 | 3.169 | 3.581 | 4.144 | 4.587 |
| 11 | 0.697 | 1.363 | 1.796 | 2.201 | 2.718 | 3.106 | 3.497 | 4.025 | 4.437 |
| 12 | 0.695 | 1.356 | 1.782 | 2.179 | 2.681 | 3.055 | 3.428 | 3.930 | 4.318 |
| 13 | 0.694 | 1.350 | 1.771 | 2.160 | 2.650 | 3.012 | 3.372 | 3.852 | 4.221 |
| 14 | 0.692 | 1.345 | 1.761 | 2.145 | 2.624 | 2.977 | 3.326 | 3.787 | 4.140 |
| 15 | 0.691 | 1.341 | 1.753 | 2.131 | 2.602 | 2.947 | 3.286 | 3.733 | 4.073 |
| 16 | 0.690 | 1.337 | 1.746 | 2.120 | 2.583 | 2.921 | 3.252 | 3.686 | 4.015 |
| 17 | 0.689 | 1.333 | 1.740 | 2.110 | 2.567 | 2.898 | 3.222 | 3.646 | 3.965 |
| 18 | 0.688 | 1.330 | 1.734 | 2.101 | 2.552 | 2.878 | 3.197 | 3.610 | 3.922 |
| 19 | 0.688 | 1.328 | 1.729 | 2.093 | 2.539 | 2.861 | 3.174 | 3.579 | 3.883 |
| 20 | 0.687 | 1.325 | 1.725 | 2.086 | 2.528 | 2.845 | 3.153 | 3.552 | 3.850 |
| 21 | 0.686 | 1.323 | 1.721 | 2.080 | 2.518 | 2.831 | 3.135 | 3.527 | 3.819 |
| 22 | 0.686 | 1.321 | 1.717 | 2.074 | 2.508 | 2.819 | 3.119 | 3.505 | 3.792 |
| 23 | 0.685 | 1.319 | 1.714 | 2.069 | 2.500 | 2.807 | 3.104 | 3.485 | 3.768 |
| 24 | 0.685 | 1.318 | 1.711 | 2.064 | 2.492 | 2.797 | 3.091 | 3.467 | 3.745 |
| 25 | 0.684 | 1.316 | 1.708 | 2.060 | 2.485 | 2.787 | 3.078 | 3.450 | 3.725 |
| 26 | 0.684 | 1.315 | 1.706 | 2.056 | 2.479 | 2.779 | 3.067 | 3.435 | 3.707 |
| 27 | 0.684 | 1.314 | 1.703 | 2.052 | 2.473 | 2.771 | 3.057 | 3.421 | 3.690 |
| 28 | 0.683 | 1.313 | 1.701 | 2.048 | 2.467 | 2.763 | 3.047 | 3.408 | 3.674 |
| 29 | 0.683 | 1.311 | 1.699 | 2.045 | 2.462 | 2.756 | 3.038 | 3.396 | 3.659 |
| 30 | 0.683 | 1.310 | 1.697 | 2.042 | 2.457 | 2.750 | 3.030 | 3.385 | 3.646 |
| 35 | 0.682 | 1.306 | 1.690 | 2.030 | 2.438 | 2.724 | 2.996 | 3.340 | 3.591 |
| 40 | 0.681 | 1.303 | 1.684 | 2.021 | 2.423 | 2.704 | 2.971 | 3.307 | 3.551 |
| 50 | 0.679 | 1.299 | 1.676 | 2.009 | 2.403 | 2.678 | 2.937 | 3.261 | 3.496 |
Note: Here’s the table at Wikipedia (Links to an external site.).
R command used to generate this table
qt(c(alpha), df=df, lower.tail=FALSE)
where alpha is one tailed probability, df is number of degrees of freedom, and lower.tail=FALSE means each cell is to be read as equal to or greater than the critical value.