Table of Chi-square critical values
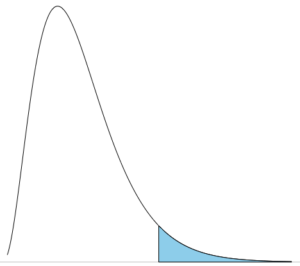
Figure 2. Right-tail probability (> Χ2) chi-square critical value (area shaded blue).
| α(1) | 0.25 | 0.1 | 0.05 | 0.025 | 0.01 | 0.005 | 0.0025 | 0.001 | 0.0005 |
| DF/1 | 1.323 | 2.706 | 3.841 | 5.024 | 6.635 | 7.879 | 9.141 | 10.828 | 12.116 |
| 2 | 2.773 | 4.605 | 5.991 | 7.378 | 9.210 | 10.597 | 11.983 | 13.816 | 15.202 |
| 3 | 4.108 | 6.251 | 7.815 | 9.348 | 11.345 | 12.838 | 14.320 | 16.266 | 17.730 |
| 4 | 5.385 | 7.779 | 9.488 | 11.143 | 13.277 | 14.860 | 16.424 | 18.467 | 19.997 |
| 5 | 6.626 | 9.236 | 11.070 | 12.833 | 15.086 | 16.750 | 18.386 | 20.515 | 22.105 |
| 6 | 7.841 | 10.645 | 12.592 | 14.449 | 16.812 | 18.548 | 20.249 | 22.458 | 24.103 |
| 7 | 9.037 | 12.017 | 14.067 | 16.013 | 18.475 | 20.278 | 22.040 | 24.322 | 26.018 |
| 8 | 10.219 | 13.362 | 15.507 | 17.535 | 20.090 | 21.955 | 23.774 | 26.124 | 27.868 |
| 9 | 11.389 | 14.684 | 16.919 | 19.023 | 21.666 | 23.589 | 25.462 | 27.877 | 29.666 |
| 10 | 12.549 | 15.987 | 18.307 | 20.483 | 23.209 | 25.188 | 27.112 | 29.588 | 31.420 |
| 11 | 13.701 | 17.275 | 19.675 | 21.920 | 24.725 | 26.757 | 28.729 | 31.264 | 33.137 |
| 12 | 14.845 | 18.549 | 21.026 | 23.337 | 26.217 | 28.300 | 30.318 | 32.909 | 34.821 |
| 13 | 15.984 | 19.812 | 22.362 | 24.736 | 27.688 | 29.819 | 31.883 | 34.528 | 36.478 |
| 14 | 17.117 | 21.064 | 23.685 | 26.119 | 29.141 | 31.319 | 33.426 | 36.123 | 38.109 |
| 15 | 18.245 | 22.307 | 24.996 | 27.488 | 30.578 | 32.801 | 34.950 | 37.697 | 39.719 |
| 16 | 19.369 | 23.542 | 26.296 | 28.845 | 32.000 | 34.267 | 36.456 | 39.252 | 41.308 |
| 17 | 20.489 | 24.769 | 27.587 | 30.191 | 33.409 | 35.718 | 37.946 | 40.790 | 42.879 |
| 18 | 21.605 | 25.989 | 28.869 | 31.526 | 34.805 | 37.156 | 39.422 | 42.312 | 44.434 |
| 19 | 22.718 | 27.204 | 30.144 | 32.852 | 36.191 | 38.582 | 40.885 | 43.820 | 45.973 |
| 20 | 23.828 | 28.412 | 31.410 | 34.170 | 37.566 | 39.997 | 42.336 | 45.315 | 47.498 |
| 21 | 24.935 | 29.615 | 32.671 | 35.479 | 38.932 | 41.401 | 43.775 | 46.797 | 49.011 |
| 22 | 26.039 | 30.813 | 33.924 | 36.781 | 40.289 | 42.796 | 45.204 | 48.268 | 50.511 |
| 23 | 27.141 | 32.007 | 35.172 | 38.076 | 41.638 | 44.181 | 46.623 | 49.728 | 52.000 |
| 24 | 28.241 | 33.196 | 36.415 | 39.364 | 42.980 | 45.559 | 48.034 | 51.179 | 53.479 |
| 25 | 29.339 | 34.382 | 37.652 | 40.646 | 44.314 | 46.928 | 49.435 | 52.620 | 54.947 |
| 26 | 30.435 | 35.563 | 38.885 | 41.923 | 45.642 | 48.290 | 50.829 | 54.052 | 56.407 |
| 27 | 31.528 | 36.741 | 40.113 | 43.195 | 46.963 | 49.645 | 52.215 | 55.476 | 57.858 |
| 28 | 32.620 | 37.916 | 41.337 | 44.461 | 48.278 | 50.993 | 53.594 | 56.892 | 59.300 |
| 29 | 33.711 | 39.087 | 42.557 | 45.722 | 49.588 | 52.336 | 54.967 | 58.301 | 60.735 |
| 30 | 34.800 | 40.256 | 43.773 | 46.979 | 50.892 | 53.672 | 56.332 | 59.703 | 62.162 |
| 35 | 40.223 | 46.059 | 49.802 | 53.203 | 57.342 | 60.275 | 63.076 | 66.619 | 69.199 |
| 40 | 45.616 | 51.805 | 55.758 | 59.342 | 63.691 | 66.766 | 69.699 | 73.402 | 76.095 |
| 50 | 56.334 | 63.167 | 67.505 | 71.420 | 76.154 | 79.490 | 82.664 | 86.661 | 89.561 |
R command
qchisq(c(alpha), df=df, lower.tail=FALSE)
where alpha is one tailed probability, df is number of degrees of freedom, and lower.tail=FALSE means each cell is to be read as equal to or greater than the critical value.