3.1 – Data types
Understanding data: Types, measurement, and use in analysis.
.
Data? Data refers to collections of facts, information, or statistics about an object. Data are either quantitative (numbers) or qualitative (observed properties that cannot be summarized by numbers). Data are measured and analyzed for research or reports to be used as evidence in support or against some hypothesis or for some other decision making arena (medicine, policy). Measurement implies a systematic effort to assign a numerical value to the thing that is measured; measurement units are standard quantities used to describe the same kinds of things. Examples of measurement units include kilograms (mass), meter (length), liter (volume), and Celsius (temperature).
An observation, then, is a single occurrence of something, the variable, we measure or count of gather information about. A unit of observation is the level at which the measure is taken: a single cell, a biopsy containing grams of tissue, one flower among many flowers on a tree, the individual, the family, the community, the population, the ecosystem, … the planet, the solar system, …. If the time period over which the observation may take place varies, then the interval of time may be the unit.
Data also implies a means to code or structure information so that it can be analyzed. Raw data refers to unprocessed collection of information about an object, which then needs to go through data processing in order to be useful in the next steps. If you look more closely, you’ll see that considerable effort is made to standardize data formats for analytical purposes. Good examples of such standards are available in clinical research and genomics.
In statistics, we recognize data which belongs to either of two data types: quantitative or qualitative. We will return to data types repeatedly throughout our statistics journey — knowing which type you directs you to the types of statistical tests that are available to you. In brief, quantitative data types implies estimation of parameters about a population, hence, this data type points the user towards use of parametric statistics; qualitative data types do not lead to estimates of parameters, but provide counting of observations in categories.
Quantitative.
.
Discrete, countable or meristic, example: five Conus shells (Fig 1)
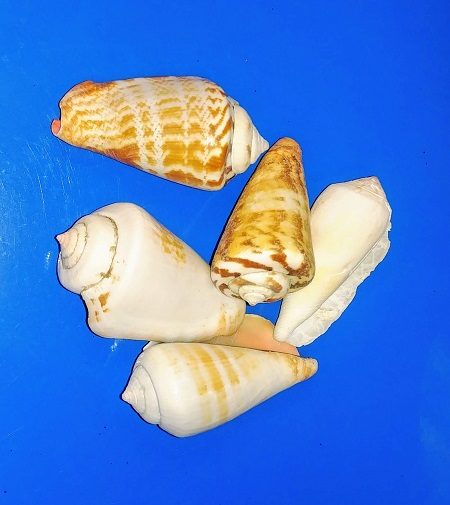
Figure 1. Five Conus shells, example of discrete data type. Click image to view full sized image.
Interval, example: degrees Celsius
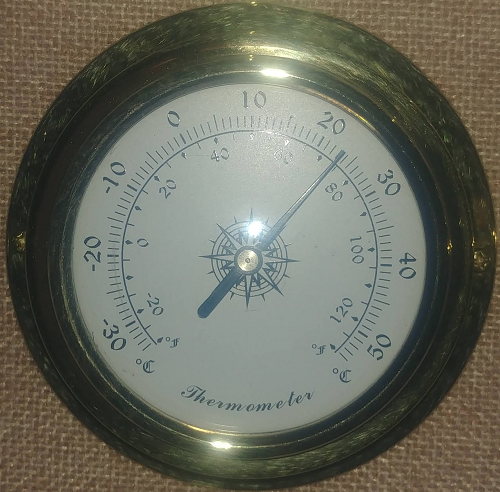
Figure 2. Analog thermometer showing office temperature at 23.1 Celsius, example of interval data type. Click image to view full sized image.
Another classical interval scale example is time of day — there’s no meaningful zero time. We can measure amount of time — hours, minutes, seconds, etc, between intervals, but there is no absolute absence of time.
Ratio, true zero, examples: body mass, capillary blood glucose reading (Fig 3), degrees Kelvin, relative humidity (Fig 4).
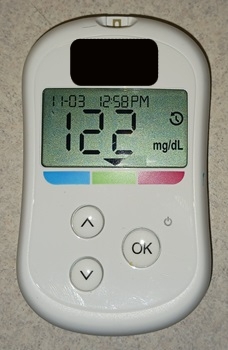
Figure 3. Blood glucose reading, 122 mg/dL. Click image to view full sized image.
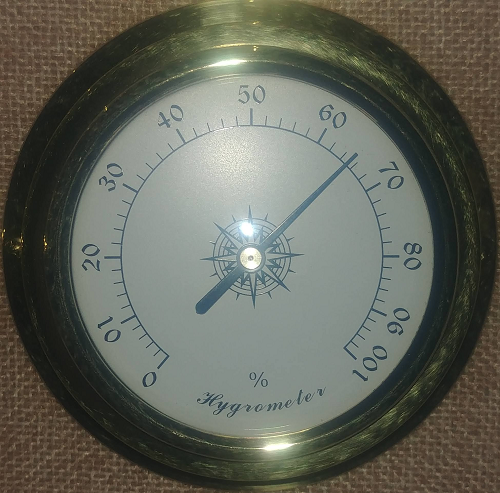
Figure 4. Analog hygrometer showing office humidity at 65 percent, example of ratio data type. Click image to view full sized image.
I’m a fan of competitive sports and also have interested in measures of performance like running times in lizards! (eg, Beck et al 1998).
Qualitative.
.
Binomial, yes/no, example: a person either has the condition or they do not; hydrangea petals are sometimes blue (Fig 5).

Figure 5. Flowers (Hydrangea) are blue or they are not, example of binomial data type. Click image to view full sized image.
Nominal, example: names of species. Wolves and dogs are members of Canis lupus and Canis familiaris, respectively, house cats, Felis catus, are not (Fig 6).

Figure 6. Cats are neither dogs or wolves, example of nominal data type. Click image to view full sized image.
Note 1: Identifying variables, id number, are unique identification numbers or other for each record (individual) in the data set. These variables are categorical, nominal data type. Examples of id numbers include Social Security numbers, student identification numbers, driver’s license numbers, etc. Note that id numbers would only rarely be considered objects of study because they are typically assigned by researcher to subjects and not properties of subjects. Exceptions may include testing for impacts of anonymization procedures (for example, see Koll et al 2022).
Ordinal, ranked, example: Likert scale:
Biologists should know their data types before proceeding with an experiment.
- Strongly disagree
- Disagree
- No opinion
- Agree
- Strongly agree
Although common practice, caution is warranted when converting Likert categories into numerical scale, for example, Strongly agree = 4, Strongly disagree = -4, and so on. Because it is ordinal, the difference between 4 and -4 can’t be calculated as the difference because it is ranked, not the numerical scale. (See Carifio and Perla 2007, h/t Karen Grace-Martin, The Analysis Factor.)
Examples to try.
.
In R, load the data set diabetic (survival package, which is loaded as part of R Commander), then view the variables.
For more about R data sets, see Part 6 Working with an included data set in Mike’s Workbook for Biostatistics
R code
data(diabetic, package="survival")
.
R Commander (Fig 7)
Rcmdr: Data → Data in packages → Read data set from an attached package… Double click survival, the list of data sets should appear in the right-hand panel. Select diabetic, then click OK button.
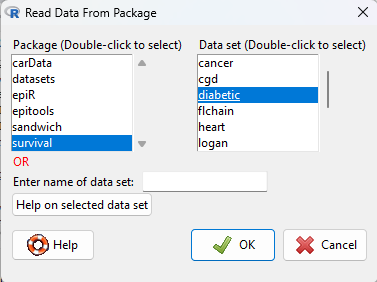
Figure 7. Screenshot Rcmdr Read data from package menu.
View the data by clicking on Rcmdr’s View data set button, or, better, submit the following command in R
head(diabetic)
.
R output
  id laser age   eye trt risk  time status
1  5 argon  28  left   0    9 46.23      0
2  5 argon  28 right   1    9 46.23      0
3 14 xenon  12  left   1    8 42.50      0
4 14 xenon  12 right   0    6 31.30      1
5 16 xenon  9   left   1   11 42.27      0
6 16 xenon  9  right   0   11 42.27      0
.
The command head() displays by default the first six rows of a data frame.
It’s a good idea to read up on the data set. Data sets included with R packages often provide a help page. submit the following command in R to load the help page.
help(diabetic)
.
The data set was subjects with high risk diabetic retinopathy, “each patient had one eye randomized to laser treatment and the other eye received no treatment.”
What are the data types for the variables? I’ll give you the a couple to start. The first column with entries 1 – 6 is called the index variable; it’s row 1, row 2, etc. of the data set and technically is not a data set variable (since it’s assignment is arbitrary) — R adds this for you. Next, the variable labeled id — clearly we see numbers, so we might think meristic, but because these are labels for the subjects, the proper data type is nominal! Try the rest on your own, scroll down to end of the page for best answers.
Questions.
.
1. Assign examples of units of measurement for each kind of measurement.
- Darts tossed, Distance from center.
- Shells, width, length.
- InfraRed temperature device readings.
- Body weight.
- Lung volume.
- Tomato color morphs (green, yellow).
- Tomato root length, stem length.
- Systolic blood pressure.
- Blood arsenic levels.
- Body Mass Index.
- Body Mass Index scale, for example NIH: underweight, normal, overweight, obese.
Assign the data type and provide examples of units of measurement.
2. What are the data types for
- Basal 5 hour fasting plasma glucose-to-insulin ratio in mice.
- Four inbred strains of mice.
- Height, in inches of six women.
- Atmospheric carbon dioxide, CO2, levels from Mauna Loa for the month of December, in parts-per-million, ppm.
- Body temperature readings, deg C, from IR device on forehead or back of the throat.
- Six mollusk species.
- The index variable in the following data set:
mom dad1 67.0 78.52 66.5 75.53 64.0 75.04 58.5 75.05 68.0 74.06 66.5 74.0
Answers to Examples to try
laser: binomial, there were two types, xenon or argon
age: ratio, years
eye: binomial
trt: binomial, no treatment (0) or laser (1)
risk: ordinal
time: ratio, time to event, number of months
status: binomial
Quiz Chapter 3.1
Data types
Chapter 3 contents
.