13.2 – Why tests of assumption are important
Introduction
Note that R (and pretty much all statistics packages) will calculate t-tests or ANOVA or whatever test you ask for, and return a p-value, but it is up to you to recognize that the p-value is accurate only if the assumptions are met. Thus, you can always estimate a parameter, but interpret its significance (biological, statistical) with caution. The great thing about statistics is that you can directly evaluate whether assumptions hold.
Violation of the assumptions of normality or equal variances can lead to Type I errors occurring more often than the 5% level. That means you will reject the null hypothesis more often than you should! If the goal of conducting statistical tests on results of an experiment is to provide confidence in your conclusions, then failing to verify assumptions of the test are no less important than designing the experiment correctly in the first place. Thus, the simple rule is: know your assumptions, test your assumptions. Evaluating assumptions is a learned skill:
- Conduct proper data exploration.
- Use specialized statistical tests to evaluate assumptions.
- data normally distributed? eg, histogram, Shapiro-Wilk test.
- groups equal variance? eg, box-plot, Levene’s median test.
- Evaluate influence of any outlier observations.
What to do if the assumptions are violated?
This is where judgement and critical thinking apply. You have several options.
First, if the violation is due to only a few observations, then you might proceed anyway, in effect invoking the Central Limit Theorem as justification.
Second, you could check your conclusions with and without the few observations that seem to depart from the trend in the rest of the data set — if your conclusion holds without the “outliers”, then you might conclude that your results are robust).
Third, you might apply a data transform reasoning that the distribution from which the data were sampled was log-normal, for example. Applying a log transform (natural log, base 10, etc,) will tend to make the variances less different among the groups and may also improve normality of the samples.
Fourth, if the violated assumption involves variances differ across different groups or levels of the factors or predictors, then there are more sophisticated alternatives, including use of Generalized Linear Models and creating a model to capture the relationship between predictor means and variances. Additionally, Weighted Least Squares (WLS) can be employed, giving more weight to observations with smaller variances.
Fifth, if a nonparametric test is available, you might use it instead of the parametric test. For example, we introduced the Levene’s test of equal variances as a better choice than the parametric F test. Additionally, there are many nonparametric alternatives to parametric tests. For example, t-tests are parametric and their non-parametric alternatives include tests like Wilcoxon and Mann-Whitney. ANOVA, too is parametric, and its nonparametric alternative version is called rank ANOVA (see also Kruskal-Wallis). See Chapter 15 for nonparametric tests.
Finally, a resampling approach could be taken, where the data themselves are used to generate all possible outcomes like the Fisher Exact test; with large sample size, bootstrap or Jackknife procedures are used (Chapter 19).
For now, let’s introduce you to the kinds of nonparametric statistical tests for which the t-test is just one example. For the independent sample t-test, our first method to account for the possible violation of equal variances is a parametric test, Welch’s variation of the Student’s t-test. Instead of the pooled standard deviation, Welch’s test accounts for each group’s variance in the denominator.

The degrees of freedom for the Welch’s test are now

where df for Student’s t-test was  . Note that Welch’s test assumes normal distributed data.
Note 1: In R and therefore R Commander, the default option for conducting the t-test is Welch’s version, not the standard t-test (Fig 1).
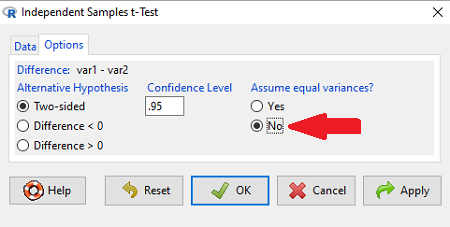
Figure 1. Screenshot of Rcmdr options menu for independent t-test. Red arrow points to default option “No,” which corresponds to Welch’s test.
See discussions in Olsen (2003), Choi (2005), and Hoekstra et al (2012).
How to report choices made about data transformations?
Eventually, with all of the analysis completed, one has to decide what to report. We touched on How to Report Statistics in Chapter 4. However, that chapter emphasized a balance between reporting results in sentences, tables, or as graphics. Here, we need to emphasize a different quality about reporting of statistical methods, that is, transparency. In both reporting contexts — how to report the results and how to report any data transformations — the goal is to provide sufficient detail so that the reader can follow (reproducibility criteria). If guidance presented on Chapter 13.1 and on this page is taken literally, there would seem to be a nearly endless number of graphs and statistical results to report. Clearly, this can’t be the answer.
For students in BI311 there should be clear guidance for what is expected for reporting in homework. More generally, when analysis leads to a completed project ready for reporting at conference or as a journal article, then the goal is to provide enough information so that the reader can evaluate the choices you made.
Consider the body mass data presented on this page. Results of various tests on both raw and log10-transformed data were provided. The context was check of normality assumption, and, based on the results we should conclude that the log10-transformed data better achieved the assumption of normality. Therefore, we would not report all the figures from Chapter 13.1: Figure 2, Figure 3, Figure 4, Figure 5, and Figure 6. I would report only Figure 2 — the raw data– with a few sentences: “The data were log10-transformed to address violations of normality assumption. Normality was assessed by calculation of the moment statistics skewness and kurtosis and Q-Q plots. All subsequent tests were conducted on the log10-transformed data set.” I wouldn’t report the exact results of the Q-Q plots or the moment statistics, but would include names or references to the specific tests used.
Note 2: Log10-transform would also likely improve unequal variances. Therefore, I would need to modify my sentences to account for this, eg, “The data were log10-transformed to address violations of normality and equal variance assumptions.”
Questions
Please skim read articles about statistical assumptions for common statistical tests:
- Choi (2005), click link to article.
- Hoekstra et al. (2012), click link to article.
- Olsen (2003), click link to article.
From the articles and your readings in Mike’s Biostatistics Book, answer the following questions
- What are some consequences if a researcher fails to check statistical assumptions?
- Explain why use of graphics techniques may be more important than results of statistical tests for checks of statistical assumptions.
- Briefly describe graphical and statistical tests of assumptions of (1) normality and (2) equal variances
- Pick a biological research journal for which you have online access to recent articles. Pick ten articles that used statistics (e.g., look for “t-test” or “ANOVA” or “regression”; exclude meta analysis and review articles — stick to primary research articles). Scan the Methods section and note whether or not you found a statement that confirms if the author(s) checked for violation of (1) normality and (2) equal variances. Construct a table.
- Review your results from question 3. Out of the ten articles, how many reported assumption checking? How does your result compare to those of Hoekstra et a; (2012)?
Quiz Chapter 13.2
Why tests of assumption are important
Chapter 13 contents
- Introduction
- ANOVA Assumptions
- Why tests of assumption are important
- Test assumption of normality
- Tests for Equal Variances
- References and suggested readings