2.5 – Scientific method and where statistics fits
- Science isn’t just a recipe.
- Hypothetico-deductive reasoning.
- It’s all about the probability of a particular event.
- A statistical translation of the Scientific Method.
- When we say “experiment,” the hypothesis came first.
- Bottom-up, Top-down.
- How to interpret a test result.
- False discovery rate: claims must be stringently evaluated.
- Projects and the data lifecycle.
- Conclusions.
- Questions.
- Quiz.
- Chapter 2 contents .
Science isn’t just a recipe.
.
The scientific method is what makes science a “powerful way of knowing” (Church and Carpenter 2008), and by now, you should be familiar with the outline: hypothesis, experiment, etc. What distinguishes science from other fields of inquiry is that at its best, science accumulates verifiable evidence about our world. I begin with a disclaimer — our introductory textbooks tend to reify the scientific method (cf. Blachowicz 2009). Outside of the classroom and introductory science text books, I don’t think you’ll find much agreement among practicing scientists precisely what the scientific method entails, or whether strict adherence to a list of steps distinguishes what scientists do compared with other professions. For one difference, typical discussions of the scientific method may emphasize the experiment, which probably brings to mind images of a lab coat and test tubes, but should emphasize the critical thinking “tool kit” (Wivagg and Allchin 2002), eg, model-based inquiry. That said, holding a view that introductory textbooks should present nuances of epistemology seems a big ask.
But we do emphasize experimentation with good reason. In principle it is straightforward to identify what control groups are needed to conduct an experiment in the lab, but what are the control groups for an experiment conducted on the computer? In most cases, one should argue that if an outcome is obtained by random processes, then no additional cause need be addressed. Therefore, the control group for a simulation would be a random process generator.
Disagreements about the scientific method center about how science is really done (eg, from a social perspective), but also because there appear to be differences in approach in sciences that work on historical questions (physical cosmology, evolutionary biology, geology), and those that conform to the classic experimental approach (chemistry, molecular biology, physics). Epistemology is a fascinating area — How do we know what we know, What exactly is science and how is it different from other areas of knowing, etc. But I will leave you only with the tantalizing suggestion to read more and start with you with a list of readings to start (see Readings below). This is the stuff of graduate and professional school; we have work to do.
Despite apparent differences between what scientists say they do and how they actually do sciences, there is broad agreement; science as a way of knowing can be characterized by the following steps (National Academy of Sciences 1999).
- Begin with facts, which are observations confirmed and treated as true
- Formulate a hypothesis, with emphasis on hypotheses that are testable statements about relationships observed about the natural world
- Given the possible outcomes, state predictions derived from the hypothesis.
- Make observations of perform an experiment designed to test the hypothesis.
- Analyze the data from the experiment.
- Evaluate the results of the experiment against the predictions.
- Repeat.
This deceptively simple list hides much work to be done. Hypotheses are not “educated guesses,” where educated guess implies an idea about some phenomenon is likely the correct explanation because of the skill or knowledge of the person making the guess. Good hypotheses make possible experimental tests whose results can be used to rule out alternative explanations, sensu Platt’s “strong-inference”.
Hypothetico-deductive reasoning.
.
I mention this disclaimer about the common (and reassuring) textbook discourse on the scientific method to suggest that, if you have not already reached this point in your career, it is time to move past the cookbook approach to thinking about what it means to do science in practice. Yet another helpful reading is from a paper in Environmental Health by Ozonoff amd Grandjean (2020).
In other words, what makes “good science”?
There is induction and deduction and probabilistic thinking that must be grappled with, all emphasizing efforts by the individual, and yet science, if it is to make any progress must ultimately be a communal activity (Varmus 2009). In particular, to the extent a researcher consistently applies hypothetico-deductive reasoning, or as Platt (1964) called it, “strong-inference,” then good science can happen (see Fudge 2014 for an update). Strong inference according to Platt implies that researchers should follow three steps (after Fudge 2014):
- develop alternative hypotheses
- think of a crucial experiment that can exclude one or more hypotheses
- perform the experiment and obtain a clean result.
Then, beginning with step 1, repeat the procedure to refine the possibilities that remain.
The list of elements of the scientific method neglected to address the crucial role of scientists engaged in an active community of scientists fits in. However, we can can quickly suppose that every step of the scientific method can involve input from others to help shape, improve, and indeed carry out the activities needed to practice science. What scientists share is critical thinking and the tools of statistics provides a common language.
It’s all about the probability of a particular event.
.
Platt (1964) wrote that the observations we make that are puzzling or hard to explain, which implies our understanding is incomplete. We then proceed to ask questions about why the observations are different from our expectations, and we speculate about how the outcome comes about. Thus, we have to consider the probability, or chance, of a particular outcome (event) compare to other possible outcomes. Statistics is about analyzing the probability of outcomes. But there is a twist; there are two distinct, but complementary approaches to statistics. Most of the statistics you have been taught so far comes from the frequentist approach. That is, how often (frequency) will we get the kind of results we observe given the hypothesis? Another approach can be termed Bayesian, where the question is how likely is the hypothesis to be correct given the data? These two approaches view the data obtained from the same experiment differently. A frequentist views the data as random — repeat the experiment and the results will differ — but the hypothesis is fixed (it is either true or it is not). A Bayesian on the other hand views the hypothesis as random with a probability of being true somewhere between zero and 100 percent and the data are fixed.
Which are you, a frequentist, or a Bayesian? Consider the following from xkcd.com no. 1132 (Fig. 1).
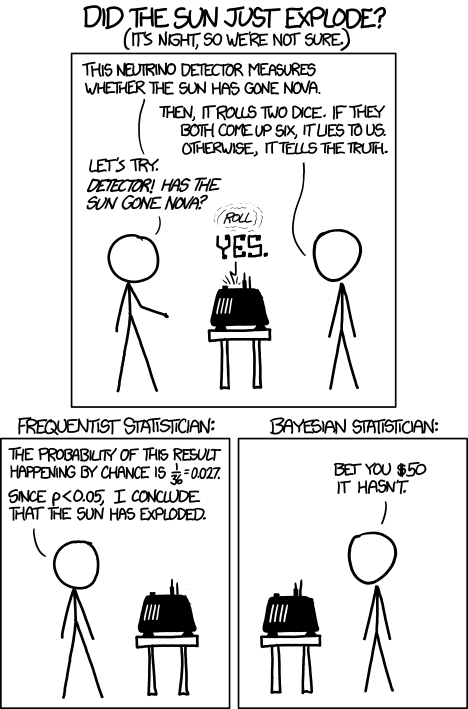
Figure 1. “Frequentists vs Bayesians,” xkcd.com no. 1132
The Bayesian approach makes sense when there exists prior knowledge — the Sun came up this morning, as it did the day before, and the day before that, etc. New data are assessed against what we already know. The Frequentist approach, despite philosophical shortcomings, works for analyzing experiments where prior knowledge is lacking about outcomes. Because much of biomedical research is based on the Frequentist approach, most of our efforts, too, will utilize that approach.
A statistical translation of the Scientific Method.
.
Given our frequentist perspective, we can outline our Scientific Method as follows.
- Formulate a Null and an Alternative hypothesis.
- State predictions from the Null and an Alternative hypotheses.
- Design an experiment or observation.
- Analyze the data from the experiment or observation.
- Interpret the experiment or observation.
- Evaluate the predictions from the Null and an Alternative hypotheses.
- Accept (provisionally) or reject (provisionally) the Null hypothesis.
- Evaluate model fit and robustness
- Repeat.
In practice, there is more to statistics than these 8(9) steps, but this does provide the outline of what statistical analyses are about. There are nuances to how a Frequentist or a Bayesian views statistical analyses as evidence for or against a conclusion (Goodman 1999a, 1999b). We need to distinguish between when data are acquired in the process; data may come before or after the hypotheses are stated. In epistemology, hypotheses are either a priori or a posterori and we need to add these to our discussion of Scientific Method. The terms are Latin, translated apparently as “from the earlier” and “from the later, respectfully.
Note from the lists described as “the” scientific method how hypothesis comes first. Folks who think and write about how and why we know what we know — the discipline is called epistemology — tell us we are generally on more solid footing when we design experiments with specific intent, specific and testable hypotheses. The branch of statistics concerned with experimental design provides rich context for many practical aspects of how to implement experiments — in other words, how to follow the Scientific Method, even if turns out there isn’t just one universal definition of Scientific Methods out there.
When we say “experiment,” the hypothesis came first.
.
More commonly in statistics, the phrases planned, and therefore a priori, and unplanned or a posterori, comparisons are referenced. In practice, biologists design experiments and make observations accordingly to test one or more hypotheses, but they may also address additional hypotheses after the fact. Especially if the experiment generates a lot of data.
You may have also heard of the phrase data mining. Data mining is loosely defined, but mostly refers to sets of protocols and procedures to extract patterns from large data sets stored in databases. Google apparently does lots of data mining as do many other businesses that obtain large amounts of data. Unplanned comparisons includes any data mining protocols, no matter how sophisticated the language sounds (feature selection, classification tree). Data mining is not consistent with classic experiments; it’s different than Step 6 (Step 8 in the second list) listed above because no new data or experiment is carried out.
Can you get away with coming up with and testing new hypotheses from data gathered from an experiment designed to test a different hypothesis? Yes, and of course, the process can be quite profitable for Google. However, you should proceed with caution and restraint. If you are not careful about how you write it up — you will probably be called on it by a reviewer of your work. Is this a posterori approach still science? Of course, yes! I’d even go so far as to say that when one studies real systems, you can’t limit yourself to only planned hypotheses and testing. At least, one designs experiments and carries out those tests but then also uses current data to generate new ideas. Science is also exploratory — you may not design an experiment at all, but through observations, you probably will develop testable hypotheses! We’ll return to these concepts soon. What you must be aware of in any unplanned comparison or data mining sojourn is the possibility of committing a data dredging (aka p-hacking) sin — searching through data to come up with misleading, but statistically “significant” results (Ioannidis 2007; Stefan and Schönbrodt 2023).
Testing of unplanned a posterori hypotheses is a real concern in science. On the one hand, those who think about how we learn about the world and make sense of it have stated emphatically that the best way we know is to follow the scientific method — and that begins with hypotheses followed by designed experiments to test claims derived from those a priori hypotheses. We (teachers, textbook author) continue to teach science as the act of individuals toiling away in the forest or in the lab, pursuing sets of questions that may involve the collection of measurements on dozens to a few hundred subjects. While this type of science is still in practice, there is no doubt that big science involving many people is more common and, perhaps, better at generating new knowledge (Wuchty et al 2007). One result of “big science” is to generate a lot of data, the very essence now of big data, and there must be room for testing of new hypotheses gathered on data sets. This is the essence of the argument for the ENCODE project (ENCODE Project Consortium 2012) — generate lots of genetic data on the human genome using common techniques and make the data publicly available — new research can be conducted on old data.
Bottom-up, top-down.
.
Consider the pronouncements (almost daily it seems!) about the discovery of a new gene for some disease, process, or behavior in humans. Often times, although not always, these “discoveries” are not duplicated by other research groups. Why not? Well, for one, the phrase “gene for” is a dubious shorthand for what is usually a more complex causation. But from our statistical perspective it is problematic because the search for genes is really an a posterori exercise — one begins with phenotypic differences (some have the disease, others do not) and some genetic information (SNPs, DNA sequencing) and then proceeds to see if there are any differences in the genetic material at hand between the two groups. This approach, the Genome Wide Association Study, or GWAS, would be termed “top-down” — begin with the phenotypic differences and search for genetic differences between those that do and those who do not have the condition. Sampling is an issue (are the unaffected subjects a random sample from the entire population?), but the problem also is one of logical design — the hypothesis is made after the fact — a statistical difference between the groups is attributed to a particular genetic difference.
Case-control subjects, where patients with the condition are matched with other individuals who do not have the condition, but match in other ways (eg, age, income, etc.), are enrolled in such studies because there can be no random assignment of subjects to treatment. Case-control subjects are selected such that affected and unaffected individuals are matched by characteristics in as many meaningful ways as possible (eg, age, gender, income, etc.). Because many tests are conducted in GWAS studies, ie, is there a difference between the control and affected group for the first gene, the second gene, and so on up to the number of genes on the microarray chip (10,000 or more genes), the chance that any particular association is a false positive is high, discussed further when we cover Risk Analysis in Chapter 7.
How to interpret a test result.
You are a medical doctor reading the results of a test for three-month average glycated hemoglobin, A1C, levels for your patient. For example, A1C above 6% is considered strong marker of diabetes. A marker, yes, but not the same as a guarantee that a person has diabetes. A false positive (FP) is the case where a test result is positive, but the subject in fact does not have the condition. False positive is equal to the ratio of
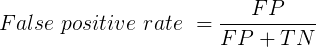
where FP is number of false positive readings and TN refers to the true negative, those who in fact do not have the condition.
In Chapter 7 we will spend some time on risk analysis. To introduce this important subject in biostatistics, we’ll begin with an example. A study of 15,934 subjects without diagnosed diabetes found 3.8% or 605 individuals had elevated A1C levels, or about 7.1 million adults not yet diagnosed with diabetes (Selvin et al 2011). About 90% of these individuals also had fasting glucose levels greater than 100 mg/dL, i., diabetic. This is clearly a good test. However, note that 10% of the 605 individuals had elevated A1C, but fasting glucose levels less than 100 mg/dl, ie, did not meet the diagnostic of type 2 diabetes. Thus, the false positive rate is about 0.4%, or nearly 30,000 adults with elevated A1C without diabetes.
Working through frequencies can be challenging, so applying a natural number approach helps. Having just read through the frequencies and percentages, now look at how they translate to probability tree (Fig. 2). Start by utilizing a per capita rate standard: for proportions in the 10 – 20% range, a standard 1000 persons works well (Fig. 2).
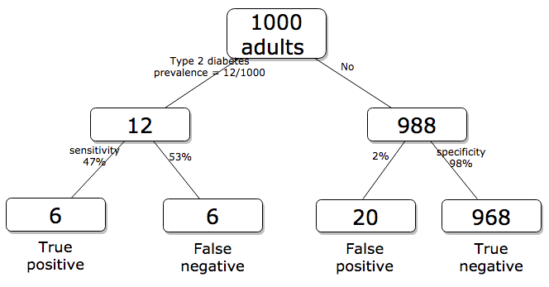
Figure 2. Probability tree diagram with prevalence of type 2 diabetes and sensitivity, specificity of A1C test, data from CDC and Selvin et al 2011. Tree drawn with free diagrams.net app.
How many expected to have A1C above 6%? Twenty-six total positives, only 23% are true positives. An important lesson is that if the prevalence of a condition is low, then any diagnostic test with high sensitivity necessarily will identify many false positives.
False discovery rate: claims must be stringently evaluated.
.
The genome scientists involved in GWAS studies generally are aware of false positives, also termed false discovery rate (FDR), conduct statistical corrections to account for false positives (eg, Brzyski et al 2016), and generally are cautious in their interpretation. But not always. Studies of associations between autism and environment come to mind (eg, Waldman et al 2008), and recent developments in the direct-to-consumer genetic testing market also suggest that the limitations of these kinds of studies are not always represented.
There is a broader concern about the reliability of research, and the debate about how to improve reliability comes from a call to understand how to do statistics better and, more importantly to understand how statistics are to be used in making claims from statistical results (Ioannidis 2007; but see Goodman and Greenland 2007). A key element of scientific work is that findings are repeatable: results from one group should apply to other groups. One dictate to improve reproducibility — increase number of subjects in studies — is obvious, but given the cost of GWAS, currently an unreasonable demand.
In some cases, biologists already have a particular gene in mind, whose function is more or less known, and then the exercise follows the Scientific Method listing much more directly. This bottom-up approach leads to a straightforward, testable genetic hypotheses: a specific difference in genomic sequence predicts a difference in phenotype outcome. A good example is the identification of more than 100 different single nucleotide mutations, called single nucleotide polymorphisms or SNPs, in the CFTR gene of patients known to have cystic fibrosis disease (Castellani 2013). As of August 2018, the number of known pathogenic or likely pathogenic SNPs is now listed at 440 in the SNP database; to put this in some context, there are more than 40,000 reported single nucleotide polymorphisms for the CFTR gene (this number includes SNP duplicates).
Projects and the data lifecycle.
A requirement for our biostatistics course, students are asked to design and implement a research project during the semester (Hydorn 2019). The project can either be part of an ongoing student research project or solely confined to the biostatistics course. The topics are diverse, ranging from observational to experimental to systematic reviews from the disciplines of biology, environmental science, and public health. Examples of project ideas implemented in the biostatistics and related courses at Chaminade University include:
- effects of environmental stress on growth rates.
- 2D and 3D shape analysis of mollusk shells.
- Individual variation and fluctuating asymmetry of plant leaves and flowers along an altitudinal gradient
- several systematic reviews (meta analysis) of published works of interest to public health
- vaccination benefits and risks.
- pain management of over the counter vs prescription medication.
- efficacy of “alternative medicine” approaches to health.
- comparisons of types of medical insurance on patient outcomes of knee replacement therapy.
The justification for the project learning activity is that it provides hands-on opportunity to apply statistical and data sciences concepts to real-world problems. Students work through the challenges of developing a research question, identifying testable hypotheses, designing a study, collecting data, performing analysis, and interpreting results. Importantly, students must decide for themselves which statistical tests and methods are most appropriate for their unique data, rather than simply following a formula presented in a lecture. This connects abstract statistical ideas to practical application, promoting a deeper, more lasting understanding. We manage the projects by encouraging a research lab community: students discuss with their peers their ideas, their data collection and experimental design challenges, with the instructor serving to guide and mentor the multiple projects and intervene as needed to steer student projects towards completion.
Throughout the semester we model the project approach. Students are encouraged to create a working folder on their computer, while dividing homework and other assignments into named projects. Students are also asked to address aspects of their project’s data life cycle (Borgman 2019, Ezer and Whitacker 2019, Griffin et al 2018). A quick Google search on the phrase returns millions of hits (see Note 1), but key elements of the concept are that projects have a beginning and an end, and it is helpful — and in the case of our statistics course, required — to address project management.
Note 1: For example, “8 Steps in the Data Life Cycle,” by Tim Tobierski of Harvard Business School.
BI-311 students, see Homework 1: Project data life cycle in Mike’s Workbook for Biostatistics.
Projects include data generation and collection, data processing, storage and data management, data exploration and visualization, interpretation and reporting. Thus, students need to develop a data management plan, which includes how data are collected, application of best practices to insure data file and storage of images, and how to share the project results. We ask students to develop 10-min research talks, which are presented and recorded, suitable for ePortfolio inclusion.
Conclusions.
.
Epistemology, the theory of how knowledge is acquired, is a complicated business – what I want you to appreciate now is that planned and unplanned comparisons affect interpretation of your statistical results, how the difference is likely also to affect the reproducibility of your work. In the language or clinical trials and experimental design, planned and unplanned accompany prospective and retrospective studies (Chapter 5). A prospective study in the case of GWAS means genetic differences among individuals are known at the start of the study, and phenotypic differences arise naturally during the course of the study. Knowing the strengths and limitations of, for example, a planned retrospective study is at the heart of experimental design (Chapter 5).
In the biostatistics course, students are required to design and carry out an independent research project that integrates statistical methods with real-world problems in biology, environmental science, or public health. The course emphasizes hands-on learning through the full research process—from formulating questions to data collection, analysis, and interpretation—while fostering a collaborative research lab environment. Students also learn project and data management skills and conclude by presenting their findings in recorded research talks suitable for inclusion in an ePortfolio.
Questions.
- Write up three learning outcomes for this page. Hint: Point your favorite generative AI to this page and ask for help.
- Above we described how GWAS studies are generally top-down; What would constitute a bottom-up approach to GWAS?
- In your own words provide pro and con points of view on data mining of large data sets.
- Create a stylized infographic, like a mind map, to illustrate the data life cycle for a one semester research project.
Quiz Chapter 2.5
Scientific method and where statistics fits
Chapter 2 contents
.