20.13 – How to get the distances from a distance tree
Introduction
Extract the patristic distance, the sum of the branch lengths that link two nodes in a tree, for each pair of species.
This distance — see our Chapter 16.6 – Similarity and Distance— is the proportion (p) of amino acid (or nucleotide for DNA or RNA) sites at which the two sequences to be compared are different. It is obtained by dividing the number of amino acid differences by the total number of sites compared. It does not make any correction for multiple substitutions at the same site or differences in evolutionary rates among sites. On a gene tree (Fig. 1), distances are the lengths of the branches connecting the taxa. We want to know how different are two species for the given protein? That’s the distance between them in proportion of amino acid sites that are different by total number compared.
Example
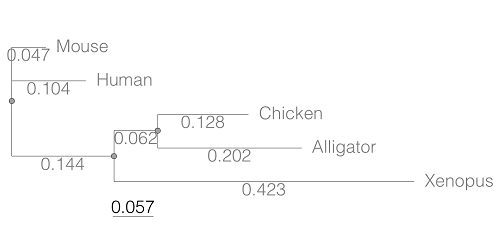
Figure 1. A gene tree of the product (protein HBA1) with five species.
Here’s the Newick format for the tree (HBA1.nwk)
(Mouse:0.0474516,Human:0.104063,((Chicken:0.127652,Alligator:0.202421):0.0616593,Xenopus:0.422801):0.143939);
R code to extract distances and output sorted, pairwise comparisons to a text file
library(ape)

# Create a function
getDis <- function(tree, tips) {
     myTree <- cophenetic(tree)
     myTree <- myTree[,tips]
     xy <- t(combn(colnames(myTree), 2))
     xy <- xy[order(xy[,1], xy[,2]),]
     myOut <- data.frame(xy, myTree[xy])
     colnames(myOut) <- c("Spp1", "Spp2", "Distance")
   return(myOut)
}

# Read a tree file, Newick format
tree5 <-read.tree(text="(Mouse:0.0474516,Human:0.104063,((Chicken:0.127652,Alligator:0.202421):0.0616593,Xenopus:0.422801):0.143939);")

# get taxa names from the tree file
all.tips <- tree5$tip.label; all.tips

# Run the function
myDis <- getDis(tree5, all.tips)

# Check the output
head(myDis)

# Create the results file
write.csv(myDis, file = "my_out.txt")
Example output from head(myDist)
       Spp1    Spp2  Distance
1 Alligator Xenopus 0.6868813
2 Chicken Alligator 0.3300730
3 Chicken   Xenopus 0.6121123
4 Human   Alligator 0.5120823
5 Human     Chicken 0.4373133
6 Human     Xenopus 0.6708030
The function sorts first by Spp1, then by Spp2.
Molecular clock plot
Collect divergence times from timetree.org
| Spp1 | Spp2 | Time (median MYA) |
| Alligator | Xenopus | 352 |
| Chicken | Alligator | 245 |
| Chicken | Xenopus | 352 |
| Human | Alligator | 319 |
| Human | Chicken | 319 |
| Human | Xenopus | 352 |
A scatterplot of distance HBA protein sequence by log10-transformed millions of years ago divergence time shown in Figure 2. Note, although tempting, calculating the slope from a linear regression to estimate the rate of evolution would not be appropriate without accounting for the lack of independence of the data (see Phylogenetically independent contrasts). Better methods exist, including calculating rate of change after fitting a model that assumes a strict clock vs relaxed clock.
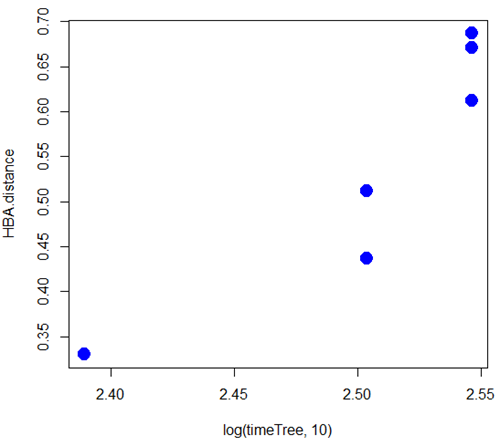
Figure 2. Scatterplot HBA distance by logMYA divergence time
Questions
[pending]
Suggested readings
Bevan, R. B., Lang, B. F., & Bryant, D. (2005). Calculating the evolutionary rates of different genes: a fast, accurate estimator with applications to maximum likelihood phylogenetic analysis. Systematic biology, 54(6), 900-915.
Chapter 20 contents
- Additional topics
- Area under the curve
- Peak detection
- Baseline correction
- Surveys
- Time series
- Dimensional analysis
- Estimating population size
- Diversity indexes
- Survival analysis
- Growth equations and dose response calculations
- Plot a Newick tree
- Phylogenetically independent contrasts
- How to get the distances from a distance tree
- Binary classification
- Meta-analysis
/MD