5.2 – Experimental units, Sampling units
Introduction.
Sampling units refer to the measured items, the focus of data collection; samples are selected from populations. Often, sampling units are the same thing as individuals. For example, if we are interested in the knowing whether men are more obese than women in Hawai’i, we would select individuals from the population; we would measure individuals. Thus, the sampling unit would be individuals, and the measurement unit would be percent body fat recorded for each individual. The data set would be the collection of all body fat measures for all individuals in the study, and we would then make inferences (draw conclusions) about the differences, if any, between adult males and females for body fat.
But sampling units can also refer to something more restrictive than the individual. For example, we may be interested in how stable, or consistent, is a person’s body fat over time. If we take a body fat measure once per year over a decade on the same group of adults, then the sampling unit refers to each observation of body fat recorded (once per year, ten times for an individual), and the population we are most likely to be referring to is the collection of all such readings (ten is arbitrary — we could have potentially measured the same individual thousands of times).
In some cases the researcher may wish to compare groups of individuals and not the individuals themselves. For example, a 2001 study sought to see if family structure influenced the metabolic (glycemic) control of children with diabetes (Thompson et al 2001). The researchers compared how well metabolic control was achieved in children of single parents and two-parent families. Thus, the sampling units would be families and not the individual children.
Experimental units.
Experimental units refers to the level at which treatments are independently applied in a study. Often, but not always, treatments are applied directly to individuals and therefore the sampling units and experimental units in these cases would be the same.
Question 1: What is the sampling unit in the following cell experiment?
A technician thaws a cryo tube containing about ½ million A549 cells (Foster et al 1998) and grows the cells in a T-75 culture flask (the 75 corresponds to 75 cm2 growing area) in a CO2 incubator at 37 °C. After the cells reach about 70% confluency, which may represent hundreds of thousands of cells, the technician aliquots 1000 cells into twelve wells of a plate for a total of 12000 cells. To three wells the technician adds a cytokine, to another three wells he adds a cytokine inhibitor, and to another three wells he adds both the cytokine and it’s inhibitor, and to the last three wells he adds DMSO, which was the solvent for both the cytokine and the inhibitor. He then returns the plate to the incubator and 24 hours later extracts all of the cells and performs a multiplex quantitative PCR to determine gene expression of several target genes known to be relevant to cell proliferation.
The described experiment would be an example of a routine, but not trivial procedure the technician would do in the course of working on the project in a molecular biology laboratory.
The choices for numbers provided in the description we may consider for the number of sampling units are:
- 1000 cells
- 12,000 cells
- ½ million cells
- 3 wells
- 12 wells
- The target genes
- None of the above
The correct answer is E, the 12 wells. In experimental design, the experimental/sampling unit is the smallest physical entity to which a specific treatment is independently applied and from which a measurement is taken. Treatments (cytokine, inhibitor, both, or DMSO) are applied to individual wells, and all cells within a single well are harvested and pooled together for a single qPCR measurement.
To find the sampling unit, work backward from the qPCR measurements to find the smallest entity that is independently treated and measured. The target genes are simply the response variables being measured, and individual cells are not independent because all 1,000 cells in a well share the same medium, receive the same treatment, and are pooled together during extraction. While all cells originate from a single thawed cryo tube, that tube represents the shared stock population rather than the sampling unit. Because the technician independently applies treatments to and harvests each of the 12 wells, each well acts as an independent sampling unit, making the correct answer E. 12 wells.
Experimental and sampling units often, but not always the same.
Question 2: What is the experimental unit in the described cell experiment?
- 1000 cells
- 12,000 cells
- ½ million cells
- 3 wells
- 12 wells
- The target genes
- None of the above
The correct answer is E, 12 wells. Noted above, the technician applied treatments to 12 wells. DMSO was added to all wells. There were three treatments, cytokine, inhibitor, and cytokine-inhibitor (Table 1).
In this experiment, the experimental unit and the sampling unit are both 1 well. They would differ under two main circumstances:
- Subsampling Within a Well: If the technician applies treatments to the 12 wells but measures individual cells (eg, via single-cell RNA-seq) or splits each well’s extract into multiple qPCR reactions, the experimental unit is 1 well (12 total), while the sampling unit is 1 cell or 1 reaction.
- Treating a Larger Group at Once: If the technician places four 3-well plates into four different incubators (eg, varying CO2 levels) and still harvests each well separately, the treatment is applied to the whole plate. Here, the experimental unit is 1 plate (4 total), while the sampling unit remains 1 well (12 total).
How This Connects to Pseudoreplication
When the experimental and sampling units differ, pseudoreplication occurs if you treat the smaller sampling units as independent experimental units in your statistical analysis (Hulbert 1984; Lazic 2010; Lazic et al 2018). For example, if we measured 100 individual cells from each of the 12 wells and ran a statistical test with n = 1,200 instead of accounting for the 12 wells, you would artificially inflate your sample size and risk false-positive results.
Table 1. Translate experiment description to a table to better visualize the design
| Wells | Treatment |
|---|---|
| A1 | Cytokine |
| A2 | Cytokine |
| A3 | Cytokine |
| A4 | DMSO |
| B1 | Inhibitor |
| B2 | Inhibitor |
| B3 | Inhibitor |
| B4 | DMSO |
| C1 | Cytokine+Inhibitor |
| C2 | Cytokine+Inhibitor |
| C4 | Cytokine+Inhibitor |
| C4 | DMSO |
Replication: Groups and individuals as sampling units.
The correct identification of levels at which sampling independence occurs is crucial to successful interpretation of inferential statistics.
Note 2
Replication in Table 1: three cytokine, three cytokine-inhibitor, three with both.
Sampling error rate is evaluated at the level of the sampling units. Technical replication of sampling units allows one to evaluate errors of measurement (eg, instrument noise) (Blainey et al 2014) and other sources of technical sources of noise.
Note 3
Data noise refers to random or irrelevant information that corrupts the “true” signal in a dataset, introducing variability and potential errors. A nuisance variable is a specific type of noise that is fundamental to the data collection process but not of interest to the researcher, and its effect must be accounted for or removed via pre-processing steps. For approaches to control for noise, see Chapter 17.4 and Chapter 20.3 for more.
Replication of sampling units increases statistical power, the ability to correctly reject hypotheses. If the correct design reflects sampling units are groups and not individuals, then by counting the individuals as the independent sampling units would lead the researcher to think his design has more replication than it actually does. The consequence on the inferential statistics is that he will more likely reject a correct null hypothesis, in other words, the risk of elevated type I error occurs (Chapter 8 – Inferential statistics). This error, confusing individual and group sampling units, is called pseudoreplication (Lazic 2010).
Consider a simpler experimental design scenario depicted in Figure 2: Three different water treatments (eg, concentrations of synthetic progestins, Zeilinger et al. 2009) in bowls A, B, and C; three fish in bowl A, three fish in bowl B, and three fish in bowl C. The outcome variable might be a stress indicator, eg, plasma cortisol (Luz et al 2008).
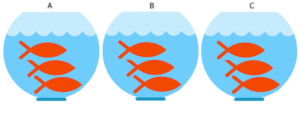
Figure 2. Three aquariums, three fish. Image modified from https://www.pngrepo.com/svg/153528/aquarium
Question 3: What were the experimental units for the fish in the bowl experiment (Fig 2)?
- Three bowls
- Nine fish
- Three water treatments
The correct answer is A, 3 bowls. The treatments were allocated to the bowls, not to individual fish. The three fish in each bowl provides technical replication for the effects of bowl A, bowl B, and bowl C, but does not provide replication for the effects of the water treatments. Adding three bowls for each water treatment, each with three fish, would be the simplest correction of the design, but may not be available to the researcher because of space or cost limitations. The design would then include nine bowls and 27 fish. If resources are not available to simply scale up the design, then the researcher could repeat the study several times, taking care to control nuisance variables (Chapter 5.3). Alternatively, if the treatments were applied to the individual fish, then the experimental units become the individual fish and the bowls reduced to a blocking effect (Chapter 14.4), where differences may exist among the bowls, but they are no longer the level by which measurements are made.
Note 4
If pseudoreplication is present in a study, then this may be accounted for by specifying the error structure in a linear mixed model (eg, random effects, blocking effects, etc., see Chapter 14 and Chapter 18).
Question 4: What were the sampling units for the fish in the bowl experiment (Fig 2)?
- Three bowls
- Nine fish
- Three water treatments
The correct answer is B, the individual fish. If instead of aqueous application of synthetic progestin, treatments were applied directly to each fish via injection, what would be the answers to Question 3 and Question 4?
Choices like these clearly involve additional compromises and assumptions about experimental design and inference about hypotheses.
Conclusion.
Sampling units, experimental units, and the concept of level at which units are independent within an experiment were introduced. Lack of independence yields the problem of pseudoreplication in an experiment, which will increase the chance that we will detect differences between our treatment groups, when no such difference exists!
Questions.

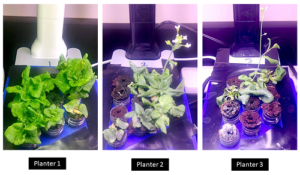
Figure 3. Three Miracle-Gro AeroGarden planters®, each with nine seedlings of an Arabidopsis thaliana strain.
Nine seeds each of three strains of Arabidopsis thaliana were germinated in three Miracle-Grow AeroGarden® hydroponic planters (Fig 3). Each planter had nine or ten vials with sphagnum peat. All seeds from a strain were planted in the same apparatus, one seed per vial. With respect to this experimental design
1. Define experimental units and sampling units.
2. Provide design examples where the experimental units are the same as the sampling units.
3. With respect to the independent and dependent (outcome) variables, discuss impacts of nuisance variables.
Quiz Chapter 5.2
Experimental units, Sampling units