5.6 – Sampling from Populations
Introduction
Researchers generally can’t study an entire population. More generally, striving to study each member of a population is not necessary to arrive at answers about the population. For example, consider the question, does taking a multivitamin daily improve health? What are our options? Do we really need to follow every single individual in the United States of America, monitoring their health and noting whether or not the person takes vitamins daily in order to test (inference) this hypothesis? Or, can we get at the same answer by careful experimental design (see Schatzkin et al 2002; Dawsey et al 2014)? Supplement use is wide-spread in the United States, but both health and vitamin use differ by demographics. Young people tend to be healthier than older people and older people tend to take supplements more than younger people.
A subset of the population is measured for some trait or characteristic. From the sample, we hope to refer back to the population. We want to move from anecdote (case histories) to possible generalizations of use to the reference population (all patients with these symptoms). How we sample from the reference population limits our ability to generalize. We need a representative sample: simple to define, hard to achieve.
Statistics becomes necessary if we want to infer something about the entire populations. (Which is usually the point of doing a study!!) Typically tens to thousands of individuals are measured. But in addition, HOW we obtain the sample of individuals from the reference population is CRITICAL.
Kinds of sampling include (adapted from Box 1, Tyrer and Heyman 2016; see also McGarvey et al 2016)
Probability sampling
- random
- stratified
- blocking
- clustered
- systematic
Nonprobability sampling
- convenience, haphazard
- judgement
- quota
- snowball
For an exhaustive, authoritative look at sampling, see Thompson (2012).
How can samples be obtained?
Sampling from a population may be convenient. For one famous example, consider the Bumpus data set. (We introduced this data set in Question 5, Chapter 5.) So the legend goes, Professor Bumpus was walking across the campus of Brown University, the day after a severe winter storm, and came across a number of motionless house sparrows on the ground. Bumpus collected the birds and brought them to his lab. Seventy-two birds recovered; 64 did not (Table1).
Table 1. A subset of Bumpus data set, summarized by sex of birds.
| House sparrows | Lived | Died |
|---|---|---|
| Female | 21 | 28 |
| Male | 51 | 36 |
Bumpus reported differences in body size that correlated with survival (Bumpus 1899), and this report is often taken as an example of Natural Selection (cf. Johnston et al 1972). The Bumpus dataset is clearly convenience sampling. It’s also a case study: a report of a single incident. But given that is is a large sample (n = 136), it is tempting to use the data to inform about about possible characteristics of the birds that survived compared with those that perished.
Another way we collect samples from populations is best termed haphazard. In graduate school I got the opportunity to study locomotor performance of whiptail lizards (Aspidoscelis tigris, A. marmoratus, genus formerly Cnemidophorus**) across a hybrid zone in the Southwest United States (Dohm et al. 1998). During the day we would walk in areas where the lizards were known to occur and capture any individual we saw by hand. (This would sometimes mean sticking our hands down into burrows, which was always exciting — you never really knew if you were going to find your lizard or if you were going to find a scorpion, venomous spider, or …) Lizards collected were returned to the lab for subsequent measures. Clearly, this was not convenience sampling; it involved a lot of work under the hot sun. But just as clearly, we could only catch what we could see and even the best of us would occasionally lose a lizard that had been spotted. Moreover, one suspects we missed many lizards that were present, but not in our view. Lizards that were underground at the time we visited a spot would not be seen nor captured by us; individual lizards that were especially wary of people (Bulova 1994) would also escape us. In other words, we caught the lizards that were catchable and can only assume (hope?) that they were representative of all of these lizards. Applying a grid or quadrant system to the area and then randomly visiting plots within the grid or quadrant might help, but still would not eliminate the potential for biased sampling we faced in this study.
Quota sampling implies selection of subjects by some specific criteria, weighted by the proportions represented in the population. It’s different from stratified sampling because there is no random selection scheme: subjects are selected based on matching some criteria, and collection for that group stops when the sample number matches the proportion in the population. Consider our vitamin supplement survey. If student population at Chaminade University was the reference population, and we have enough money to survey 100 students, then we would want a sample of 70 women students and 30 male students, representing the proportions of the student population.
Snowball sampling implies that you rely on word-of-mouth to complete sampling. After initial recruitment of subjects, sample size for the study increases because early participants refer others to the researchers. This can be a powerful tool for reaching underrepresented communities (eg, Valerio et al 2016).
Types of Probability sampling
Random sampling is an example of probability sampling. As we defined earlier, simple random sampling requires that you know how many subjects are in the population (N) and then each subject has an equal chance of being selected

Examples of nonprobability sampling include
- convenience sampling
- volunteer sampling
- judgement sampling
Convenience sampling (the first 20 people you meet at the library lanai); volunteer sampling (you stand in front of a room of strangers and ask for any ten people to come forward and take your survey — or more seriously, persons with a terminal disease calling a clinic reportedly known to cure the disease with a radical new, experimental treatment), and judgement sampling (to study tastes in fashion, you decide that only persons over six feet tall should be included because .…).
Random in statistics has a very important, strict meaning. As opposed to our day-to-day usage, random sampling from a population means that the probability that any one individual is chosen to be included in a sample is equal. Formally, this is called simple random sampling to distinguish it from more complex schemes. For a sampling procedure to be random requires a formal procedure for sampling a population with known size (N).
For example, at the end of the semester, I may select the order for student presentations at random. Thus, students in the classroom would be considered the population (groups of students are my sample unit, not individual students!). What is the probability that your group will be called first? Second? We need to know how many groups there are to conduct simple random sampling. Let’s take an extreme and say that all groups have a size of one; there are 26 students in this room, so

or
![\[p=0.0385\]](https://biostatistics.letgen.org/wp-content/ql-cache/quicklatex.com-3245def7444e6f340661142b6c6dd9ef_l3.png "Rendered by QuickLaTeX.com")
of being selected first.
Now to determine the probability of your group being selected second, we need to distinguish between two kinds of sampling:
- Sampling with replacement — after I select the first group, the first group is returned to the pool of groups that have not been selected. In other words, with replacement, your group could be selected first and selected second! The probability of being selected second then remains
![\[p= \frac{1}{26}\]](https://biostatistics.letgen.org/wp-content/ql-cache/quicklatex.com-8535b199acd8acd9f2ea6ee217d9c065_l3.png "Rendered by QuickLaTeX.com")
.
- Sampling without replacement — after I select the first group, then I have
![\[26 -1=25\]](https://biostatistics.letgen.org/wp-content/ql-cache/quicklatex.com-2ba74aa260c2d84d22667281ebf95bc8_l3.png "Rendered by QuickLaTeX.com")
groups left to select the second group, so probability that your group will be second is
![\[p= \frac{1}{25}\]](https://biostatistics.letgen.org/wp-content/ql-cache/quicklatex.com-0becdbbdf1fa6ba7a9edee599208ab67_l3.png "Rendered by QuickLaTeX.com")
. The first group has already been selected and is not available.
Random sampling refers to how subjects are selected from the target, reference population. Random assignment, however, describes the process by which subjects are assigned to treatment groups of an experiment. Random sampling applies to the external validity of the experiment: to the extent that a truly random sample was drawn, then results may be generalized to the study population. Random assignment of subjects to treatment however makes the experiment internally valid: results from the experiment may be interpreted in terms of causality.
R code, sample without replacement
sample(26)
[1] 1 10 11 23 17 13 8 6 19 20 21 16 14 15 5 2 12 4 26 22 9 7 25 18 3 24
R code, sample with replacement
mySample <- sample(26, replace = TRUE); mySample
[1] 9 26 24 9 3 1 23 14 26 6 5 19 17 23 11 12 3 8 7 19 2 16 3 11 1 1
How many elements duplicated?
out <- duplicated(mySample); table(out)
out
FALSE TRUE
17 9
More on sampling in R discussed in Sampling with computers below.
Additional sampling schemes
Simple random sampling is not the only option, but in many cases it is the most desirable. Consider our multivitamin study again. Perhaps studying the entire USA population is a bit extreme. How about working from a list of AARP members, sending out questionnaires to millions of persons on this list, getting back about 20% of the questionnaires, sorting through the responses and identifying the respondent to diet categories and multivitamin use. The researchers had nearly 500,000 persons willing and able to participate in their prospective study (Schatzkin et al 2001; Dawsey et al 2014; Lim et al 2021). It’s an enormous study. But is this really much better than our described lizard experiment? Let’s count the ways: Not all older people are members of AARP (that 500,000? That’s less than 1% of the 50 and older persons in the USA); A large majority of AARP members did not return surveys; Some fraction of the returned surveys were not usable; How representative of diverse aged populations in the United States is AARP?
Simple random sampling may not be practical, particularly if sub-populations, or strata, are present and members of the different sub-populations are not available to the researcher in the same numbers. In ecology, habitat-use studies routinely need to account for the patchiness of the environment in space and time (Wiens 1976; Summerville and Crisp 2021). Thus, samples are drawn in such a way to represent the frequency within each sub-population.
For a simple example, researchers conducting a controlled breeding program of mice don’t use simple random sampling to choose pairs of mates; after all, random sampling without regard of sex of the mice would lead to some pairings of males only, or females only (Fig 1).
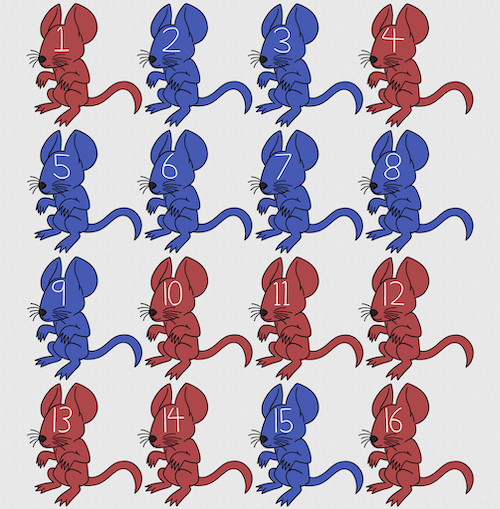
Figure 1. Sixteen mice, eight red and eight blue. Image © 2024 Mia D Graphics
R code
pairs <- c(rep("red", 8), rep("blue", 8))
replicate(2, sample(pairs, 8), simplify = FALSE)
[[1]]
[1] "blue" "blue" "blue" "red" "blue" "red" "blue" "red"

[[2]]
[1] "blue" "blue" "red" "red" "red" "red" "red" "blue"
Oops. If we interpret the output blue = male and red = female, then four out of the eight pairs were same sex pairings.
Thus, the breeding strategy is to random sample from female mice and from male mice and the stratification is sex of the mouse. Alternatively, breeders may select mice to form breeding pairs systematically: From a large colony with dozens of cages, the breeder may select one mouse from every third cage.
Stratified Random Sampling: Individuals in the population are classified into strata or sub-groups: age, economic class, ethnicity, gender, sex …, as many as needed. Then choose a simple random sample from each group, typically in proportion to the size of the sub-groups in the population. Combine those into the overall sample. For example, when I wanted a random sample of mice for my work, I called the supplier and requested that a total of 100 male and female mice be randomly selected from the five colonies they maintained. The reference population is the entire supply of mice at that company (at that time), but I wished to make sure that I got unrelated mice, so I needed to divide the population into groups (the five colonies) before my sample was constructed.
Note 1: The size of the population must be known in advance, just like in simplified random sampling. A more interesting example, the Social Security Administration conducts surveys of popular baby names by year. They post the top ten most popular names based on 1% or 5% (first strata), then by male/female (second strata).
For a simple example of the need for stratified sampling, consider our 16 blue and red mice again. If mice were randomly assigned to treatment group, then by chance unequal samples within strata may be assigned to a treatment group, potentially biasing our conclusions (Fig 2).
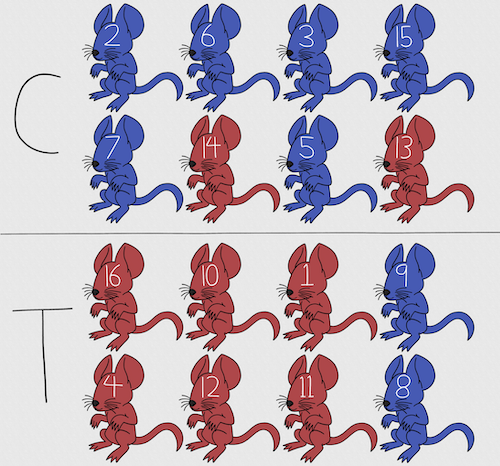
Figure 2. Sixteen mice, randomly assigned to treatment groups C and T; by chance, 75% blue in C and just 25% in T. If color was a confounding factor then our conclusions about the effectiveness of the treatment would be associated with color. Image © 2024 Mia D Graphics
Block sampling: superficially resembles stratified sampling, but refers to how experimental units are assigned to treatment groups. Blocks in experimental design refers to potentially confounding factors for which we wish to control, but are otherwise not interested in. For our example described in Figure 2, mouse color may not be of specific interest for our study and therefore would be considered a blocking effect.
Agricultural research provides a host of other blocking situations: plots distributed across an elevation or hydration gradient (Fig 3), soil types, and many others.

Figure 3. Agricultural fields in Central Poland. NASA https://visibleearth.nasa.gov/images/146593/agriculture-fields-in-central-poland/146595w
For a microbiology example, edge effects of heated culture plates. For a growth experiment it’s unlikely we are specifically interested in the plate layout on the growth characteristics of treated cells. However, it’s also unlikely we can assume placement has no influence on growth (eg, Mansoury et al 2021). A 96-well microplate has 60 inner wells and 36 edge wells (A1 – H1, A12-H12, plus 1st and 12th wells of columns B – H, for a total of 36 wells, Fig 4). Thus, analysis of growth effects should include a block effect for well position.
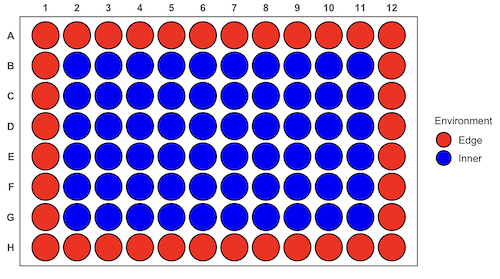
Figure 4. Format of 96-well plate. Red cells = “edge” wells; blue cells = “inner” wells. Plotted with ggplate package.
For long incubation periods it’s not unexpected that edge wells and inner wells may evaporate at different rates, potentially confounding interpretation of treatment effects if, by chance, treatment samples are more commonly assigned to edge wells. Block sampling implies subjects from treatment groups are randomly assigned to each block, in equal numbers if possible.
Cluster Sampling: In many situations, the population is far too large or too dispersed and scattered for a list of the entire population to be known. And, a random approach ignores that there is a natural grouping — people live next to each other, so there is going to be things in common. A multi-stage approach to sampling will be better than simply taking a random sample approach. Most surveys of opinion (when conducted reputably) use a multi-stage method. For example, if a senator wishes to poll his constituents about an issue, he may his pollster will randomly select a few of the counties from his state (first stage), then randomly select among towns or cities (second stage), to obtain a list of 1000 people to call. In some instances, they might use even more stages. At each stage, they might do a stratified random sample on sex, race, income level, or any other useful variable on which they could get information before sampling. If you are interested in this kind of work, for starters, see Couper and Miller (2009).
There are more types of sampling, and entire books written about the best way to conduct sampling. One important thing to keep in mind is that as long as the sample is large relative to the size of the population, each of the above methods generally will get the same answers (= the statistics generated from the samples will be representative of the population).
As long as some attempt is made to randomize, then you can say that the procedure is probability sampling. Nonprobability, or haphazard sampling, describes the other possibility, that is, each element is selected arbitrarily by a non-formal selecting of individual. … all the fish or birds that you catch may not be a random sample of those present in a population. For example,
- wild Pacific salmon do not feed on the surface, hatchery salmon feed on the surface. …
- all the individuals who respond to a survey.
- Phone surveys, web surveys, person on the street surveys… how random, how representative?
Sampling with computers
Now to determine the probability of your group being selected second, we need to distinguish between two kinds of sampling:
Sampling with replacement — after I select the first group, the first group is returned to the pool of groups that have not been selected. In other words, with replacement, your group could be selected first and selected second! The probability of being selected second then remains
Sampling without replacement — after I select the first group, then I have
![\[26 -1\]](https://biostatistics.letgen.org/wp-content/ql-cache/quicklatex.com-a314c642fc0677b3377f14c515483660_l3.png "Rendered by QuickLaTeX.com")
groups left to select the second group, so probability that your group will be second is
![\[p = \frac{1}{26-1}\]](https://biostatistics.letgen.org/wp-content/ql-cache/quicklatex.com-084877df14c9128a49a3f35d237c7b53_l3.png "Rendered by QuickLaTeX.com")
. The first group has already been selected and is not available, and so on.
Sampling is usually easiest if a computer is used. Computers use algorithms to generate pseudo-random numbers. We call the resulting numbers pseudo-random to distinguish them from truly random physical processes (eg, radioactive decay). For more information about random numbers, please see random.org.
If all you wish to do is select a few observations or you need to use a random procedure to select subjects prior to observations, then these websites can provide a very quick, useful tool.
Sampling in Microsoft Excel or LibreOffice Calc
Microsoft’s Excel is pretty good at sampling, but requires knowledge of included functions. Here are the steps to generate random numbers and select with and without replacement in Excel. I’ll give you two cases.
1. For random numbers, enter the function =rand() in a cell, then drag the cell handle to fill in cells to N (in our case = 26, so A1 to A26). This function generates a random (more or less!) number between 0 and 1. We want digits between 1 and 26, not fractions between 0 and 1, so combine INT function with RAND function
=INT(27*RAND())
Note 2: To get between 1 and 9, multiply by 10 instead of 27; to get between 1 and 100, multiply by 101, etc.
In Excel to sample with replacement, simply pick the first two cells (the algorithm Excel used already has conducted sample with replacement. See next item for method to sample without replacement in Excel. You have to have installed the Data Analysis Tool Pak. Here’s instructions for Office 2010.
If you have a Mac and Office 2008, there is no Data Analysis Tool Pak, so to get this function in your Excel, install a third-party add-in program (eg, StatPlus, a free add-in, really nice, adds a lot of function to your Excel). If you have the 2011 version of Office for Mac, then the Data Analysis Tool Pak is included, but like your Windows counterparts, you have to install it (click here for instructions).
2. Let’s say that we have already given each group a number between 1 and 26 and we enter those numbers in sequence in column A.
To sample without replacement, select Tools → Data Analysis… (if this option is not available, you’ll have to add it — see Excel help for instructions, Fig 5).
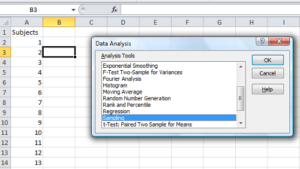
Figure 5. Screenshot of Sampling in Data Analysis menu, Microsoft Excel
Enter the cells with the numbers you wish to select from. In our example, column A has the numbers 1 through 26 representing each group in our class. I entered A:A as the Input Range.
Next, select “Random” and enter the number of samples. I want two.
Click OK and the output will be placed into cell B3 (my choice); I could have just as easily had Excel put the answer into a new worksheet.
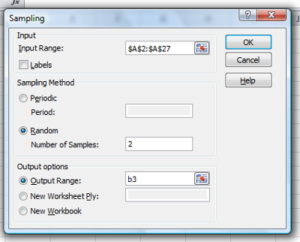
Figure 6. Screenshot of input required for Sampling in Data Analysis menu, Microsoft Excel
To sample with replacement from column A (with our 1 through 26), type in the formula B1
=INT(27*RAND())and the formula C1
=INDEX(A:A,RANK(B1,B:B))then drag the cell handles to fill in the columns (first column B, then column C).
That’ll do it for MS Excel or LibreOffice Calc.
Sampling with R (Rcmdr)
It’s much easier with much more control to get sampling in Rcmdr (R) than in Excel. Sampling in R is based on the function called sample() and sample.int(). I will present just the sample() command here.
sample(x, size, replace = FALSE, prob = NULL)Example
You want to sample ten integers between 1 and 10
sample(10)R output
sample(10)
[1]  5  1 10  8  7  3  4  9  2  6
You have a list of subjects, A1 through A10
subjects = c("A1","A2","A3","A4","A5","A6","A7","A8","A9","A10")
sample(subjects, 3, replace = FALSE, prob = NULL)
R output
sample(subjects, 3, replace = FALSE, prob = NULL)
[1] "A5" "A2" "A9"
Could use this to arrange random order for ten subjects
sample(subjects, 10, replace = FALSE, prob = NULL)
[1] "A9" "A3" "A8" "A2" "A1" "A4" "A10" "A7" "A5" "A6"
Try with replacement; To sample with replacement, type in TRUE after replace in the sample() function. The R output follows
sample(x, 10, replace = TRUE, prob = NULL)
[1]  5  5  3  5  3  7  3  5 10  6
R’s randomness is based on pseudonumbers and is, therefore, not truly random (actually, this is true of just about all computer-based algorithms unless they are based on some chaotic process). We can use this pseudo part to our advantage: if we want to reproduce our “random” process, we can seed the random number algorithm to a value (eg, 100), with the command in the Script Window
set.seed(100)For 10 random integers (eg, observations), type in the Script window
sample(10)R returns the following in the Output Window
sample(10)
[1] 4 5 7 3 10 9 2 1 6 8
Sampling was done without replacement. Here’s another selection round,
First without setting a seed value
sample(10)
[1] 10 4 7 3 8 1 2 9 6 5
Try again to see if get the same 10
sample(10)
[1]  1  4  8  2  9  6  5 10  3  7
Now to demonstrate how setting the seed allows you to draw repeated samples that are the same.
Note 3: If I need to precede the sample command with a set.seed() call, then sampling is repeatable.
set.seed(100)
sample(10)
[1] 4 3 5 1 9 6 10 2 8 7
and try again
set.seed(100)
sample(10)
[1] 4 3 5 1 9 6 10 2 8 7
Additional R packages that help with sampling schemes include: sampling() and spatialsample, which is part of the BiodiversityR package, which is available as a plugin for R Commander.
Quiz Chapter 5.6
Sampling from populations
Questions
- For our two descriptions of experiments in section 6.1 (the sample of patients; the sample of frogs), which sampling technique was used?
- What purpose is served by
set.seed()in a sampling trial? - Consider our question, Does taking a multivitamin daily improve health? Imagine you have a grant willing to support a long-term prospective study to follow up to one thousand people for ten years. List at least three concerns with proposed solutions about how sampling of subjects for the study.
- Imagine you wish to conduct a detailed survey to learn about student preferences. Your survey will include many questions, so you decide to ask just ten students. Student population is 70% female, 30% male.
- Assuming you select at random (simple random sampling), what is the chance that no male students will be included in your survey?
- You are able to increase the number of surveys to 20, 30, 40, or 50. What is the chance that no male students will be included in your survey for each of these increased sample numbers?
- What can you conclude about the effects of increasing survey sample size on representativeness of students for the survey?
- Discuss how you could apply a stratified sampling scheme to this survey and whether or not this approach improves representativeness.
- Why are random numbers generated by a computer called pseudo random numbers?