8.4 – Tails of a test
Introduction
The basics of statistical inference is to establish the null and alternative hypotheses. Starting with the simplest cases, where there is one sample of observations and the comparison is against a population (theory) mean, how many possible comparisons can be made? The next simplest is the two-sample case, where we have two sets of observations and the comparison is against the two groups. Again, how many total comparisons may be made?
Let  , “X bar”, equal the sample mean and
  , “mu”, represent the population mean. For sample means, designate groups by a subscript, 1 or 2. We then have Table 1.
Table 1. Possible hypothesis involving two groups
| Comparison | One-same | Two-sample |
| 1. |  |
 |
| 2. |  |
 |
| 3. |  |
 |
| 4. |  |
 |
| 5. |  |
 |
| 6. |  |
 |
Classical statistics classifies inference into null hypothesis, HO, vs. alternative hypotheses, HA, and specifies that we test null hypotheses based on the value of the estimated test statistic (see discussion about critical value and p-value, Chapter 8.2). From the list of six possible comparisons we can divide them into one-tailed and two-tailed differences (Table 1). By “tail” we are referring to the ends or tails of a distribution (Figure 1, Figure 2); where do our results fall on the distribution?
Two-tailed hypotheses: Comparison 1 and comparison 2 in the table above are two-tailed hypotheses. We don’t ask about the direction of any difference (less than or greater than).
Figure 1 shows the “two-tailed” distribution — if our results fall to the left ,  , or to the right
  we reject the null hypothesis (blue regions in the curve). We divide the type I error into two equal halves.
Note 1: It’s a nice trick to shade in regions of the curve. A package tigerstats includes the function pnormGC that simplifies this task.
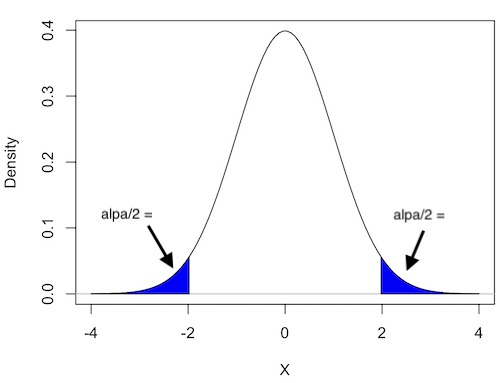
Figure 1. Two-tailed distribution.
RcmdrMisc::plotDistr(x = seq(-4, 4, length.out = 100),
  p = dnorm(seq(-4, 4, length.out = 100)),
  regions = list(c(-Inf, -1.96), c(1.96, Inf)),
  xlab="X", ylab="Density",
  col=c("blue"),
  legend=FALSE)
Figure 2 shows the “one-tailed” distribution — if our alternative hypothesis was that the sample mean was less than the population mean, then our fall to the left,  , for the “lower tail” of the distribution. If, however, our alternative hypothesis was that the sample mean was greater than the population mean, then our region of interest falls to the right,
  . Again, we reject the null hypothesis (blue regions in the curve). Note for one-tailed hypothesis, all Type I error occurs in the one area, not both, so
  (alpha) remains 0.05 over the entire rejection region (Fig 2).
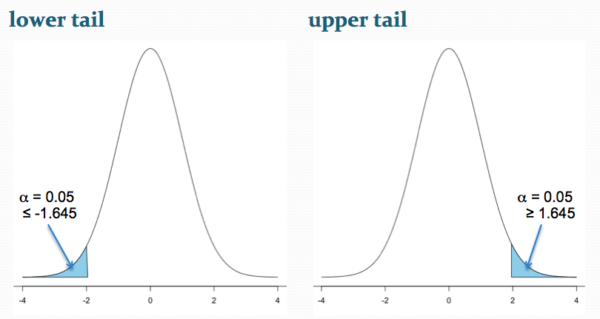
Figure 2. One-tailed distribution, lower tail (left) and upper tail (right).
library(tigerstats)
pnormGC(1.645, region="above", mean=0, sd=1,graph=TRUE)
pnormGC(-1.645, region="below", mean=0, sd=1,graph=TRUE)
One-tailed hypotheses: Comparison 3 through comparison 6 in the table are one-tailed hypotheses. The direction of the difference matters.
Note a simple trick to writing one-tailed hypotheses: first write the alternative hypothesis because the null hypothesis includes all of the other possible outcomes of the test.
Examples
Let’s consider some examples. We learn best by working through cases.
Chemotherapy as an approach to treat cancers owes its origins to the work of Dr Sidney Farber among others in the 1930s and ’40s (DeVita and Chu 2008; Mukherjee 2011). Following up on the observations of others that folic acid (vitamin B9) improved anemia, Dr Farber believed that folic acid might reverse the course of leukemia (Mukherjee 2011). In 1946 he recruited several children with acute lymphoblastic leukemia and injected them with folic acid. Instead of ameliorating their symptoms (e.g., white blood cell counts and percentage of abnormal immature white blood cells, called blast cells), treatments accelerated progression of the disease. That’s a scientific euphemism for the reality — the children died sooner in Dr. Faber’s trial than patients not enrolled in his study. He stopped the trials. Clearly, adding folic acid was not a treatment against this leukemia.
Question 1. Do you think these experiments are one sample or two sample? Hint: Is there mention of a control group?
Answer: There’s no mention of a control group, but instead, Dr. Faber would have had plenty of information about the progression of this disease in children. This was a one sample test.
Question 2. What would be a reasonable interpretation of Dr Faber’s alternative hypothesis with respect to percentage of blast cells in patients given folic acid treatment? Your options are
- Folic acid supplementation has an effect on blast counts.
- Folic acid supplementation reduces blast counts.
- Folic acid supplementation increases blast counts.
- Folic acid supplementation has no effect on blast counts.
Answer: At the start of the trials, it is pretty clear that the alternative hypothesis was intended to be a one-tailed test (option 2). Dr. Faber’s alternative hypothesis clearly was that he believed that addition of folic acid would reduce blast cell counts. However, that they stopped the trials shows that they recognized that the converse had occurred, that blast counts increased; this means that, from a statistician’s point of view, Dr Faber’s team was testing a two-sided hypothesis (option 1).
Another example.
Dr Farber reasoned that if folic acid accelerated leukemia progression, perhaps anti-folic compounds might inhibit leukemia progression. Dr Farber’s team recruited patients with acute lymphoblastic leukemia and injected them with a folic acid agonist called aminopterin. Again, he predicted that blast counts would reduce following administration of the chemical. This time, and for the first time in recorded medicine, blast counts of many patients drastically reduced to normal levels and the patients experienced remissions. The remissions were not long lasting and all patients eventually succumbed to leukemia. Nevertheless, these were landmark findings — for the first time a chemical treatment was shown to significantly reduce blast cell counts, even leading to remission, if however brief (Mukherjee 2011).
Try Question 3 and Question 4 yourself.
Question 3. Do you think these experiments are one sample or two sample? Hint: Is there mention of a control group?
Question 4. What would be a reasonable interpretation of Dr Faber’s alternative hypothesis with respect to percentage of blast cells in patients given aminopterin treatment? Your options are
- Aminopterin supplementation has an effect on blast counts.
- Aminopterin supplementation reduces blast counts.
- Aminopterin supplementation increases blast counts.
- Aminopterin supplementation has no effect on blast counts.
Pros and Cons to One-sided testing
Here’s something to consider: why not restrict yourself to one-tailed hypothesis?
Here’s the pro-argument for one-tailed tests. Strictly speaking you gain statistical power to test the null hypothesis. For example, look up the t-test distribution for degrees of freedom equal to 20 and compare  (one tail) vs.
  (two-tail). You will find that for the one-tailed test, the critical value of the t-distribution with 20 df is 1.725, whereas for the two-tailed test, the critical value of the t-distribution with the same numbers of df is 2.086. Thus, the difference between means can be much smaller in the one-tailed test and prove to be “statistically significant.” Put simply, with the same data, we will reject the Null Hypothesis more often with one-tailed tests.
Or better yet, if during exploratory data analysis you see a clear difference between the groups and it is in the direction your scientific intuition suggests it should be, shouldn’t you switch to a one-tailed hypothesis? That’s a hard no. You would be “guilty” of p-hacking — the inappropriate manipulation of data analysis to get a more favored, statistically significant result.
The con-argument. If you use a one-tailed test you MUST CLEARLY justify its use and be aware that a deviation in the opposite direction MUST be ignored! More specifically, you interpret a one-tailed result in the opposite direction as acceptance of the null — you cannot, after the fact, change your mind and start speaking about “statistically significant differences” if you had specified a one-tailed hypothesis and the results showed differences in the opposite direction.
Note 2: Recall also that, by itself, statistical significance judged by the p-value against a specified cut-off critical value is not enough to say there is evidence for or against the hypothesis. For that we need to consider effect size, see Power analysis in Chapter 11.
Questions
- For a Type I error rate of 5% and the following degrees of freedom, compare the critical values for one tail test and a two tailed test of the null hypothesis.
- 5 df
- 10 df
- 15 df
- 20 df
- 25 df
- 30 df
- Using your findings from Additional Question 1, make a scatterplot with degrees of freedom on the horizontal axis and critical values on the vertical axis. What trend do you see for the difference between one and two tailed tests as degrees of freedom increase?
- A clinical nutrition researcher wishes to test the hypothesis that a vegan diet lowers total serum cholesterol levels compared to an omnivorous diet. What kind of hypothesis should he use, one-tailed or two-tailed? Justify your choice.
- Spironolactone, introduced in 1953, is used to block aldosterone in hypertensive patients. A newer drug eplerenone, approved by the FDA in 2002, is reported to have the same benefits as spironolactone (reduced mortality, fewer hospitalization events), but with fewer side effects compared with spironolactone. Does this sentence suggest a one-tailed test or a two-tailed test?
- Write out the appropriate null and alternative hypothesis statements for the spironolactone and eplerenone scenario.
- You open up a bag of Original Skittles and count the number of green, orange, purple, red, and yellow candies in the bag. What kind of hypothesis should be used, one-tailed or two-tailed? Justify your choice.
- Verify the probability values from the table of standard normal distribution for Z equal to -1.96, -1.645, 1.645, and 1.96.
Quiz Chapter 8.4
Tails of a test