20.8 – Diversity indexes
Introduction
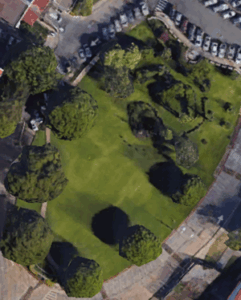
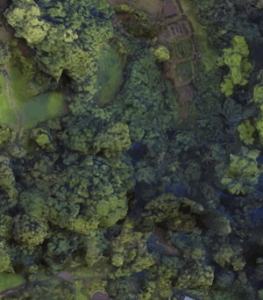
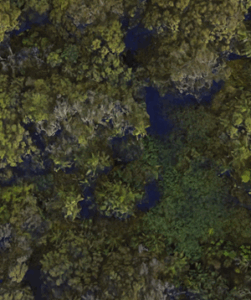
“Biodiversity,” coined in the mid 1980s (see discussion in Sarkar 2021), is an important and a well used term — over 100 million hits in Google search as of Fall 2025. From ecology we learn that all things being equal, high numbers of species living in the same area rather than low or few kinds living in the area is associated with high productivity and is likely a better predictor of ecosystem persistence over time. And in many ways, we generally know the difference between high and low diversity when we see it (college campus vs arboretum vs forest reserve on Oahu, Fig 1).
A |
B |
C |
Figure 1. (A) Chaminade University, a portion of lower campus; (B) A portion of Lyon Arboretum; (C) Portion of Roundtop Forest Reserve. Google satellite images, approximately the same altitude and sized areas.
We all agree biodiversity captures the variety of life on Earth, but quantifying — and asking questions about biodiversity differences among ecosystems — requires quantification. Over the years a variety of metrics have been proposed and considerable knowledge about their form and applicability is required — I point interested readers to the many excellent resources on this topic, including Jost 2006, Tuomisto 2010, and Sîrbu et al 2025, to name just a few. A thorough and free resource about R and diversity indexes can be found at Diversity Analysis, part of Dr David Zelený’s (National Taiwan University, Taipei, Taiwan), excellent site on Analysis of Community Ecology Data in R.
We introduced index concepts in Chapter 6.2 – Ratios and probabilities. At the time, we did not emphasize an important distinction between parameters and indexes. As we introduced before, parameters are considered fixed, but unknown quantities about a population. Diversity indexes are not properties of a community (statistical population), they are estimates from samples. Therefore, there can be no theoretical distribution to which a diversity index can be compared, hence, not a parameter. This has consequences, which we briefly introduce below.
A diversity index is a measure of how many different kinds (eg, species) are present in a dataset. These indexes are more than a count of the different types; they also account for how common (or rare) a kinds is. Diversity indexes are examples of applied multivariate statistics: two or more predictor variables and two or more response variables.
Richness, R, quantifies how many types or species. Thus, at any specific site one can report number of species found
The general equation of diversity is
There are many varieties of diversity indexes (Bollarapu et al 2024), but three are well known and two are commonly used.
Shannon’s diversity index
H, Shannon’s Index, Shannon Entropy, accounts for abundance and evenness of all species present in an area. Evenness refers to how close the numbers of each species are in an area.
(1) 
No upper limit, but useful for comparing diversity among sites.
Google Scholar, 83,800 hits (October 2025).
Simpson diversity index
Simpson index (ecology) is the number of species or species richness (S) and evenness — proportional abundance — of populations; independently developed, called Herfindahl–Hirschman index (HHI) in economics.
(2) 
Simpson usually expressed as  , ranges from 0 to 1.
Google Scholar, 74,900 hits (October 2025).
Other indices of note
Pielou’s evenness index
(3) 
where  is the total number of species and
  is the Shannon’s diversity index.
Google Scholar, 23,600 hits (October 2025).
Fisher’s diversity index, or alpha (α). The formula is
(4) 
where is the total number of species,  is the total number of individuals, and
  is the Fisher’s alpha index.
Google Scholar, 178,000 hits (October 2025).
To find you need to solve the equation for using the known values of and . This requires an iterative approach, such as the Newton-Raphson method, and you start iterations with a reasonable guess for starting value.
Note 1: Some equations lack algebraic solutions. We solve these by iteration methods. Iteration finds an approximate solution through a repeated, step-by-step process; the output of one step becomes the input for the next. This process continues until the solution reaches a required level of accuracy. The Newton-Raphson method is one iterative approach. It finds the x-intercept of the tangent line to the function at the current guess to find a better approximation.
Rao’s diversity, or more formally, Rao’s Quadratic Entropy index (Ricotta & Szeidl 2006). In addition to the proportions (relative abundance) of each species, the index adds a measure of distance between species.
(5) 
where  is the distance between species i and species j,
  is relative abundance of species i, with
  the relative abundance of species j.
The measure of pairwise distances among the species in the community, which can provide insight into functional diversity.
Google Scholar, 17,400 hits (October 2025).
Comparing index properties
Considering each index, we ask: emphasize richness? Relative abundance or evenness? Both Shannon and Simpson address richness.
R packages and other software
Download vegan package. The function diversity() returns Shannon, Simpson, and Fisher diversity indices and species richness.
Download and install the BiodiversityR package, a GUI for biodiversity, suitability and community ecology analysis. Package provides GUI to many vegan functions, utilizes R Commander. Requires
Example
We need a community matrix, which is a table of data that shows the number of individuals of each species in a community or at a site.
Table 1. A made up example matrix.
| Spp1 | Spp2 | Spp3 | Spp4 | Spp5 | |
| Site1 | 10 | 5 | 2 | 0 | 8 |
| Site2 | 3 | 12 | 7 | 1 | 0 |
| Site3 | 0 | 4 | 15 | 6 | 2 |
R code
library(vegan) community_data <- data.frame(Site1 = c(10, 5, 2, 0, 8),Site2 = c(3, 12, 7, 1, 0),Site3 = c(0, 4, 15, 6, 2)) # matrix transpose community_matrix <- t(community_data) H <- diversity(community_matrix, index="simpson")
Note 2: Matrix transpose means swapping a matrix’s rows with its columns, creating a new matrix of a different dimension.
R output
# returns 1 - D
    Site1     Site2     Site3
0.6912000 0.6162571 0.6145405
# species richness
S <- specnumber(community_matrix)
R output
Site1 Site2 Site3
    4     4     4
Calculate Pielou’s evenness index
J <- H/log(S)
R output
    Site1     Site2     Site3
0.4985954 0.4445355 0.4432972
Compare two indexes.
Not uncommon, diversity indexes may be derived for a number of different locations and thus, logical to wish to compare diversity between sites. For example, diversity in disturbed compared to undisturbed habitats (eg, Hu et al 2022). While desirable, I will simply warn that such comparisons are not at all straight-forward and point interested readers to many resources to explore the statistical issues at hand (eg, Hulbert 1971, Jost 2006). To illustrate, While it may be tempting to apply an independent sample t-test, you can’t. Shannon’s index is a single summary value, not a distribution; you only have one H value per site, not multiple samples (replicates) to calculate sample variance. Hutcheson’s t-test (Hutcheson 1970) can be used instead.
(6) 
and the variance of Shanon’s Index is given by
(7) 
Hutcheson’s t-test calculates the variance of the Shannon index itself, allowing you to compare two H values statistically. After calculating Shannon’s index (eg, vegan::diversity()), use R package ecolTest, function Hutcheson_t_test().
And, degrees of freedom? Yes, not simply the  as is the case for the two-sample independent t-test. Degrees of freedom,
  , follow from the equation for the variance.
(8) 
With in hand, the critical value is found in the standard t-distribution table (Chapter 6.10 , Appendix).
Alternatively, in collecting data for diversity indexes, a better approach is to divide the area into quadrants and calculate diversity separately for each quadrant, hence, replication. See also Hill numbers, used to calculate effective number of species from traditional diversity indexes (Joost 2006). The effective number of species is the number of equally abundant species necessary to produce the observed value of diversity.
Questions
- Write up three learning outcomes for this page. Hint: Point your favorite generative AI to this page and ask for help.
- Be able to define and distinguish between alpha diversity and beta diversity.
Quiz Chapter 20.8
Diversity indexes
References and suggested readings
Bollarapu, M. J., Kuchibhotla, S., Kvsn, R., & Patel, H. (2024). Dynamic perspectives on biodiversity quantification: Beyond conventional metrics. PeerJ, 12, e17924.
Hu, J., Amor, D. R., Barbier, M., Bunin, G., & Gore, J. (2022). Emergent phases of ecological diversity and dynamics mapped in microcosms. Science, 378(6615), 85–89.
Hutcheson, K. (1970). A test for comparing diversities based on Shannon formula. Journal of theoretical Biology, 29, 151-154.
Jost, L. (2006). Entropy and diversity. Oikos, 113(2), 363–375.
Morris, E. K., Caruso, T., Buscot, F., Fischer, M., Hancock, C., Maier, T. S., Meiners, T., Müller, C., Obermaier, E., Prati, D., Socher, S. A., Sonnemann, I., Wäschke, N., Wubet, T., Wurst, S., & Rillig, M. C. (2014). Choosing and using diversity indices: Insights for ecological applications from the German Biodiversity Exploratories. Ecology and Evolution, 4(18), 3514–3524.
Ricotta, C., & Szeidl, L. (2006). Towards a unifying approach to diversity measures: Bridging the gap between the Shannon entropy and Rao’s quadratic index. Theoretical Population Biology, 70(3), 237–243.
Roswell, M., Dushoff, J., & Winfree, R. (2021). A conceptual guide to measuring species diversity. Oikos, 130(3), 321–338.
Sarkar, S. (2021). Origin of the Term Biodiversity. BioScience, 71(9), 893.
Sîrbu, I., Benedek, A.-M., & Sîrbu, M. (2025). Rethinking composite quantification by capturing biological and ecological diversity across multiple dimensions. Scientific Reports, 15(1), 27822.
Tuomisto, H. (2010). A consistent terminology for quantifying species diversity? Yes, it does exist. Oecologia, 164(4), 853–860.
Chapter 20 contents
- Additional topics
- Area under the curve
- Peak detection
- Baseline correction
- Surveys
- Time series
- Dimensional analysis
- Estimating population size
- Diversity indexes
- Survival analysis
- Growth equations and dose response calculations
- Plot a Newick tree
- Phylogenetically independent contrasts
- How to get the distances from a distance tree
- Binary classification
- Meta-analysis
/MD