8.6 – Confidence limits for the estimate of population mean
Introduction
In Chapter 3.4 and Chapter 8.3, we introduced the concept of providing a confidence interval for estimates. We gave a calculation for an approximate confidence interval for proportions and for the Number Needed to Treat (Chapter 7.3). Even an approximate confidence interval gives the reader a range of possible values of a population parameter from a sample of observations.
In this chapter we review and expand how to calculate the confidence interval for a sample mean,  . Because is derived from a sample of observations, we use the t-distribution to calculate the confidence interval. Note that if the population was known (population standard deviation), then you would use normal distribution. This was the basis for our recommendation to adjust your very approximate estimate of a confidence interval for an estimate by replacing the “2” with “1.96” when you multiply the standard error of the estimate (SE) in the equation estimate
 . As you can imagine, the approximation works for large sample size, but is less useful as sample size decreases.
Consider ; it is a point estimate of  , the population mean (a parameter). But our estimate of is but one of an infinite number of possible estimates. The confidence interval, however, gives us a way to communicate how reliable our estimate is for the population parameter. A 95% confidence interval, for example, tells the reader that we are willing to say (95% confident) the true value of the parameter is between these two numbers (a lower limit and an upper limit). The point estimate (the sample mean) will of course be included between the two limits.
Instead of 95% confidence, we could calculate intervals for 99%. Since 99% is greater than 95%, we would communicate our certainty of our estimate.
Note 1: Again, the caveats about p-value extend to confidence intervals. See Chapter 8.2.
Question 1: For 99% confidence interval, the lower limit would be smaller than the lower limit for a 95% confidence interval.
- True

- False
When we set the Type I error rate,  (alpha) = 0.05 (5%), that means that 5% of all possible sample means from a population with mean, , will result in t values that are larger than
 OR smaller than
 .
Why the t-distribution?
We use the t-test because, technically, we have a limited sample size and the t-distribution is more accurate than the normal distribution for small samples. Note that as sample size increases, the t-distribution is not distinguishable from the normal distribution and we could use  (Fig 1).
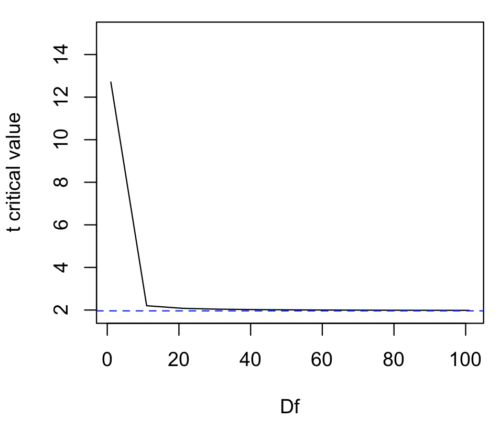
Figure 1. Critical values at Type I rate of 5% of t-distribution  . Blue dashed line is z = 1.96.
Here’s the equation for calculating the confidence interval based on the t-distribution. These set the limits around our estimate of the sample mean. Together, they’re called the 95% confidence interval,  .

Here’s a simplified version of the same thing, but generalized to any Type I level…
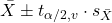
This statistic allows us to say that we are 95% confident that the interval includes the true value for . For this confidence interval you need to identify the critical t value at 5%. Thus, you need to know the degrees of freedom for this problem, which is simply  , the sample size minus one.
It is straightforward to calculate these by hand, but…
Set the Type I error rate, calculate the degrees of freedom (df):
 samples for one sample test
- pairs of samples for paired test
 samples for two independent sample test
and lookup the critical value from the t table (or from the t distribution in R). Of course, it is easier to use R.
In R, for the one tail critical value with seven degrees of freedom, type at the R prompt
qt(c(0.05), df=7, lower.tail=FALSE)
[1] 1.894579
For the two-tail critical value
qt(c(0.025), df=7, lower.tail=FALSE)
[1] 2.364624
Or, if you prefer to use R Commander, then follow the menu prompts to bring up the t quantiles function (Fig 2 and Fig 3).
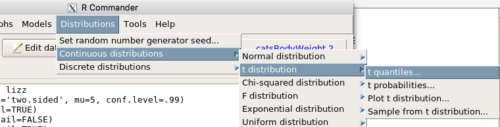
Figure 2. Drop down menu to get t-distribution.
Note 2: Quantiles divide probability distribution into equal parts or intervals. Quartiles have four groups, deciles have ten groups, and percentiles have 100 groups.

Figure 3. Menu for t quantiles, with values entered for the two-tail example.
You should confirm that what R calculates agrees with the critical values tabulated in the Table of Critical values for the t distribution provided in the Appendix.
A worked example
Let’s revisit our lizard example from last time (see Chapter 8.5). Prior to conducting any inference test, we decide acceptable Type I error rates (cf justify alpha discussion in Ch8.1); For this example, we set Type I error rate to be 1% for a 99% confidence interval.
The Rcmdr output was
t.test(lizz$bm, alternative='two.sided', mu=5, conf.level=.99)
data: lizz$bm
t = -1.5079, df = 7, p-value = 0.1753
alternative hypothesis: true mean is not equal to 5
99 percent confidence interval:
1.984737 6.199263
sample estimates:
mean of x
4.092
Sort through the output and identify what you need to know.
Question 1: What was the sample mean?
- 5
- -1.5079
- 7
- 0.1753
- 1.984737
- 6.199263
- 4.092
Question 2: What was the most likely population mean?
- 5
- Answer
- -1.5079
- 7
- 0.1753
- 1.984737
- 6.199263
- 4.092
Question 3: This was a “one-tailed” test of the null hypothesis?
- True
- False
The output states “alternative hypothesis: true mean is not equal to 5” — so it was a two-tailed test.
Question 4: What was the lower limit of the confidence interval?
- 5
- -1.5079
- 7
- 0.1753
- 1.984737
- 6.199263
- 4.092
The 99% confidence interval,  , is
 , which means we are 99% certain that the population mean is between
 (lower limit) and
 (upper limit). In Chapter 8.5 we calculated the , is
 .
Confidence intervals by nonparametric bootstrap sampling.
Bootstrapping is a general approach to estimation or statistical inference that utilizes random sampling with replacement (Kulesa et al. 2015). In classic frequentist approach, a sample is drawn at random from the population and assumptions about the population distribution are made in order to conduct statistical inference. By resampling with replacement from the sample many times, the bootstrap samples can be viewed as if we drew from the population many times without invoking a theoretical distribution. A clear advantage of the bootstrap is that it allows estimation of confidence intervals without assuming a particular theoretical distribution and thus avoids the burden of repeating the experiment. Which method to prefer? For cases where assumption of a particular distribution is unwarranted (eg, what is the appropriate distribution when we compare medians among samples?), bootstrap may be preferred (and for small data sets, percentile bootstrap may be better). We cover bootstrap sampling of confidence intervals in Chapter 19.2 Bootstrap sampling.
Conclusions
The take home message is simple.
- All estimates should — must? — be accompanied by a Confidence Interval
- The more confident we wish to be, the wider the confidence interval will be
Note that the confidence interval concept combines DESCRIPTION (the population mean is between these limits) and INFERENCE (and we are 95% certain about the values of these limits). It is good statistical practice to include estimates of confidence intervals for any estimate you share with readers. Any statistic that can be estimated should be accompanied by a confidence interval and, as you can imagine, formulas are available to do just this. For example, earlier this semester we calculated NNT.
Questions
- To gain practice with calculations of confidence intervals, calculate the approximate confidence interval, the 95% and the 99% confidence intervals based on the t distribution, for each of the following.
-
- = 13,
 = 1.3,
 = 10
- = 13, = 1.3, = 30
- = 13, = 2.6, = 10
- = 13, = 2.6, = 30
Quiz Chapter 8.6
Confidence limits for the estimate of population mean
Chapter 8 contents
- Introduction
- The null and alternative hypotheses
- The controversy over proper hypothesis testing
- Sampling distribution and hypothesis testing
- Tails of a test
- One sample t-test
- Confidence limits for the estimate of population mean
- References and suggested readings
8.3 – Sampling distribution and hypothesis testing
Introduction
Understanding the relationship between sampling distributions, probability distributions, and hypothesis testing is the crucial concept in the NHST — Null Hypothesis Significance Testing — approach to inferential statistics. is crucial, and many introductory text books are excellent here. I will add some here to their discussion, perhaps with a different approach, but the important points to take from the lecture and text are as follows.
Our motivation in conducting research often culminates in the ability (or inability) to make claims like:
- “Total cholesterol greater than 185 mg/dl increases risk of coronary artery disease.”
- “Average height of US men aged 20 is 70 inches (1.78 m).”
- “Species of amphibians are disappearing at unprecedented rates.”
Lurking beneath these statements of “fact” for populations (just what IS the population for #1, for #2, and for #3?) is the understanding that not ALL members of the population were recorded.
How do we go from our sample to the population we are interested in? Put another way — How good is our sample? We’ve talked about how “biostatistics” can be generalized as sets of procedures you use to make inferences about what’s happening in populations. These procedures include:
- Have an interesting question
- Experimental design (Observational study? Experimental study?)
- Sampling from populations (Random? Haphazard?)
- Hypotheses: HO and HA
- Estimate parameters (characterize the population)
- Tests of hypotheses (inferences)
We have control of each of these — we choose what to study, we design experiments to test our hypotheses…We have already introduced these topics (Chapters 6 – 8).
We also obtain estimates of parameters, and inferential statistics applies to how we report our descriptive statistics (Chapter 3). Estimates of parameters like the sample mean and sample standard deviation can be assessed for accuracy and precision (eg, confidence intervals).
Sampling distribution
Imagine drawing a sample of 30 from a population, calculating the sample mean for a variable (eg, systolic blood pressure), then calculating a second sample mean after drawing a new sample of 30 from the same population. Repeat, accumulating one estimate of the mean, over and over again. What will be the shape of this distribution of sample means? The Central Limit Theorem states that the shape will be a normal distribution, regardless of whether or not the population distribution was normal, as long as the sample size is large (ie, Law of Large Numbers). We alluded to this concept when we introduced discrete and continuous distributions (Chapter 6).
It’s this result from theoretical statistics that allows us to calculate the probability of an event from a sample without actually carrying out repeated sampling or measuring the entire population.
A worked example
To demonstrate the CLT we want R to help us generate many samples from a particular distribution and calculate the same statistic on each sample. We could make a for loop, but the replicate() function provides a simpler framework. We’ll sample from the chi-square distribution. You should extend this example to other distributions on your own, see Question 5 below.
Note 1: This example is much simpler to enter and run code in the script window, modifying code directly as needed. If you wish to try to run this through Rcmdr, you’ll need to take a number of steps, and likely need to modify the code and rerun anyway. Some of the steps in would be Rcmdr: Distributions → Continuous distributions → Chi-squared distribution → Sample from chi-square distribution…, then running Numerical summaries and saving the output to an object (eg, out), extracting the values from the object (eg, out$Table, confirm by running command str(out)— str() is an R utility to display the structure of an object), then testing the object for normality Rcmdr: Statistics → Test of normality, select Shapiro-Wilk, etc.. In other words, sometimes a GUI is a good idea, but in many cases, work with the script!
Generate x replicate samples (eg, x = 10, 100, 1000, one million) of 30 each from chi-square distribution with one degree of freedom, test the distribution against null hypothesis (assume normal distributed, eg, Shapiro-Wilk test, see Chapter 13.3), then make a histogram (Chapter 4.2), like Figure 1 or Figure 2.
x.10 <- replicate(10, {
my.mean <- rchisq(30, 1)
mean(my.mean)
})

normalityTest(~x.10, test="shapiro.test")
hist(x.10, col="orange")
Result from R
Shapiro-Wilk normality test

data: x.10
W = 0.87016, p-value = 0.1004
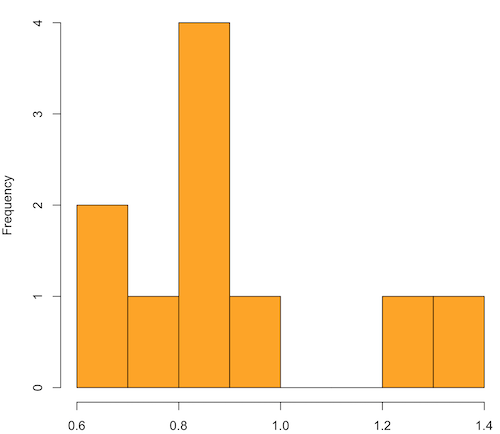
Figure 1. means of ten replicate samples drawn at random from chi-square distribution, df = 1.
Modify the code to draw 100 samples, we get Fig 2.
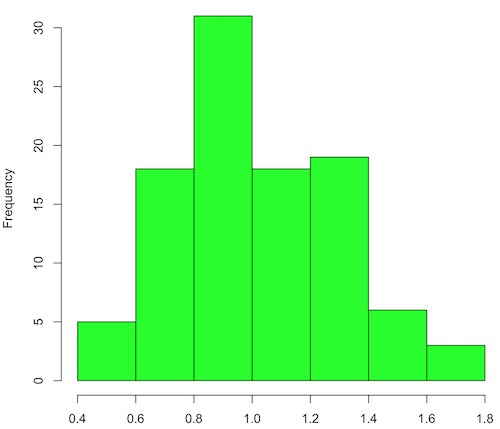
Figure 2. means of 100 replicate samples drawn at random from chi-square distribution, df = 1. Results from Shapiro-Wilks test: W = 0.97426, p-value = 0.04721.
And finally, modify the code to draw one million samples, we get Figure 3.
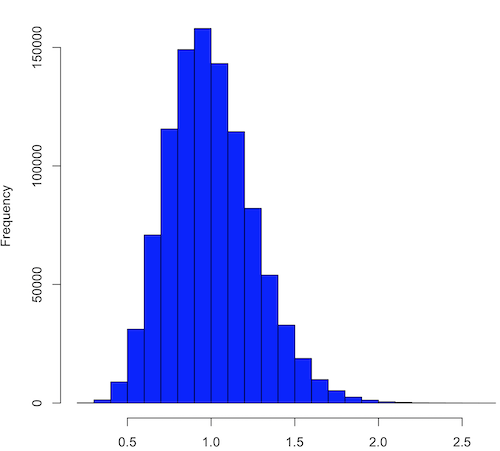
Figure 3. means of one million replicate samples drawn at random from chi-square distribution, df = 1. Normality test will fail to run, sample size of 5000 limit.
How to apply sampling distribution to hypothesis testing
First, a reminder of some definitions.
Estimate = we will always (almost) concern ourselves with how good our sample mean (such values are called estimates) is relative to the population mean, the thing we really want, but can only hope to get an estimate of.
Accuracy = how close to the true value is our measure?
Precision = how repeatable is our measure?
How can we tell if we have a good estimate? We want an estimate with an evaluation for accuracy and for precision. The sampling error provides an assessment of precision, whereas the confidence interval provides a statement of accuracy. We need an estimate of the sampling error for the statistic,
Sample standard error of the mean
We introduced sample error of the mean in section 3.4 of Chapter 3. Everything we measure can have a corresponding statement about how accurate (sampling error) is our estimate! First, we begin by asking, “how accurate is the mean that we estimate from a sample of a population?” How do we answer this? We could prove it in the mathematical sense of proof (and people have and do) OR we can use the computer to help. We’ll try this approach in a minute.
What we will show relates to the standard error of the population mean (SEM) or

, whose equation is shown below.

or equivalently, from the standard deviation we have
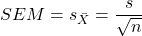
Note that the SEM takes the variance and divides through by the sample size. In general, then, the larger the sample size, the smaller the “error” around the mean. As we work through the different statistical tests, t-tests, analysis of variance, and related, you will notice that the test statistic is calculated as a ratio between a difference or comparison divided by some form of an error measurement. This is to remind you that “everything is variable.”
A note on standard deviation (SD) and standard error of the mean (SEM): SD estimates the variability of a sample of Xi‘s whereas SEM estimates the variability of a sample of means.
Let’s return to our thought problem and see how to demonstrate a solution. First, what is the population? Second, can we get the true population mean?
One way, a direct (but impossible?) approach would be to measure it — get all of the individuals in a population and measure them, then calculate the population mean. Then, we could compare our original sample mean against the true mean and see how close it was. This can be accomplished in some limited cases. For example, the USA conducts a census of her population every ten years, a procedure which costs billions of dollars. We can then compare samples from the different states or counties to the USA mean. And these statistics are indeed available via the census.gov website. But even the census uses sampling — individuals are randomly selected to answer more questions and from this sample trends in the population are inferred.
So, sampling from populations is the way to go for most questions we will encounter. The procedures we will use to show how a sample mean relates to the population mean are general and may be used to show how any estimate of a variable (sample mean and sample standard deviation, etc.), relates to properties of a parameter. We’ll get to the other issues, but for now, think about sample size.
Sampling from populations is necessary and inevitable, and, to a certain extent, under your control. But how many individuals do we need? The quick answer is for me to direct your attention to the equation for the SEM. Can you see in that ratio the secret to obtaining more precise estimates? There are many ways to approach this question, but let’s use the tools from last time, those based on properties of a normal distribution.
If we can view the sampling as having come from a population at least approximately normally distributed for our variable, then we can now examine empirically the effect of different sample sizes on the estimate of the mean.
A hint: variability is important!
From one population we obtain two samples, A and B. Sample sizes are
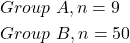
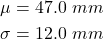
Assume for now that we know the true mean (μ) and standard deviation (σ) for the population. Note. This is one of the points of why we use computer simulation so much to teach statistics — it allows us to specify what the truth is, then see how our statistical tools work or how our assumptions affect our statistically based conclusions.
Confidence intervals
Reliability is another word for precision. We define a confidence interval as a statistic to report the reliability of our estimated statistic. We introduced confidence interval in Chapter 3.4. At least in principle, confidence intervals can be calculated for all statistics (mean, variance, etc.,) and for all data types. Confidence intervals define a lower limit, L, and an upper limit, U, and that you are making a statement that you are “95% certain that the true value (parameter value) is between these two limits.
We previously reported how to calculate an approximate confidence intervals for proportions and for NNT; simply multiple standard error estimate by 2. Here we introduce an improved approximate calculation of the 95% confidence interval for the sample mean

where Z is something you would look up from the table of the normal distribution. For a 95% confidence interval, 100% – 95% = 5% and divide 5% by two: the lower limit corresponds to 2.5% and the upper limit corresponds to 2.5% on our normal distribution. We look up the table and we find that Z for 0.025 is 1.96 and that is the value we would plug into our equation above. For large sample sizes, you can get a pretty decent estimate of the confidence interval by replacing 1.96 with “2.”
Questions
1. What is the probability of having a sample mean greater than 50 (mean > 50) for a sample of n = 9 ?
We’ll use a slight modification of the Z-score equation we introduced in Chapter 6.6 — the modification here is that previously we referred to the distribution of Xi‘s and how likely a particular observation would be. Instead, we can use the Z score with the standard normal distribution (aka Z-distribution), approach to solving how likely an estimated sample mean is given the population parameters μ and σ. Recall the Z score

We have everything we need except the SEM, which we can calculate by dividing the standard deviation by squared root of sample size.
For

, σ = 12.0 (given above), and μ = 47, n = 9, plug in the values:
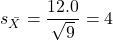
Therefore, after applying the equation for Z score,  . This corresponds to how far away from the standard mean of zero.
Look up from the table of normal distribution. The answer is  , which corresponds to that
 is EQUAL to or GREATER than 0.75, which is what we wanted. Translated, this implies that, given the level of variability in the sample, 22.66% of your sample means would be greater than 50! We write:
 .
Some care needs to be taken when reading these tables — make sure you understand how the direction (less than, greater than) away from the mean is tabulated.
2. Instead of greater, how would you get the probability less than 50?
Total area under the curve is 1 (100%), so subtract  .
I recommend that you do these by hand first, then check your answers. You’ll need to be able to do this for exams.
Here’s how to use Rcmdr to do these kind of problems.
Rcmdr: Distributions → Continuous distributions → Normal distribution → Normal probabilities …
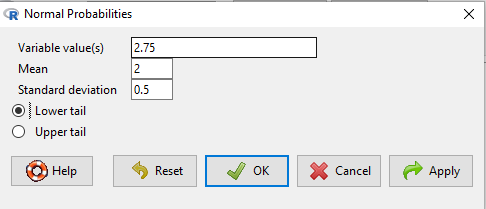
Figure 5. Screenshot Rcmdr menu to get normal probability.
Here’s the answer from Rcmdr
pnorm(c(50), mean=47, sd=12, lower.tail=TRUE)

[1] 0.5987063
3. Now, try a larger sample size. For  , what is the probability of having a sample mean greater than 50 (
 )?
, μ = 47, σ = 12, n = 50 and

Therefore, after applying the equation for Z score,  . Look up (Normal table, subtract answer from 1) and we get
 .
Or 3.84% of your sample means would be greater than 50! We write:  .
Said another way: If you have a sample size of 50 () and you obtain a mean greater than 50 then there is only a 3.84% chance that the TRUE MEAN IS 47.
4. What happens if the variability is smaller? Chance σ from 12 to 6 then repeat questions 1 and 4.
5. Repeat the demonstration of Central Limit Theorem and Law of Large Numbers for discrete distributions
- binomial distribution. Replace
rchisq()withrbinom(n, size, prob)in thereplicate()function example. See Chapter 6.5 - poisson distribution. Replace
rchisq()withrpois(n, lambda)in thereplicate()function example. See Chapter 6.5
Quiz Chapter 8.3
Sampling distribution and hypothesis testing
Chapter 8 contents
- Introduction
- The null and alternative hypotheses
- The controversy over proper hypothesis testing
- Sampling distribution and hypothesis testing
- Tails of a test
- One sample t-test
- Confidence limits for the estimate of population mean
- References and suggested readings