14.5 – Nested designs
Introduction
Crossed versus nested design
Factors are independent variables whose values we control and wish to study because we believe they have an effect on the dependent variable. While it is logical to think of factors and levels within factors as independent variables fully under our control, a moments reflection will come up with examples in which the groups (levels) depend on the factor.
Crossed – each level of a factor is in each level of the other factor. This was illustrated in Chapter 14.1 on Crossed, balanced, fully replicated two-way ANOVA.
Nested – levels of one factor are NOT the same in each of the levels of the other factor. Nested designs are an important experimental design in science, and they have some advantages over the 2-way ANOVA design (for one), but they also have limitations.
Classic examples of nesting: culturing and passage of cell lines in routine cell colony maintenance means that even repeated experiments are done on different experimental units. Cells derived from one vial are different from cells derived from a different vial. Similarly, although mice from an inbred strain are thought to be genetically identical, environments vary across time, so mice from the same strain but born or purchased at different times are necessarily different. These scenarios involving time create a natural block effect. Thus, cells are nested by block effect passage number and mice are nested by block effect colony time. We introduced randomized block design in the previous Chapter 14.4.
Statistical model
If Factor B is nested within Factor A, then a group or level within Factor B occurs only within a level of Factor A. Like the randomized block model, there will be no way to estimate the interaction in a nested two-way ANOVA. Our statistical model then is

Examples
Example 1. Three different drugs, 6 different sources of the drugs. The researcher obtains three different drugs from 6 different companies and wants to know if one of the drugs is better than another drug (Factor A) in lowering the blood cholesterol in women. There is always the possibility that different companies will be better or worse at making the drug. So the researchers also use the Factor Source (Factor B) to examine this possibility. Unfortunately they can not obtain all drugs from the same sources. This leads to a Nested ANOVA — notice that each drug is obtained from a different source.
We CANNOT perform the typical two-factor ANOVA because we cannot get a mean of the different drugs by combining the same levels of the Sources: the data is NOT crossed. The Sources of the drugs (Factor B) are NESTED within the type of Drug (Factor A): each source is only found in one of the Drug categories. So, we can’t calculate a mean for the Drug levels independent of the SOURCE from which the drug came.
Table 1. Example of a nested design
|
Drug A
|
Drug B
|
Drug C
|
|||
|
Source 1
|
Source 2
|
Source 3
|
Source 4
|
Source 5
|
Source 6
|
|
202.6
|
189.3
|
212.3
|
203.6
|
189.1
|
194.7
|
|
207.8
|
198.5
|
204.4
|
209.8
|
219.9
|
192.8
|
|
190.2
|
208.4
|
221.6
|
204.1
|
196.0
|
226.5
|
|
211.7
|
205.3
|
209.2
|
201.8
|
205.3
|
200.9
|
|
201.5
|
210.0
|
222.1
|
202.6
|
204.0
|
219.7
|
Scroll to end of this page to get the data set in stacked worksheet format, or click here.
Compare Table 1 to CROSSED data structure (Table 2) — a typical two-factor ANOVA — which would look like
Table 2. Contents of Table 1 presented as crossed design
|
Drug A
|
Drug B
|
Drug C
|
|||
|
Source 1
|
Source 2
|
Source 1
|
Source 2
|
Source 1
|
Source 2
|
|
202.6
|
189.3
|
?
|
?
|
?
|
?
|
|
207.8
|
198.5
|
?
|
?
|
?
|
?
|
|
190.2
|
208.4
|
?
|
?
|
?
|
?
|
|
211.7
|
205.3
|
?
|
?
|
?
|
?
|
|
201.5
|
210.0
|
?
|
?
|
?
|
?
|
We can take a mean of the different drugs by combining the same levels of the Sources. Here’s the nested design (Table 3).
Table 3. Group means, nested design
|
Drug A
|
Drug B
|
Drug C
|
|||
|
Source 1
|
Source 2
|
Source 3
|
Source 4
|
Source 5
|
Source 6
|
|
202.76
|
202.3
|
213.92
|
204.38
|
202.86
|
206.92
|
We can take a mean of the different drugs by combining the same levels of the Sources. Here’s the crossed design (Table 4).
Table 4. Groups means by crossed design.
|
Drug A
|
Drug B
|
Drug C
|
|||
|
Source 1
|
Source 2
|
Source 1
|
Source 2
|
Source 1
|
Source 2
|
|
202.76
|
202.3
|
?
|
?
|
?
|
?
|
Why the “?” in Table 2 and 4? Manufacturing source 1 & 2 do not sell Drug B and Drug C. So, there cannot be a crossed design.
Why can’t we just use a One-Way ANOVA? Can’t we just ANALYZE the three DRUGS separately, ignoring the source issue (after all, the drugs are not all made by the same manufacturer)? But it is not a one-way ANOVA problem… Here’s why.
The researcher suspects that the response of a particular drug might be dependent upon the particular source from which the drug was purchased. So, the type of source from which the drug was purchased is another FACTOR. Thus, drugs from one source might have more (less) affect compared to drugs from another source regardless of the type of drug. However, each drug is NOT available from each source. Thus the research design can NOT be crossed and Drug is NESTED within Source.
We can ask ONLY two questions (hypotheses) from this NESTED ANOVA research design:
HO: There is no difference in the average effect of the drugs on (tumor size, cholesterol level, blood pressure, etc.)
HA: There is a difference in the average effect of the drugs on (tumor size, cholesterol level, blood pressure, etc.)
HO: There is no difference in the average effect of the drugs on (tumor size, cholesterol level, blood pressure, etc.) purchased from different manufacturers.
HA: There is a difference in the average effect of the drugs on (tumor size, cholesterol level, blood pressure, etc.) purchased from different manufacturers.
Notice that we do NOT examine the effect of the interaction between Drug type and source of the drug. Why not?
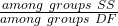
Table 5. Sources of Variation in Nested ANOVA
| Source of Variation |
Sum of Squares
|
DF
|
Mean Squares
|
| Total |  |
 |
|
| Among all subgroups |  |
 |
|
| Among Groups |  |
 |
 |
| Among Subgroups |  |
 |
 |
| Error |
Subtract all of the subgroup Sums of Squares from the Total Sums of Squares
|
 |
 |
Testing nested ANOVA with one main factor
Perhaps surprisingly given the number of terms above, there are only two hypothesis tests, and, only one of REAL interest to us. There are exceptions (eg, quantitative genetics provides many examples), but we are generally most interested in the among group test — this is the test of the main factor. In our example, the main factor was DRUG and whether the drugs differed in their effects on cholesterol levels. The second test is important in the sense that we prefer that it contributes little or no variation to the differences in cholesterol levels. But it might.
Table 6. F statistics for nested ANOVA
| F for the main effect is given as |  |
| F for the subgroup is given by |  |
| and of course, use the appropriate DF when testing the F values!! The Critical Value F0.05 (2), df numerator, df denominator | |
One way to look at this: it would not make sense to conclude that an effect of the main group was significant if the variation in the subgroups was much, much larger. That’s in part why we test the main effect with the subgroups MS and not the error MS. If variation due to the nested variable is not significant, then it is an estimate of the error variance, too.
The nested model we are describing is a two factor ANOVA, but it is incomplete (compared to the balanced, fully crossed 2-way design we’ve talked about before). We don’t have scores in every cell. Instead, each level of nested factor is paired with one and only one level of the other factor. In our example, Source is paired with only one other level of the other factor Drug (eg, Source 1 goes with Drug 1 only), but the main effect is paired with 2 levels of the nesting factor (eg, Drug 1 is manufactured at Source 1 and Source 2).
Note 1. Nesting is strictly one way. Drug is not nested within source, for example.
Some important points about testing the null hypotheses in a nested design. For one, the test of the effect of the nesting factor (Source) is confounded by the interaction between the main factor. We don’t actually know if the interaction is present, but we also get no way to test for it because of the incomplete design. We must therefore be cautious in our interpretation of the effect of the nested factor.
Consider our example. We want to interpret the effect of source as the contribution to the response based on variation among the different suppliers of the drugs. It might be good to know that some drug manufacturer is better (or worse) than others. However, differences among the sources for the different drugs are completely contained in the main effect factor (the test of effects of the different drugs themselves on the response). Therefore, the observed differences between sources COULD be entirely due to the effects of the different drugs and have nothing to do with variation among sources!!
Questions
- Identify the response variable and whether the described factor (in all caps) is suitable for crossed design or nested design
a. In a breeding colony of lab mice, BREEDERS are used to generate up to five LITTERS; effects on offspring REPRODUCTIVE SUCCESS.
b. Effects of individual TEACHERS at different SCHOOLS on STUDENT LEARNING in biology.
c. Lisinopril, an ACE-inhibitor drug prescribed for treatment of high blood pressure, is now a generic drug, meaning a number of COMPANIES can manufacture and distribute the medication. Millions of DOSES of lisinopril are made each year; drug companies are required by the FDA to record when a dose is made and to record these dates by LOT NUMBER. - Work the example data set provide in this page. After loading the data set into Rcmdr (R), use linear model. The command to nest requires use of the forward slash, /. For example, if factor b is nested within factor a, then a/b. The linear model formula then,
Model <- lm(Obs ~ a/b, data=source)
- Describe the problem, i.e., what is a? What is b? What are the hypotheses?
- What is the statistical model?
- Test the model.
- Conclusions?
Quiz Chapter 14.5
Nested designs
Data set used in this page
| Drug | Source | Obs |
| A | s1 | 202.6 |
| A | s1 | 207.8 |
| A | s1 | 190.2 |
| A | s1 | 211.7 |
| A | s1 | 201.5 |
| A | s2 | 189.3 |
| A | s2 | 198.5 |
| A | s2 | 208.4 |
| A | s2 | 205.3 |
| A | s2 | 210 |
| B | s3 | 212.3 |
| B | s3 | 204.4 |
| B | s3 | 221.6 |
| B | s3 | 209.2 |
| B | s3 | 222.1 |
| B | s4 | 203.6 |
| B | s4 | 209.8 |
| B | s4 | 204.1 |
| B | s4 | 201.8 |
| B | s4 | 202.6 |
| C | s5 | 189.1 |
| C | s5 | 219.9 |
| C | s5 | 196 |
| C | s5 | 205.3 |
| C | s5 | 204 |
| C | s6 | 194.7 |
| C | s6 | 192.8 |
| C | s6 | 226.5 |
| C | s6 | 200.9 |
| C | s6 | 219.7 |
Chapter 14 contents
14.4 – Randomized block design
Introduction
Randomized Block Designs and Two-Factor ANOVA
In previous lectures, we have introduced you to the standard factorial ANOVA, which may be characterized as being crossed, balanced, and replicated. We expect additional factors (covariates) may contribute to differences among our experimental units, but rather than testing them — which would increase need for additional experimental units because of increased number of groups to test — we randomize our subjects. Randomization is intended to disrupt trends of confounding variables (aka covariates). If the resulting experiment has missing values (see Chapter 5), then we can say that the design is partially replicated; if only one observation is made per group, then the design is not replicated — and perhaps, not very useful!!
A special type of Two-factor ANOVA which includes a “blocking” factor and a treatment factor.
Randomization is one way to control for “uninteresting” confounding factors. Clearly, there will be scenarios in which randomization is impossible. For example, it is impossible to randomly assign subjects to The blocking factor is similar to the 10.3 – Paired t-test. In the paired t-test we had two individuals or groups that we paired (eg, twins). One specific design is called the Randomized Block Design and we can have more than 2 members in the group. We arrange the experimental units into similar groups, ie, the blocking factor. Examples of blocking factors may include day (experiments are run over different days), location (experiments may be run at different locations in the laboratory), nucleic acid kits (different vendors), operator (different assistants may work on the experiments), etcetera.
In general we may not be directly interested in the blocking factor. This blocking factor is used to control some factor(s) that we suspect might affect the response variable. Importantly, this has the effect of reducing the sums of squares by an amount equal to the sums of squares for the block. If variability removed by the blocking is significant, Mean Square Error (MSE) will be smaller, meaning that the F for treatment will be bigger — meaning we have a more powerful ANOVA than if we had ignored the blocking.
Statistical Testing in Randomized Block Designs
“Blocks” is a Random Factor because we are “sampling” a few blocks out of a larger possible number of blocks. Treatment is a Fixed Factor, usually.
The statistical model is

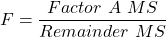
The Sources of Variation are simpler than the more typical Two-Factor ANOVA because we do not calculate all the sources of variation – the interaction is not tested! (Table 1).
Table 1. Sources of variation for a two-way ANOVA, randomized block design
|
Sources of Variation & Sum of Squares
|
DF
|
Mean Squares
|
 |
|
 |
 |
 |
 |
 |
 |
 |
 |
 |
 |
Critical Value F0.05(2), (a – 1), (Total DF – a – b)
In the exercise example above: Factor A = exercise or management plan.
Notice that we do not look at the interaction MS or the Blocking Factor (typically).
Learn by doing
Rather than me telling you, try on your own. We’ll begin with a worked example, then proceed to introduce you to three problems. Click here (Ch 14.8)for general discussion of Rcmdr and linear models for models other than the standard 2-way ANOVA (Chapter 14.8).
Worked example
Wheel running by mice is a standard measure of activity behavior. Even wild mice will use wheels (Meijer and Roberts 2014). For example, we conduct a study of family parity to see if offspring from the first, second, or third sets of births from wheel-running behavior in mice (total revs per 24 hr period). Each set of offspring from a female could be treated as a block. Data are for 3 female offspring from each pairing. This type of data set would look like this:
Table 2. Wheel running behavior by three offspring from each of three birth cohorts among four maternal sets (moms).
|
Revolutions of wheel per 24-hr period
|
||||
|
Block
|
Dam 1
|
Dam 2
|
Dam 3
|
Dam 4
|
|
b1
|
1100
|
1566
|
945
|
450
|
|
b1
|
1245
|
1478
|
877
|
501
|
|
b1
|
1115
|
1502
|
892
|
394
|
|
b2
|
999
|
451
|
644
|
605
|
|
b2
|
899
|
405
|
650
|
612
|
|
b2
|
745
|
344
|
605
|
700
|
|
b3
|
1245
|
702
|
1712
|
790
|
|
b3
|
1300
|
612
|
1745
|
850
|
|
b3
|
1750
|
508
|
1680
|
910
|
Thus, there were nine offspring for each female mouse (Dam1 – Dam4), three offspring per each of three litters of pups. The litters are the blocks. We need to get the data stacked to run in R. I’ve provided the full dataset for readers, scroll to end of this page or click here.
Question 1. Describe the problem and identify the treatment and blocking factors.
Answer. Each female has three litters. We’re primarily interested in genetics (and maternal environment) of wheel running behavior, which is associated with the moms (Treatment factor). The questions is whether there is an effect of birth parity on wheel running behavior. Offspring of a first-time mother may experience different environment than offspring of experienced mother. In this case, parity effects is an interesting question, nevertheless, blocking is the appropriate way to handle this type of problem.
Question 2. What is the statistical model?
Answer. Response variable, Y, is wheel running. Let α the effect of Dam and β the birth cohorts (ie, the blocking effect).
Question 3. Test the model.
Answer. We fit the main effects, Dam and Block Fig 1.

Rcmdr: Statistics → Fit models → Linear model
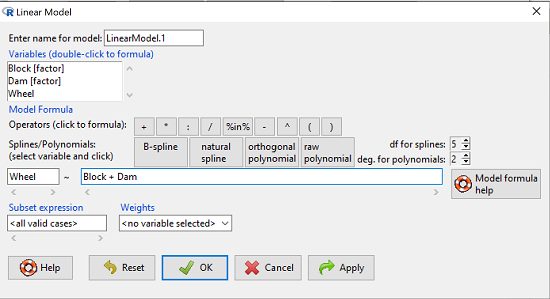
Figure 1. Screenshot Rcmdr Linear Model menu.
then run the ANOVA summary to get the ANOVA table. Rcmdr: Models → Hypothesis tests → ANOVA table.
R Output
Anova Table (Type II tests)

Response: Wheel
           Sum Sq  Df  F value    Pr(>F)
Dam       1467020   3   4.4732   0.01036 *
Block     1672166   2   7.6482   0.00207 **
Residuals 3279544  30
Question 4. Conclusions?
Answer 4. The null hypotheses are:
Treatment factor: Offspring of the different dams have same wheel running activity of offspring.
Blocking factor: No effect of litter parity on wheel running activity of offspring.
Both the treatment factor (p = 0.01036) and the blocking factor (p = 0.00207) were statistically significant.
Questions
Problem 1.
Or we might want to measure the Systolic Blood Pressure of individuals that are on different exercise regimens. However, we are not able to measure all the individuals on the same day at the same time. We suspect that time of day and the day of the year might effect an individuals blood pressure. Given this constraint, the best research design in this circumstance is to measure one individual on each exercise regime at the same time. These different individuals will then be in the same “block” because they share in common the time that their blood pressure was measured. This type of data set would look like this (Table 2):
Table 2. Simulated blood pressure of five subjects on three different exercise regimens.†
|
Subject
|
No
Exercise |
Moderate Exercise
|
Intense Exercise
|
|
1
|
120
|
115
|
114
|
|
2
|
135
|
130
|
131
|
|
3
|
115
|
110
|
109
|
|
4
|
112
|
107
|
106
|
|
5
|
108
|
103
|
102
|
Let’s make a line graph to help us visualize trends (Fig 2).
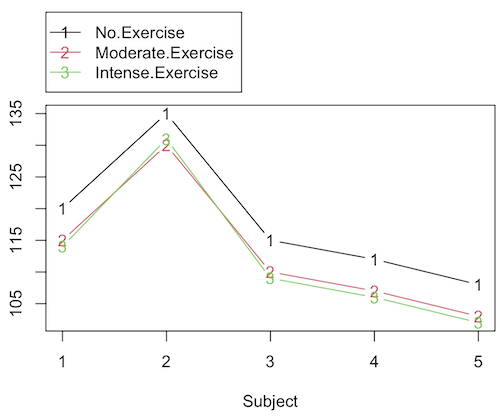
Figure 2. Line graph of data presented in Table 2.
Question 1. Describe the problem and identify the treatment and blocking factors.
Question 2. What is the statistical model?
Question 3. Test the model.
Question 4. Conclusions?
†You’ll need to arrange the data like the data set for the worked example.
Problem 2.
Another example in conservation biology or agriculture. There may be three different management strategies for promoting the recovery of a plant species. A good research design would be to choose many plots of land (blocks) and perform each treatment (management strategy) on a portion of each plot of land (block). A researcher would start with an equal number of plantings in the plots and see how many grew. The plots of land (blocks) share in common many other aspects of that particular plot of land that may effect the recovery of a species.
Table 3. Growth of plants in 5 different plots subjected to one of three management plans (simulated data set).†
|
Plot No.
|
No Management Used
|
Management
Plan 1 |
Management
Plan 2 |
|
1
|
0
|
11
|
14
|
|
2
|
2
|
13
|
15
|
|
3
|
3
|
11
|
19
|
|
4
|
4
|
10
|
16
|
|
5
|
5
|
15
|
12
|
†You’ll need to arrange the data the same arrangement as for the worked example.
These are examples of Two-Factor ANOVA but we are usually only interested in the treatment Factor. We recognize that the blocking factor may contribute to differences among groups and so wish to control for the fact that we carried out the experiments at different times (eg, seasons) or at different locations (eg, agriculture plots)
Question 5. Describe the problem and identify the treatment and blocking factors. Make a line graph to help visualize.
Question 6. What is the statistical model?
Question 7. Test the model.
Question 8. Conclusions?
Repeated-Measures Experimental Design
If multiple measures are taken on the same individual, then we have a repeated-measures experiment. This is a Randomized Block Design. In other words, each animal gets all levels of a treatment (assigned randomly). Thus, samples (individuals) are not independent and the analysis needs to take this into account. Just like for paired-T tests, one can imagine a number of experiments in biomedicine that would conform to this design.
Problem 3.
The data are total blood cholesterol levels for 7 individuals given 3 different drugs (from example given in Zar 1999, Ex 12.5, pp. 257-258).
Table 5. Repeated measures of blood cholesterol levels of seven subjects on three different drug regimens.†
|
Subjects
|
Drug1
|
Drug2
|
Drug3
|
|
1
|
164
|
152
|
178
|
|
2
|
202
|
181
|
222
|
|
3
|
143
|
136
|
132
|
|
4
|
210
|
194
|
216
|
|
5
|
228
|
219
|
245
|
|
6
|
173
|
159
|
182
|
|
7
|
161
|
157
|
165
|
†You’ll need to arrange the data like the data set for the worked example.
Question 9: Is there an interaction term in this design? Make a line graph to help visualize.
Question 10: Are individuals a fixed or a random effect?
Question 11. What is the statistical model?
Question 12. Test the model. Note that we could have done the experiment with 21 randomly selected subjects and a one-factor ANOVA. However, the repeated measures design is best IF there is some association (“correlation”) between the data in each row. The computations are identical to the randomized block analysis.
Question 13. Conclusions?
Problem 4.
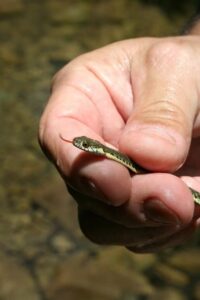
Figure 3. Juvenile garter snake, image from juvenile garter snake in hand, public domain.
Here is a second example of a repeated measures design experiment. Garter snakes (Fig 3) respond to odor cues to find prey. Snakes use their tongues to “taste” the air for chemicals, and flick their tongues rapidly when in contact with suitable prey items, less frequently for items not suitable for prey. In the laboratory, researchers can test how individual snakes respond to different chemical cues by presenting each snake with a swab containing a particular chemical. The researcher then counts how many times the snake flicks its tongue in a certain time period (data presented p. 301, Glover and Mitchell 2016).
Table 6. Tongue flick counts of naïve newborn snakes to extracts†
|
Snake
|
Control (dH2O)
|
Fish mucus
|
Worm mucus
|
|
1
|
3
|
6
|
6
|
|
2
|
0
|
22
|
22
|
|
3
|
0
|
12
|
12
|
|
4
|
5
|
24
|
24
|
|
5
|
1
|
16
|
16
|
|
6
|
2
|
16
|
16
|
†You’ll need to arrange the data like the data set for the worked example.
Question 14. Describe the problem and identify the treatment and blocking factors. Make a line graph to help visualize.
Question 15. What is the statistical model?
Question 16. Test the model.
Question 17. Conclusions?
Quiz Chapter 14.4
Randomized block design
Data sets used in this page
Problem 1 data set
| Block | Dam | Wheel |
|---|---|---|
| B1 | D1 | 1100 |
| B1 | D2 | 1566 |
| B1 | D3 | 945 |
| B1 | D4 | 450 |
| B1 | D1 | 1245 |
| B1 | D2 | 1478 |
| B1 | D3 | 877 |
| B1 | D4 | 501 |
| B1 | D1 | 1115 |
| B1 | D2 | 1502 |
| B1 | D3 | 892 |
| B1 | D4 | 394 |
| B2 | D1 | 999 |
| B2 | D2 | 451 |
| B2 | D3 | 644 |
| B2 | D4 | 605 |
| B2 | D1 | 899 |
| B2 | D2 | 405 |
| B2 | D3 | 650 |
| B2 | D4 | 612 |
| B2 | D1 | 745 |
| B2 | D2 | 344 |
| B2 | D3 | 605 |
| B2 | D4 | 700 |
| B3 | D1 | 1245 |
| B3 | D2 | 702 |
| B3 | D3 | 1712 |
| B3 | D4 | 790 |
| B3 | D1 | 1300 |
| B3 | D2 | 612 |
| B3 | D3 | 1745 |
| B3 | D4 | 850 |
| B3 | D1 | 1750 |
| B3 | D2 | 508 |
| B3 | D3 | 1680 |
| B3 | D4 | 910 |