7.2 – Epidemiology basics
Introduction
A principle aim of epidemiology is to identify frequency and causes of illnesses. Kinds of evidence gathered range from case studies to randomized controlled trials, to meta-analysis and systematic reviews. In turn, how these kinds of evidence are evaluated and turned into policy recommendations generally accounts for additional concerns eg, GRADE – Grading of Recommendations Development, Assessment and Evaluation Schünemann et al 2023). Learning about conditional probability in biostatistics is essential for discussing evidence because it provides a rigorous framework for updating strength of evidence based on new, specific information. It allows for the objective assessment of how new evidence — results from a clinical test — influences the likelihood of a hypothesis — presence/absence of disease for a patient. Conditional probability analysis allows interpretation of a positive test result in the context of disease prevalence, which may lead to the paradoxical conclusion that a test with high sensitivity applied to a person belonging to a low at risk group is more likely a false positive than evidence of a true positive.
Thus, to introduce conditional probability, I have elected to push you into epidemiology and risk analysis. We introduced epidemiology definitions and here, we build on basic terminology of epidemiology. Epidemiology is the study of the causes and distribution of health-related events in a population. It is has been called the basic science of public health (p. 16, Decker 2008).
Prevalence rate
Prevalence of a disease (condition), is defined as the proportion of the population that has the disease (condition) at a point or duration in time. The prevalence statistic is the ratio of the number of existing cases divided by the total population.
For example, prevalence of Type 2 diabetes in Hawai`i. The 2020 populations was about 1.4 million. A survey was conducted on a random of 1000 individuals and 80 were reported to have Type 2 diabetes. What is the estimated prevalence of Type 2 diabetes in Hawai`i?
Start from perspective — what if we actually have something close to a census count? For the actual estimates, see the report at the Hawaii State DOH website. With every estimate of a statistic, we need a confidence interval (CI). An approximate (good for large samples) formula for the 95% CI of prevalence is

where  is the 2010 prevalence in the population (8.3%), N is the population size (1,360,301), and z is the standard normal probability. For a 95% CI, then we want z95%.
If you recall, we can get this from our standard normal probability table, or directly from R. We want to know z that is in the ± 2.5% tails of the distribution (that’s 0.05 ÷ 2, see Ch 8.4 – Tails of a test). Our R code then is
qnorm(c(0.025), mean=0, sd=1, lower.tail=FALSE)
which returns
[1] 1.959964
You should confirm that setting lower-tail = TRUE yields -1.96 (rounded).
Alternately, if using Rcmdr: Distributions → Continuous distributions → Normal distribution → Normal quantiles… (Fig 1).
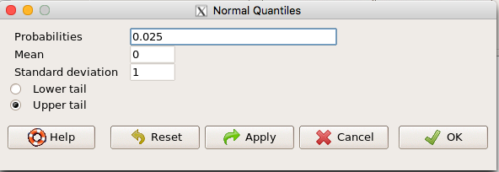
Figure 1. R Commander popup menu for Normal quantiles.
Thus, for our example, the 95% CI was ( ; our confidence in our estimate of the prevalence of diabetes in Hawaii is between 8.25% and 8.35%. Again, note that for our purposes it is OK to calculate the approximate confidence interval, replace
 with
 (for large N, the differences are observed in the 0.001 decimal).
Prevalence: R code
Rather than census counts, more likely we have results of smaller surveys. We use the epi.conf() function from the epiR package. Code adapted from example provided in epiR_descriptive vignette.
Note 1: Many R packages include vignettes, which, together with the package manual, is often helpful to understand what a function is intended to do and how to get the most from the function. R code to call all vignettes available for a package, eg, epiR:
vignette(package="epiR")
which will return names of available vignettes. For epiR, these are
epiR_descriptive Descriptive epidemiology (source, html)
epiR_surveillance Disease surveillance (source, html)
epiR_measures_of_association Measures of association (source, html)
epiR_sample_size Sample size calculations (source, html)
To call up the vignette we need for this example,
vignette("epiR_descriptive", package="epiR")
which brings up the page (assuming you installed the html help files during installation of base R).
library(epiR)
pop.Hawaii = 1.4e06
pop.Survey = 1000
type2.Survey = 80
Table.2 <- as.matrix(cbind(type2.Survey, pop.Survey))
epi.conf(Table.2, ctype = "prevalence", method = "exact", N = pop.Hawaii, design = 1, conf.level = 0.95) * 100
R output
   est    lower    upper
1    8 6.394198 9.857978
Thus, estimated Type 2 diabetes prevalence from the survey was 8, with 95% confidence interval 6.4 to 9.9 cases per 100 individuals. From 2020 U.S. Census, Hawai`i population was 1,455,271.
Note 2: Type 2 diabetes is one of many conditions for which prevalence is greater among Native Hawaiian and Pacific Islander populations compared to other groups in Hawai’i (Galinski et al 2016); these are called health disparitiess.
Incidence rate
Incidence of a disease (or condition) is defined as the occurrence of new cases of a disease. The simplest way to view incidence is that if everyone was followed for the same period of time, then incidence rate is the number of new cases since the start of the study divided by the total population. This is too simplistic, so we define a better metric called person-time. Incidence rate (IR) is then the ratio of the number of new cases divided by total person-time.
Again, incidence rate is an estimate. Therefore, we need a confidence interval. Assuming the population is large, then confidence interval can be calculated as

where IR is the incidence rate, T is the person-time, N is the number of events or cases, and z again is the standard normal probability (z ± 1.96 for 95% confidence interval).
For our example, N = 3 cases, T = 236 p-d, so 95% CI is (11.3%, 14.1%).
Person-time
Person-time can be days, months, years. Person-time is best defined with an example.
Five men join a study that will last 70 days. These men were selected because they had suffered a myocardial infarction (MI) and at the start of the study, they receive the same treatment. The outcome of the study is whether or not the subjects suffer a second MI.
The results are shown below
Subject A, 53 days
Subject B, 70 days
Subject C, 24 days
Subject D, 70 days
Subject E, 19 days
Add up the person days,

Now calculate the incidence rate,

that’s 3 cases (A, C, E) divided by 236 p-d = 0.0127. Multiply this by 1000 and we get our final answer for the incidence rate, 12.7 per person-days.
Incidence rate: R code
Incidence rate of myocardial infarction (MI) study. Code adapted from example provided in epiR_descriptive vignette.
ncas = 3
ntar = 236
tmp <- as.matrix(cbind(ncas, ntar))
epi.conf(tmp, ctype = "inc.rate", method = "exact", N = 1000, design = 1, conf.level = 0.95) * 1000
R output
          est    lower    upper
ncas 12.71186 2.621492 37.14946
The incidence rate of myocardial infarction was 12.7 (95% CI 2.6 to 37.2) cases per 1000 person-days.
Age-specific rates
Incidence or prevalence rates may be reported for specific age groups. For example, we can distinguish between number of live births in Hawaii in 2017, and numbers of live births by age group of the mother.
Age-adjusted rates
If populations with different age demographics, then the convention is to adjust the populations to a standard reference population with known age and other demographic properties. For example, the CDC uses the 2000 census as the standard population (CDC definitions, age adjustment, retrieved January 2023).
Questions
- Calculate the confidence interval of type 2 prevalence in Hawai`i with the 2020 census population value. How much did it change?
- Recalculate the confidence interval for a 99% confidence interval. Which estimate communicates greater confidence in the estimate?
Quiz
Quiz Chapter 7.2
Epidemiology basics
Chapter 7 contents
6.9 – Chi-square distribution
Introduction
As noted earlier, the normal deviate or Z score can be viewed as randomly sampled from the standard normal distribution. The chi-square distribution describes the probability distribution of the squared standardized normal deviates with degrees of freedom, df, equal to the number of samples taken. (The number of independent pieces of information needed to calculate the estimate, see Ch. 8.) We will use the chi-square distribution to test statistical significance of categorical variables in goodness of fit tests and contingency table problems.
The equation of the chi-square is
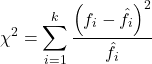
where k is the number of groups or categories, from 1 to k, and fi is the observed frequency and fi “hat” is the expected frequency for the kth category. We call the result of this calculation the chi-square test statistic. We evaluate how often that value or greater of a test statistic will occur by applying the chi-square distribution function. Graphs to show chi-square distribution for degrees of freedom equal to 1 – 5, 10, and 20 (Fig 1).
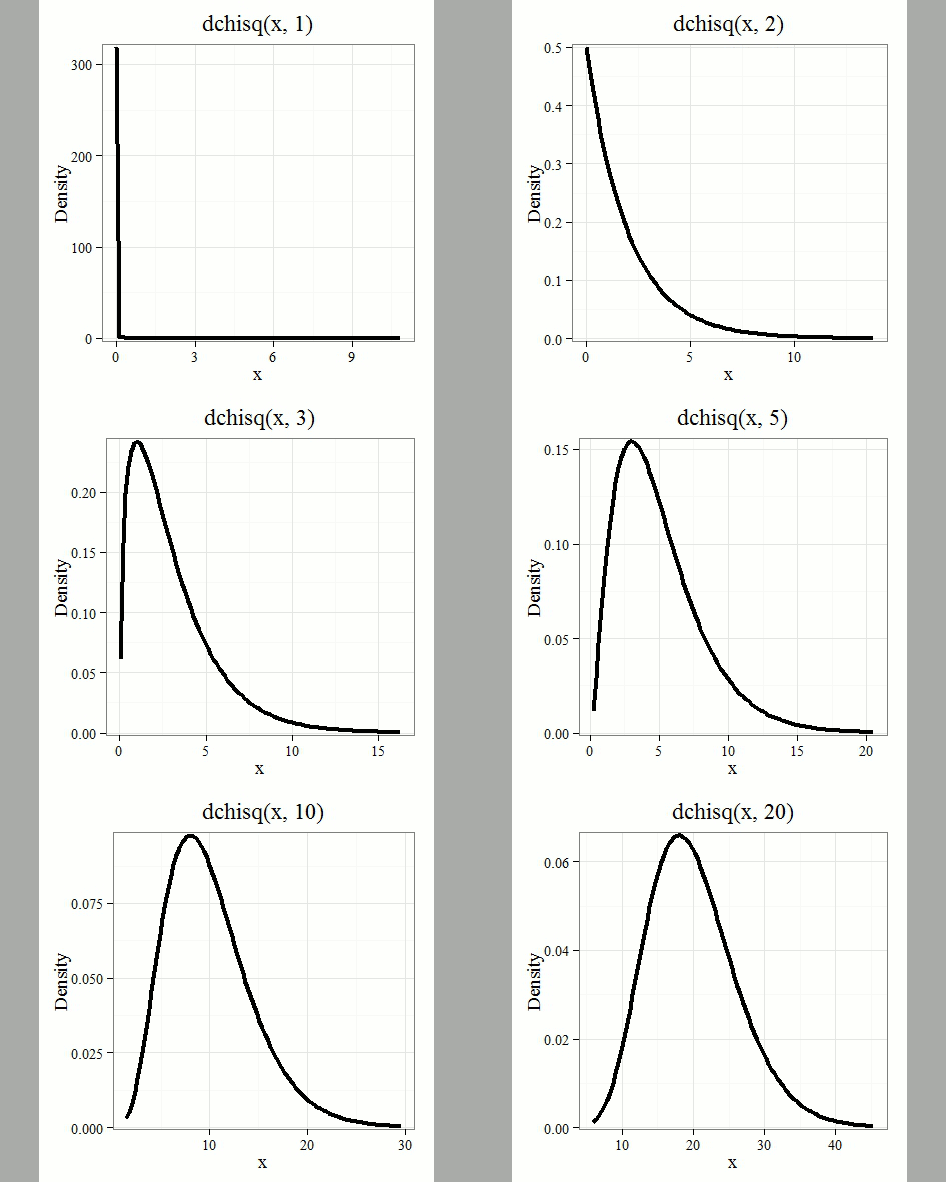
Figure 1. Animated GIF of plots of chi-square distribution over range of degrees of freedom.
Note that the distribution is asymmetric, particularly at low degrees of freedom. Thus tests using the chi-square are one-tailed (Fig 2).
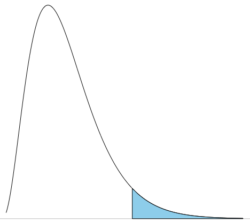
Figure 2. The test of the chi-square is typically one-tailed. In this case, probability of values greater than the critical value.
By convention in the Null Hypothesis Significance Testing protocol (NHST), we compare the test statistic to a critical value. The critical value is defined as the value of the test statistic — the cutoff boundary between statistical significance and insignificance — that occurs at the Type I error rate, which is typically set to 5%. The interpretation of the result is as follows: after calculating a test statistic, we can judge significance of the results relative to the null hypothesis expectation. If our test statistics is greater than the critical value, then the p-value of our results are less than 5% (R will report an exact p-value for the test statistic). You are not expected to be able to follow this logic just yet — rather, we teach it now as a sort of mechanical understanding to develop in the NHST tradition. The justification for this approach to testing of statistical significance is developed in Chapter 8. A portion of the critical values of the chi-square distribution are shown in Figure 3.
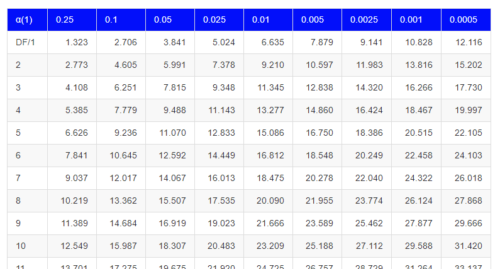
Figure 3. Portion of the table of some critical values of chi-square distribution, one tailed (right-tailed or “upper” portion of distribution).
See Appendix for a complete chi-square table.
The chi-squared test is a one-tailed test.
The result of the calculation of the test statistic is always non-negative because it is calculated by squaring the differences between the observed and expected frequencies. As a consequence, the test is always “right-tailed.”
The chi-square test does not provide information about the direction of an association, nor the strength of the association, only whether or not the variables are independent or associated. We use “correlation,” (eg, Phi coefficient or Cramer’s V, see Chapter 9.1 – Chi-square test: Goodness of fit and Chapter 9.2 – Chi-square contingency tables), to quantify the strength and direction of the association. While statistical significance is important, examining the direction and magnitude, the effect size, provides actionable insight and context for making informed decisions. For example, a new drug tested in a clinical trial may show an association between subject improvement (statistical significance), but yet have a small effect.
Example
Professor Hermon Bumpus of Brown University in Providence, Rhode Island, received 136 House Sparrows (Passer domesticus) after a severe winter storm 1 February 1898. The birds were collected from the ground; 72 of the birds survived, 64 did not (Table 1). Bumpus made several measures of morphology on the birds and the data set has served as a classical example of Natural Selection (Chicago Field Museum). We’ll look at this data set when we introduce Linear Regression.
Table 1. Survival statistics of Bumpus House sparrows
| Yes | No | |
| Female | 21 | 28 |
| Male | 51 | 36 |
Was there a survival difference between male and female House Sparrows? This is a classic contingency table analysis, something we will at length in Chapter 9. For now, we report the Chi-square test statistic for this test was 3.1264 and the test had one degree of freedom. What is the critical value of the chi-square distribution at 5% and one degree of freedom?. Typically we would simply use R to look this up
qchisq(c(0.05), df=1, lower.tail=FALSE)
But we can also get this from the table of critical values (Fig 4). Simply select the row based on the degrees of freedom for the test then scan to the column with the appropriate significance level, again, typically 5% (0.05).
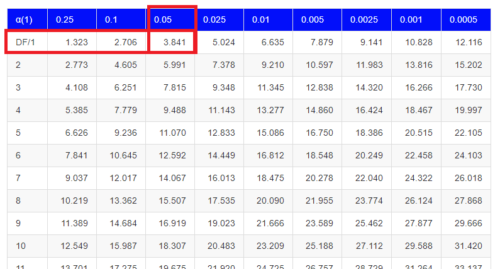
Figure 4. Portion of the chi-square distribution which shows how to find critical value of the chi-square distribution.
For 1 degree of freedom at 5% significance, the critical value is 3.841. Back to our hypothesis: Did male and female survival differ in the Bumpus data set? Following the NHST logic, if the test statistic value (eg, 3.1264) is greater than the critical value (3.841), then we would reject the null hypothesis. For this example, we would conclude no statistical difference between male and female survival because the test statistic was smaller than the critical value. How likely are these results due to chance? That’s where the p-value comes in. Our test statistic value falls between 5% and 10% (2.706 < 3.1264 < 3.841). In order to get the actual p-value of our test statistic we would need to use R.
R code
Given a chi-square test statistic you can use R to calculate the probability of that value against the null hypothesis. At the R prompt
pchisq(c(3.1264), df=1, lower.tail=FALSE)
And R output
[1] 0.07703368
Because we are using R Commander, simply select the command by following the menu options.
Rcmdr: Distributions → Continuous distributions → Chi-squared distribution → Chi-squared probabilities …
Enter the chi-square value and degrees of freedom (Fig 5).
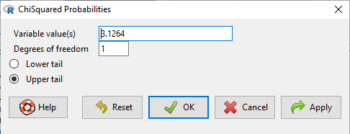
Figure 5. Screenshot of input box in Rcmdr for Chi-square probability values.
Questions
- What happens to the shape of the chi-square distribution as degrees of freedom are increased from 1 to 5 to 20 to 100?
Be able to answer these questions using the Chi-square table, Appendix 20.2, or using Rcmdr
- For probability α = 5%, what is the critical value of the chi-square distribution (upper tail)?
- The value of the chi-square test statistic is given as 12. With 3 degrees of freedom, what is the approximate probability of this value, or greater from the chi-square distribution?
Quiz Chapter 6.9
Chi-square distribution
Chapter 6 contents
- Introduction
- Some preliminaries
- Ratios and proportions
- Combinations and permutations
- Types of probability
- Discrete probability distributions
- Continuous distributions
- Normal distribution and the normal deviate (Z)
- Moments
- Chi-square (Χ2) distribution
- t distribution
- F distribution
- References and suggested readings
6.7 – Normal distribution and the normal deviate (Z)
Introduction
In chapter 3.3 we introduced the normal distribution and the Z score, aka normal deviate, as part of a discussion about how some knowledge about characteristics of the dispersion of our data sampled from a population could be used to calculate how many samples we need (the empirical rule). We introduced Chebyshev’s inequality as a general approach to this problem, where little is known about the distribution of the population and contrasted it with the Z score, for cases where the distribution is known to be Gaussian or the normal distribution. The normal distribution is one of the most important distributions in classical statistics. All normal distributions are bell-shaped and symmetric about the mean. To describe a normal distribution only two parameters are needed: the population mean, μ, and the population standard deviation, σ. The normal distribution with mean equal to zero and standard deviation equal to one is called the standard normal, or Z distribution. With use of the Z score any normal distribution can be quickly converted to the standard normal distribution.
Proportions of a Normal Distribution
This concept will become increasingly important for the many statistical tests we will learn over the next few weeks. What is the proportion of the populations that is greater than some specific value? Below (Fig 1), again, I have generated a large data set, now with population mean µ = 5 and σ = 2. The red line corresponds to the equation of the normal curve using our values of µ = 5 and σ = 2.

Figure 1. Frequency of observations expected to be greater than 7 (red bars) from a large population with mean µ = 5 and σ = 2.
R code for Fig 1.
set.seed(123)
myData <- rnorm(1000, mean = 5, sd = 2)
h <- hist(myData, breaks = 20, plot = FALSE)
threshold <- 7
# Bars with midpoints greater than threshold will be "red",
# and others will be "white."
bar_colors <- ifelse(h$mids > threshold, "red", "white")
plot(h, col = bar_colors, xlab = "Value", ylab = "Frequency")
Note that this is a crucial step! We assume that our sample distribution is really a sample from a population density (= “area under the curve”) function (= “an equation”) for a normal random (= “population”) variable.
Once I (you) make this assumption, then we have powerful and easy to use tools at our command to answer questions like
Question: What proportion of the population is greater than 7 (Fig 1, colored in red)?
This gets to the heart of the often-asked question, How many samples should I measure? If we know something about the mean and the variability, then we can predict how many samples will be of a particular kind. Let’s solve the problem.
The Z score
We could use the formula for the normal curve (and a lot of repetitions), but fortunately, some folks have provided tables that short-cut this procedure. R and other programs also can find these numbers because the formulas are “built in” to the base packages. First, let’s introduce a simple formula that lets us standardize our population numbers so that we can use established tables of probabilities for the normal distribution.
Below, we will see how to use Rcmdr for these kinds of problems.
However, it’s one of the basic tasks in statistics that you should be able to do by hand. We’ll use the Z score as a way to take advantage of known properties of the standard normal curve.
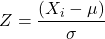
Z = 1 (with the mean and SD). Z (say “Z-score”) is called the normal deviate (aka “standard normal score”; it is also called the “Z-score”); it gives us a shortcut for finding the proportion of data greater than 7 in this case).
We use the normal deviate to do a couple of things; one use is to standardize a sample of observations so that they have a mean of zero and a standard deviation of one (the Z distribution). The data would then said to have been normalized.
The second use is to make predictions about how often a particular observation is likely to be encountered. As you can imagine, this last use is very helpful for designing an experiment — if we need to see a specified difference, we can conduct a pilot study (or refer to the literature) to determine a mean and level of variability for our observation of choice, plug these back into the normal equation and predict how likely we can expect to see a particular difference. In other words, this is one way to answer that question — how many observations need I make for my experiment to be valid?
Table of normal distribution
A portion of the table of the normal curve is provided at our web site and in your workbook. For our discussions, here’s another copy to look at (Fig 2).
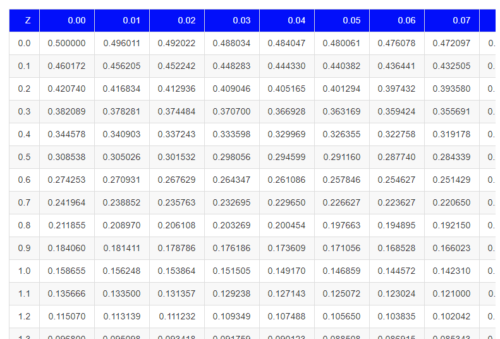
Figure 2. Portion of the table of the normal distribution. Only values equal to or greater than Z = 0 are visible.
See Table 1 in the Appendix for a full version of the normal table.
We read values of Z from the first column and the first row. For Z = 0.23 we would scan the top row, scoot over to fourth column, then trace to where the row and column intersect (Fig 3); the frequency of occurrence of values at Z = 0.23 is 0.409046 or 40.9% (Fig 3).
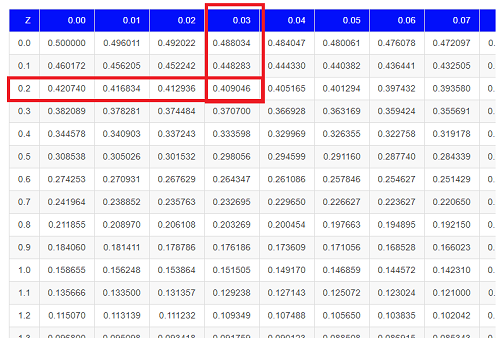
Figure 3. Highlight Z = 0.23, frequency is 0.409046.
Z on the standard normal table is going to range between -4 and +4, with Z = 0 corresponding to 0.500. The Normal table values are symmetrical about the mean of zero.
What to make of the values of Z, from -4, -3, … +2, +3, up to +4 and beyond? These are the standard deviations! Recall that using the Z score you corrected to mean of zero (got it!), and a standard deviation of one! A Z of 2 is twice the standard deviation; a Z = 3 is therefore three times the standard deviation, and so forth. The distribution is symmetrical: you get the same frequency for negative as for positive values. So on the “X” axis on a standard normal distribution, we have units of standard deviation plus (greater) or minus (less) than the mean. In Figure 4, area less than -1 standard deviations is highlighted (Fig 4).
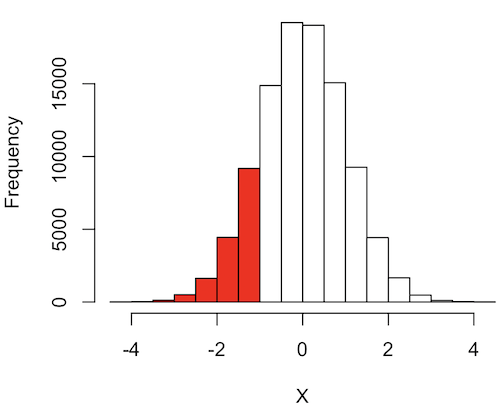
Figure 4. Plot of standard normal distribution; area less than -1 σ.
R code for Fig 4.
set.seed(123)
myData2 <- rnorm(100000, mean = 0, sd = 1)
threshold <- -1
bar_colors <- ifelse(h$mids < threshold, "red", "white")
# Additional code used, same as Figure 1.
Question. How many multiples of standard deviations would you have for a Z score of Z = 1.75?
Answer = 1.75 times
Examples
See Table 1 in the Appendix for a full version of the normal table as you read this section.
What proportion of the data set will have values greater than 7? After applying our Z score equation, I get Z = 1.0 and for a Z of 1.0 = 0.1587 or 15.87% of the observations are greater than 7.
What proportion of the data set will have values less than -7? After applying our Z score equation, I get Z = -1.0. Taking advantage of symmetry argument, I just take my Z = -1.0 and make it positive — instead of values smaller than -1.0 we now have values greater than +1.0. And for a Z of 1.0 = 0.1587 or 15.87% of the observations are greater than 7, which means that 15.87% will be -7 or smaller.
What proportion of the data set will have values greater than 8? Again, apply the Z score equation I get Z of 1.5 = 0.0668 or 6.68% of the observations are greater than Z.
What proportion of the population is between 5 and 7 ? (colored in red). Draw the problem (example shown in Fig 5).
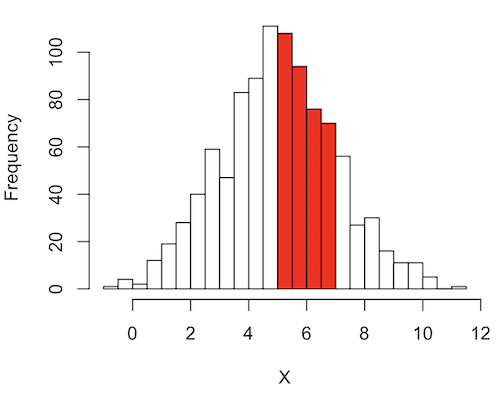
Figure 5. Proportion of the population is between 5 and 7.
R code for Fig 5.
# Used myData from Fig 1 code.
highlight_start <- 5
highlight_end <- 7
bar_colors <- rep("white", length(h$counts))
bar_colors[h$breaks[-length(h$breaks)] >= highlight_start & h$breaks[-1] <= highlight_end] <- "red"
# Additional code used, same as Figure 1.
Note 1: h$breaks[-length(h$breaks)] gives the left edges of the bins, and h$breaks[-1] gives the right edges.
Worked problem
1 – (proportion beyond 7) – (proportion less than 5)
1 – (0.1587) – (proportion less than 5)
And the proportion less than 5?
Use Z-score equation again. Now we find that
Z = 0
And look up Z of 0 from the table = 0.5 proportion or 50.0%
Therefore, the proportion between 5 & 7 equals
1 -0.1587 – 0.50 = 0.3413
Answer = 34.13 % of the observations are between 5 and 7 when the mean µ = 5 and s = 2.
Questions
Several questions were asked in the text.
1. Proportion of observations greater than 7 from a large population with mean µ = 5 and σ = 2.
2. How many multiples of standard deviations would you have for a Z score of Z = 1.75?
3.
Quiz Chapter 6.7
Normal distribution questions
Chapter 6 contents
- Introduction
- Some preliminaries
- Ratios and probabilities
- Combinations and permutations
- Types of probability
- Discrete probability distributions
- Continuous distributions
- Normal distribution and the normal deviate (Z)
- Moments
- Chi-square (Χ2) distribution
- t distribution
- F distribution
- References and suggested readings