3.5 – Statistics of error
Making sense of error in data.
This page explains how statistics of error help quantify differences between measured and true values, beginning with classical methods like standard error and confidence intervals that rely on large-sample assumptions. Related, statisticians talk about uncertainty — the quantification of doubt about a measurement. We introduce permutation-based approaches, including jackknife and bootstrap resampling, which avoid those assumptions and are especially useful with smaller or complex data sets. Observer variation (intra- and interobserver error) is also highlighted as an important source of measurement error.
Missing values are another common source of uncertainty in biological data sets. Data may be missing because of equipment failure, recording mistakes, sample loss, or biological factors that prevent a measurement from being collected. Even a small number of missing observations can influence summaries, graphs, and statistical tests, especially in smaller studies. In this chapter, we treat missing values mainly as a practical issue to identify and report during exploratory data analysis. Later, in the chapter on experimental design, we examine missing data in greater depth, including differences between random and non-random missingness, as well as approaches such as data imputation and the consequences these choices may have for interpretation.
We conclude with a discussion about confidence intervals as a measure of accuracy and emphasize proper use of significant figures to avoid overstating precision.
Statistics of error.
In statistics, error doesn’t mean mistake, an avoidable human misjudgement or oversight, eg, a typo. An error in statistics means there was a difference between the measured value and the actual value for an object. Efforts by many authors of notable classical statistics developed a large body of calculated statistics, eg, standard error the mean, which allows the user to quantify how large the error of measurement is given assumptions about the distribution of the errors. Thus, classical statistics requires user to make assumptions about the error distribution, the subject of our Chapter 6. A critical issue to understand is that these methods assume large sample sizes are available; they are called asymptotic statistics or large-sample statistics; the properties of the statistical estimates are evaluated as sample size approaches infinity.
Jackknife sampling and bootstrap sampling are permutation approaches to working with data when the Central Limit Theorem — as sample size increases, the distribution of sample means will tend to a normal distribution (see Chapter 6.7) — is unlikely to apply or, rather, we don’t wish to make that assumption (Chapter 19). The jackknife is a sampling method involving repeatedly sampling from the original data set, but each time leaving one value out. The estimator, for example, the sample mean, is calculated for each sample. The repeated estimates from the jackknife approach yield many estimates which, collected, are used to calculate the sample variance. Jackknife estimators tend to be less biased than those from classical asymptotic statistics.
Bootstrapping, and not jackknife resampling, may now be the preferred permutation approach (eg, Google Scholar search “bootstrap statistics” 36K hits; “jackknife statistics” 17K hits), but which method is best depends on qualities of the data set. Bootstrapping involves large numbers of permutations of the original data, which, in short, means we repeatedly take many samples of our data and recalculate our statistics on these sets of sampled data. We obtain statistical significance by comparing our result from the original data against how often results from our permutations on the resampled data sets exceed the originally observed results. By permutation methods, the goal is to avoid the assumptions made by large-sample statistical inference, ie, reaching conclusions about the population based on samples from the population. Since its introduction, “bootstrapping” has been shown to be superior in many — but, importantly, not all — cases for statistics of error compared to the standard, classical approach (Efron 1979, Hesterberg 2015).
There are many advocates for the permutation approaches, and, because we have computers now instead of the hand calculators our statistics ancestors used, permutation methods may be the approach you will take in your own work. However, the classical approach has its strengths — when the conditions, that is, when the assumptions of asymptotic statistics are met by the data, then the classical approaches tend to be less conservative than the permutation methods. By conservative, statisticians mean that a test performs at the level we expect it to. Thus, if the assumptions of classical statistics are met they return the correct answer more often than do the permutation tests.
Error and the observer.
Individual researchers make observations, therefore, we can talk about observer variation as a kind of error measurement. For repeated measures of the same object by an individual, we would expect the individual to return the same results. To the extent repeated measures differ, this is intraobserver error. In contrast, measures of the same object from different individuals is interobserver error. For a new instrument or measurement system, one would need to establish the reliability of the measure: confronted with the same object do researchers get the same measurement? Accounting for interobserver error applies in many fields, eg, histopathology of putative carcinoma slides (Franc et al 2003), liver biopsies for cirrhosis (Rousselet et al 2005), blood cell counts (Bacus 1973).
Confidence in estimates.
A really useful concept in statistics is the idea that you can assign how confident you are to an estimate. This is another way to speak of the accuracy of an estimate. Clearly, we have more confidence in a sample estimate for a population parameter if many observations are made. Another factor in our ability to estimate is the magnitude of observation differences. In general, the larger the differences among values from repeated trials, the less confident we will be in out estimate, unless, again, we make our estimates from a large collection of observations. These two quantities, sample size and variability, along with our level of confidence, eg, 95%, are incorporated into a statistic called the confidence interval.

We will use this concept a lot throughout the course; for now, a simple but approximate confidence interval is to use the 2 x SEM rule (as long as sample size large): twice the standard error of the mean. Take your estimate of the mean, then add (upper limit) or subtract (lower limit) twice the value of the standard error of the mean (if you recall, that’s the standard deviation divided by the square-root of the sample size).
Example. Consider five magnetic darts thrown at a dart board (28 cm diameter, height of 1.68m from the floor) from a distance of 3.15 meters (Fig 1).

Figure 1. Magnetic dart board with 5 darts. Click image to view full sized image.
The distance in centimeters (cm) between where each of the five darts landed on the board compared to the bullseye is reported in (Table 1),
Table 1. Results of five darts thrown at a target (Figure 2)*
| Dart | Distance |
|---|---|
| 1 | 7.5 |
| 2 | 3.0 |
| 3 | 1.0 |
| 4 | 2.7 |
| 5 | 7.4 |
* distance in centimeters from the center.
Note 1: Use of the coordinate plane, and including the angle measurement in addition to distance (the vector) from center, would be a better analysis. In the context of darts, determining accuracy of a thrower is an Aim-Point targeting problem and part of your calculation would be to get MOA (minute of angle). For the record, the angles (degrees) were
| Dart | Distance | Angle |
|---|---|---|
| 1 | 7.5 | 124.4 |
| 2 | 3.0 | -123.7 |
| 3 | 1.0 | 96.3 |
| 4 | 2.7 | -84.3 |
| 5 | 7.4 | -31.5 |
measured using imageJ. Because there seems to be an R package for just about every data analysis scenario, unsurprisingly, there’s an R package called shotGroups to analyze shooting data.
How precise was the dart thrower? We’ll use the coefficient of variation as a measure of precision. Second, how accurate were the throws? Use R to calculate
darts = c(7.5, 3.0, 1.0, 2.7, 7.4)
#use the coefficient of variation to describe precision of the throws
coefVar = 100*(sd(darts)/mean(darts)); coefVar
[1] 68.46141
Confidence Interval to describe accuracy.
For a game of darts, the true value would be a distance of zero — all bullseyes. We need to calculate the standard error of the mean (SEM), then, we calculate the confidence interval around the sample mean.
#Calculate the SEM
SEM <- sd(darts)/sqrt(length(darts)); SEM
[1] 1.322649
#now, get the lower and upper limit, subtract from the mean
confidence <- c(mean(darts)-2*SEM, mean(darts), mean(darts)+2*SEM); confidence
[1] 1.674702, 4.320000, 6.965298
The mean was 4.3 cm, therefore to get the lower limit of the interval subtract 2.65 (2*SEM = 2.645298) from the mean; for the upper limit add 2.65 to the mean. Thus, we report our approximate confidence interval as (1.7, 7.0), and we read this as saying we are about 95% confident the population value is between these two limits. Five is a very small sample number, so we shouldn’t be surprised to learn that our approximate confidence interval would be less than adequate. In statistical terms, we would use the t-distribution, and not the normal distribution, to make our confidence interval in cases like this.
Note 2: As a rule, implied by Central Limit theory and use of asymptotic statistical estimation, a sample size of 30 or more is safer, but probably unrealistic for many experiments. This is sometimes called as the rule of thirty. (For example, a 96-well PCR array costs about $500; with n = 30, that’s $15,000 US Dollars for one group!). So, what about this rule? This type of thinking should be avoided as “a relic of the pre-computer era,” (Hesterberg, T. (2008). It’s Time To Retire the” n>= 30″ rule.). We can improve on asymptotic statistics by applying bootstrap principles (Chapter 19).
We made a quick calculation of the confidence interval; we can get make this calculation by hand by incorporating the t distribution. We need to know the degrees of freedom, which in this case is 4 (n – 1, where n = 5). We look up critical value of t at 5% (to get our 95% confidence interval), t = 2.78. Subtract for lower limit t*SEM and add for upper limit t*SEM to the sample mean for the 95% confidence interval.
We can get help from R, by using the one-sample t-test with a test against the hypothesis that the true mean is equal to zero. Among a variety of output we will introduce later (see Chapter 8 and 10), the confidence interval is reported (yellow highlight),
#make an attach a data frame object
Ddarts <- data.frame(darts)
t.test(darts,mu=0)
One Sample t-test
data: darts
t = 3.2662, df = 4, p-value = 0.0309
alternative hypothesis: true mean is not equal to 0
95 percent confidence interval:
 0.6477381 7.9922619
sample estimates:
mean of x
 4.32
t.test uses the function qt(), which provides the quantile function. To recreate the 95% CI without the additional baggage output from the t.test, we would simply write
#upper limit
mean(darts)+ qt(0.975,df=4)*sd(darts)/sqrt(5)

#lower limit
mean(darts)+ qt(0.025, df = 4, lower.tail=TRUE)*sd(darts)/sqrt(5)
where sd(darts)/sqrt(5) is the standard error of the mean.
Or, alternatively, download and take advantage of a small package called Rmisc (not to be confused with the RcmdrMisc package) and use the function CI
library(Rmisc)
CI(darts)
     upper     mean     lower
7.9922619 4.3200000 0.6477381
The advantage of using the CI() command from the package Rmisc is pretty clear; I don’t have to specify the degrees of freedom or the standard error of the mean. By default, CI reports the 95% confidence interval. we can specify any interval simply by adding to the command. For example,
CI(darts, ci=0.90)
reports upper and lower limits for the 90% confidence interval.
Try it. On your own, get the 90% confidence interval and the 99% confidence intervals for our dart example. Compare to the 95% confidence interval — what do you conclude about “confidence” in our estimate from 90% to 99%?
Confidence intervals from p-values.
And finally, it is not unusual for a report to provide summary statistics, differences between means (ie, effect size), and p-values (orange highlight), but not report confidence intervals. We discuss p-values and the concept of statistical significance beginning in Chapter 8. But for now, we show how to calculate approximate confidence intervals from the p-value. This may be of use for conducting meta-analysis (Chapter 20.15). See two helpful “how to” articles by Bland and Altman in 2011 BMJ (references listed in Chapter 3.6 – References).
In brief, calculate the test statistic for a normal distribution (letZ), calculate a standard error, and then the lower and upper limits for the 95% confidence interval. We illustrate use of the calculator formulas with the dart example, the p-value was 0.0309; the estimate was 4.32.
R code
letZ = (-0.862 + sqrt(0.743 - 2.404*log(0.0309, base = exp(1)))) = 2.154903
letSE = 4.32/letZ = 2.00473
1.96*letSE = 3.929271 # Add for upper and subtract for lower
The lower limit is 0.39 (4.32 – 3.929271) and the upper limit is 8.25 (4.32 + 3.929271). Although in the ballpark, these calculated estimates are wider than the confidence interval estimated by the t.test command. Small sample size, n = 5, is to blame — the accuracy of these methods, based on asymptotic statistical estimation approaches, assumes the law of large numbers applies.
Significant figures.
And finally, we should respect significant figures, the number of digits which have meaning. Our data were measured to the nearest tenth of a centimeter, or two significant figures. Therefore, if we report the confidence interval as (0.6477381, 7.9922619), then we imply a false level of precision, unless we also report our random sampling error of measurement.
R has a number of ways to manage output. One option would be to set number of figures globally with the options() function — all values reported by R would hold for the entire session. For example, options(digits=3) would report all numbers to three significant figures. Instead, I prefer to use signif() function, which allows us to report just the values we wish and does not change reporting behavior for the entire session.
signif(CI(darts),2)
upper  mean lower
 8.00  4.30  0.65
Note 3: The options() function allows the R user to set a number of settings for an R session. After gaining familiarity with R, the advanced user recognizes that many settings can be changed to make the session work to report in ways more convenient to the user. If curious, submit options() at the R prompt and available settings will be displayed.
The R function signif() applies rounding rules. We apply rounding rules when required to report estimates to appropriate levels of precision. Rounding procedures are used to replace a number with a simplified approximation. Wikipedia provides a comprehensive list of rounding rules. Notable rules include
- directed rounding to an integer, eg, rounding up or down
- rounding to nearest integer, eg, round half up (down) if the number ends with 5
- randomly rounding to an integer, eg, stochastic rounding.
With the exception of stochastic rounding, all rounding methods impose biases on the sets of numbers. For example, the round half up method applied for numbers above 5, round down for numbers below 5 will increase the variance of the sample. In R, use round() for most of your work. If you need one of the other approaches, for example, to round up, the command is ceiling(); to round down we use floor().
When to round?
No doubt your previous math classes have cautioned you about the problems of rounding error and their influence on calculation. So, as a reminder, if reporting calls for rounding, then always round after you’ve completed your calculations, never during the calculations themselves.
A final note about significant figures and rounding. While the recommendations about reporting statistics are easy to come by (and often very proscriptive, eg, Table 1, Cole 2015), there are other concerns. Meta-analysis, which are done by collecting information from multiple studies, would benefit if more and not fewer numbers are reported, for the very same reason that we don’t round during calculations.
Questions
- Calculate the correct 90% and 99% confidence intervals for the dart data using the t-distribution
- by hand
- by one alternative method in R, demonstrated with examples in this page
- How many significant figures should be used for the volumetric pipettor p1000? The p200? The p20 (data at end of this page)?
- Another function,
round(), can be used. Try
round(CI(darts),2)
-
- and report the results: vary the significant figures from 1 to 10 (
signif()will take digits up to 22). - See any output differences between
signif()andround()? Don’t forget to take advantage of R help pages (eg, enter?roundat the R prompt) and see Wikipedia.
- and report the results: vary the significant figures from 1 to 10 (
- Compare rounding by
signif()andround()for the number 0.12345. Can you tell which rounding method the two functions use? - Calculate the coefficient of variation (CV) for each of the three volumetric pipettors from the data at end of this page. Rank the CV from smallest to largest. Which pipettor had the smallest CV and would therefore be judged the most precise?
- (data provided at end of this page, click here).
- Standards distinguish between within run precision and between run precision of a measurement instrument (see Chapter 16.5 – Instrument reliability and validity). The data in Table 1 were all recorded within 15 minutes by one operator. What kind pf precision was measured?
- Calculate the standard error of the means for each of the three pipettors from the data
- (data provided at end of this page, click here).
- Calculate the approximate confidence interval using the 2SE rule and judge which of the three pipettors is the most accurate (narrowest confidence interval)
- Repeat, but this time apply your preferred R method for obtaining confidence intervals.
- Compare approximate and R method confidence intervals. How well did the approximate method work?
- Return to the dart example, but now assume the p-value was p = 0.003 and again for p = 0.0003. Estimate the 95% confidence interval for each case; the difference remains 4.32. How does the change in p-value, from 0.03 to 0.0003 — a two orders of magnitude difference — affect the estimates for the confidence interval (hint: describe the width of the CI)?
Quiz Chapter 3.5
Statistics of error
Data sets
Pipette calibration
| p1000 | p200 | p100 |
|---|---|---|
| 0.113 | 0.1 | 0.101 |
| 0.114 | 0.1 | 0.1 |
| 0.113 | 0.1 | 0.1 |
| 0.115 | 0.099 | 0.101 |
| 0.113 | 0.1 | 0.101 |
| 0.112 | 0.1 | 0.1 |
| 0.113 | 0.1 | 0.1 |
| 0.111 | 0.1 | 0.1 |
| 0.114 | 0.101 | 0.101 |
| 0.112 | 0.1 | 0.1 |
Chapter 3 continues
8.2 – The controversy over proper hypothesis testing
Introduction
Over the next several chapters we will introduce and develop an approach to statistical inference, which has been given the title “Null Hypothesis Significance Testing” or NHST.
In outline, NHST proceeds with
- statements of two hypotheses, a null hypothesis, HO, and an alternative hypothesis, HA
- calculate a test statistic comparison of the null hypothesis (assuming some characteristic of data).
- The value of the test statistic is to be compared to a critical value for the test, identified for the assumed probability distribution at associated degrees of freedom for the statistical function, and assigned Type I error rate.
We will expand on these statements later in this chapter, so stay with me here. Basically, the null hypothesis is often a statement like the responses of subjects from the treatment and control groups are the same, eg, no treatment effect. Note that the alternative hypothesis, eg, hypertensive patients receiving hydalazine for six weeks have lower systolic blood pressure than patients receiving a placebo (Campbell et al 2011), would be the scientific hypothesis we are most interested in. But in the Frequentist NHST approach we test the null hypothesis, not the alternative hypothesis. This framework over proper hypothesis testing is the basis of the Bayesian vs Frequentist controversy.
Consider the independent sample t-test (see Chapter 8.5 and 8.6), our first example of a parametric test.

After plugging in the sample means and the standard error for the difference between the means, we calculate t, the test statistic of the t-test. The critical value is treated as a cut-off value in the NHST approach. We have to set our Type I error rate before we start the experiment, and we have available the degrees of freedom for the test, which follows from the sample size. With these in hand, the critical value is found by looking in the t-table of probabilities (or better, use R).
For example, what is the critical value of t-test with 10 degrees of freedom and Type I error of 5%?
In Rcmdr, choose Distributions → Continuous distributions → t distribution → t quantiles… (Fig 1).
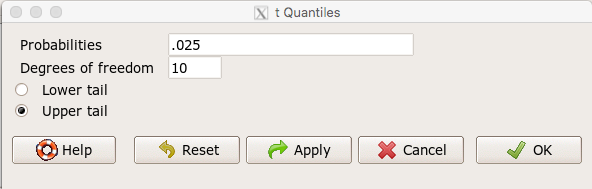
Figure 1. Screenshot t-quantiles Rcmdr menu.
Note we want Type I equal to 5%. Since there are two tails for our test, we divide 5% by two and enter 0.025 and select the Upper tail.
R output
> qt(c(.025), df=10, lower.tail=FALSE)
[1] 2.228139
which is the same thing we would get if we look up on the t-distribution table (Fig 2).
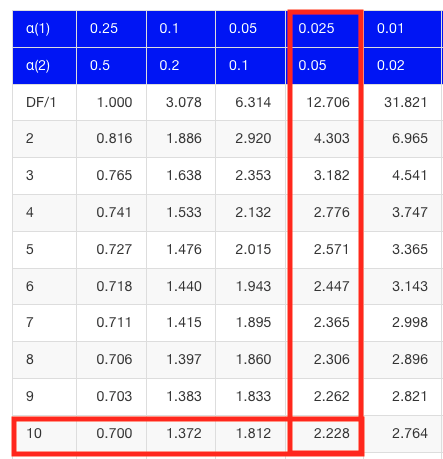
Figure 2. Screenshot of portion of t-table with highlighted (red) critical value for 10 degrees of freedom.
If the test statistic is greater than the critical value, then the conclusion is that the null hypothesis is to be provisionally rejected. We would like to conclude that the alternative hypothesis should favored as best description of the results. However, we cannot — the p-value simply tells us how likely our results would be obtained and if the null hypothesis was true. Confusingly, however, you cannot interpret the p-value as telling you the probability (how likely) that the null hypothesis is true. If however the test statistic is less than the critical value, then the conclusion is that the null hypothesis is to be provisionally accepted.
The test statistic can be assigned a probability or p-value. This p-value is judged to be large or small relative to an a priori error probability level cut off called the Type I error rate. Thus, NHST as presented in this way may be thought of as a decision path — if the test statistic is greater than the critical value, which will necessarily mean that the p value is less than the Type I error rate, then we make one type of conclusion (reject HO). In contrast, if the test statistic is less than the critical value, which will mean that the p-value associated with the test statistic will be greater than the Type I error rate, then we conclude something else about the null hypothesis. The various terms used in this description of NHST were defined in Chapter 8.3.
Sounds confusing, but, you say, OK, what exactly is the controversy? The controversy has to do whether the probability or p-value can be interpreted as evidence for a hypothesis. In one sense, the smaller the p-value, the stronger the case to reject the null hypothesis, right? However, just because the p-value is small — the event is rare — how much evidence do we have that the null hypothesis is true? Not necessarily, and so we can only conclude that the p-value is one part of what we may need for evidence for or against a hypothesis (hint: part of the solution is to consider effect size — introduced in Chapter 9.2 — and the statistical power of the test, see Ch 11). What follows was covered by Goodman (1988) and others. Here’s the problem. Consider tossing a fair coin ten times, with the resulting trial yielding nine out of ten heads (eg, a value of one, with tails equal to zero).
R code
set.seed(938291156)
rbinom(10,1,0.5)
[1] 1 1 1 1 1 1 0 1 1 1
Note 1: To get this result I repeated rbinom() a few times until I saw this rare result. I then used the command get_seed() from mlr3misc package to retrieve current seed of R’s random number generator. Initialize the random seed with the command set.seed().
While rare (binomial probability 0.0098), do we take this as evidence that the coin is not fair? By itself, the p-value provides no information about the alternative hypothesis. More about p-value follows below in sections What’s wrong with the p-value from NHST? and The real meaning and interpretation of P-values.
Statisticians have been aware of limitations of the NHST approach for years (see editorial by Wasserstein et al 2019), but only now is the message getting attention of researchers in the biosciences and other fields. In fact, the New York Times recently had a nice piece by F.D. Flam (“The Odds, Continually Updated,” 29 Sep 2014) on the controversy and the Bayesian alternative. Like most controversies there are strong voices on either side, and it can be difficult as an outsider to know which position to side with (Fig 3).
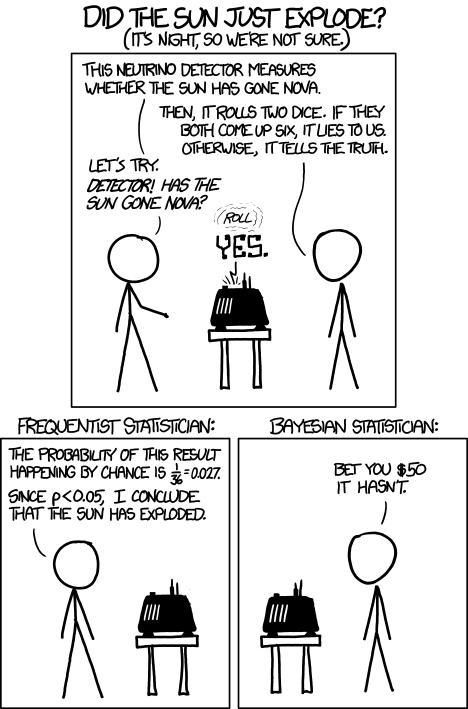
Figure 3. “Frequentists vs. Bayesians,” https://xkcd.com/1132/.
The short answer is — as you go forward do realize that there is a limitation to the frequentist approach and to be on the correct side of the controversy, you need to understand what you can conclude from statistical results. NHST is by far the most commonly used approached in biosciences (eg, out of 49 research articles I checked from four randomly selected issues of 2015 PLoS Biology, 43 used NHST, 2 used a likelihood approach, none used Bayesian statistics). The NHST is also the overwhelming manner in which we teach introductory statistics courses (eg, checking out the various MOOC courses at www.coursera.org, all of the courses related to Basic Statistics or Inferential Statistics are taught primarily from the NHST perspective). However, right from the start I want to emphasize the limits of the NHST approach.
If the purpose of science is to increase knowledge, then the NHST approach by itself is an inadequate framework at best, and in the eyes of some, worthless! Now, I think this latter sentiment is way over the top, but there is a need for us to stop before we begin, in effect, to set the ground rules for what can be interpreted from the NHST approach. The critics of NHST have a very important point, and that needs to be emphasized, but we will also defend use and teaching of this approach so that you are not left with the feeling that somehow this is a waste of time or that you are being cheated from learning the latest knowledge on the subject of statistical inference. The controversy hinges on what probability means.
P-values, statistical power, and replicability of research findings
Science, as a way of knowing how the world works, is the only approach that humans have developed that has been empirically demonstrated to work. Note how I narrowed what science is good for — if we are asking questions about the material world, then science should be your toolkit. Some (eg, Platt 1964), may further argue that there are disciplines in science that have been more successful (eg, molecular biology) than others (eg, evolutionary psychology, cf discussion in Ryle 2006) at advancing our knowledge about the material world. However, to the extent research findings are based solely on statistical results there is reason to believe that many studies in fact have not recovered truth (Ioannidis 2005).
In a review of genomics, it was reported that findings of gene expression differences by many microarray studies were not reproducible (Allison et al 2006). The consensus is that confidence in the findings should hold only for the most abundant gene transcripts of many microarray gene expression profiling studies, a conclusion that undercuts the perceived power of the technology to discover new causes of disease and the basis for individual differences for complex phenotypes. Note that when we write about failure of research reproducibility we are not including cases of alleged fraud (Carlson 2012 on Duke University oncogenomics case), we are instead highlighting that these kinds of studies often lack statistical power; hence, when repeated, the experiments yield different results.
Frequentist and Bayesian Probabilities
Turns out there is a lot of philosophical problems around the idea of “probability,” and three schools of thought. In the Fisherian approach to testing, the researcher devises a null hypothesis, HO, collects the data, then computes a probability (p-value) of the result or outcome of the experiment. If the p-value is small, then this is inferred as little evidence in support of the null hypothesis.
In the Frequentists’ approach, the one we are calling NHST, the researcher devises two hypotheses, the null hypothesis, HO, and an alternative hypothesis, HA. The results are collected from the experiment and, prior to testing, a Type I error rate (α, chance) is defined. The Type I error rate is set to some probability and refers to the chance of rejecting the null hypothesis purely due to random chance. The Frequentist then computes a p-value of result of the experiment and applies a decision criterion: If P-value greater than Type I error rate, then provisionally accept null hypothesis. In both the Fisherian and Frequentist approaches, the probability, again defined at the relative frequency of an event over time, is viewed as a physical, objective and well-defined set of values.
Bayesian approach: based on Bayes conditional probability, one identifies the prior (subjective) probability of an hypothesis, then, adjusts the prior probability (down or up) as new results come in. The adjusted probability is known as posterior probability and it is equal to the likelihood function for the problem. The posterior probability is related to the prior probability and this function can be summarized by the Bayes factor as evidence the evidence against the null hypothesis. And that’s what we want, a metric of our evidence for or against the null hypothesis.
Note 2: A probability distribution function (PDF) is a function of the sample data and returns how likely that particular point will occur in the sample. The distribution is given. The likelihood function approaches this from a different direction. The likelihood function takes the data set as a given and represents how likely are the different parameters for your distribution.
We can calibrate the Bayesian probability to the frequentist p-value (Selke et al 2001; Goodman 2008; Held 2010; Greenland and Poole 2012). Methods to achieve this calibration vary, but the Fagan nomogram Held (2010) proposed is a good tool for us as we go forward. We can calculate our NHST p-value, but then convert the p-value to a Bayes factor by looking at the nomogram. I mention this here not as part of your to do list, but rather as a way past the controversy: the NHST p-value can be interpreted as a Bayesian conditional probability, but they do not test the same hypothesis.
Likelihood
Before we move on there is one more concept to introduce, that of likelihood. We describe a model (an equation) we believe can generate the data we observe. By constructing different models with different parameters (hypotheses), you generate a statistic that yields a likelihood value. If the model fits the data, then the likelihood function has a small value. The basic idea then is to compare related, but different models to see which fits the data better. We will use this approach when comparing linear models when we introduce multiple regression models in Chapter 18.
What’s wrong with the p-value from NHST?
Well, really nothing is “wrong” with the p-value.
Where we tend to get into trouble with the p-value concept is when we try and interpret it. See below, Why is this important to me as a beginning student? The p-value is not evidence for a position, it is a statement about error rates. The p-value from NHST can be viewed as the culmination of a process that is intended to minimize the chance that the statistician makes an error.
In Bayesian terms, the p-value from NHST is the probability that we observe the data (eg, the differences between two sample means), assuming the null hypothesis is true. If we want to interpret the p-value in terms of evidence for a proposition, then we want the conditional error probability.
Sellke et al (2001) provided a calibration of p-values and, assuming that the prior probabilities of the null hypothesis and the alternative hypothesis are equal (that is, that each have a prior probability of 0.5), by using a formula provided by them (equation 3), we can correct our NHST p-value into a probability that can be interpreted as evidence in favor of the interpretation that the null hypothesis is true. In Bayesian terms this is called the posterior probability of the null hypothesis. The formula is

where e is Euler’s number, the base of the natural logarithm (ln), and p is the p-value from the NHST. This calibration works as long as  (Sellke et al 2001).
By convention we set the Type I error at 5% (cf Cohen 1994). How strong of evidence is a p-value near 5% against the null hypothesis being true, again, under the assumption that the prior probability of the null hypothesis being true is 50%? Using the above formula I constructed a plot of the calculated conditional error probability values against p-values (Fig 4).
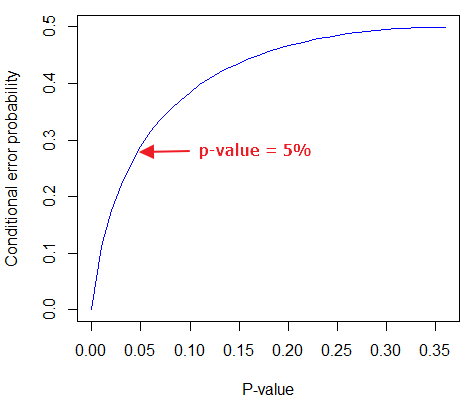
Figure 4. Conditional error probability values plotted against p-values.
As you can see, a p-value of 5% is not strong evidence at just 0.289. Not until p-values are smaller than 0.004 does the conditional error probability value dip below 0.05, suggesting strong evidence against the null hypothesis being true.
R note: For those of you keeping up with the R work, here’s the code for generating this plot. Text after “#” are comments and are not interpreted by R.
At the R prompt type each line
NHSTp = seq(0.00001,0.37,by=0.01)      #create a sequence of numbers between 0.0001 and 0.37 with a step of 0.01
CEP = (1+(-1*exp(1)*NHSTp*log(NHSTp))^-1)^-1    #equation 3 from Sellke et al 2001
plot(NHSTp,CEP,xlab="P-value", ylab="Conditional error probability",type="l",col="blue")
Why is this important to me as a beginning student?
As we go forward I will be making statements about p-values and Type I error rates and null hypotheses and even such things as false positives and false negative. We need to start to grapple with what exactly can be said by p-values in the context of statistical inference, and to recognize that we will sometimes state conclusions that cut some corners when it comes to interpreting p-values. And yet, you (and all consumers of statistics!) are expected to recognize what p-values mean. Always.
The real meaning and interpretation of P-values
This is as good of a time as any to make some clarification about the meaning of p-value and the whole inference concept. Fisher indeed came up with the concept of the p-value, but its use as a decision criterion owes to others and Fisher disagreed strongly with use of the p-value in this way (Fisher 1955; Lehmann 1993).
Here are some common p-value corner-cutting statements to avoid using (after Goodman 2008; Held 2010). P-values are sometimes interpreted, incorrectly, as
Table. Incorrect interpretations of NHST p-values
- the probability of obtaining the observed data under the assumption of no real effect
- an observed type-I error rate
- the false discovery rate, ie, the probability that a significant finding is a “false positive”
- the (posterior) probability of the null hypothesis.
So, if p-values don’t mean any of these things, what does a p-value mean? It means that we begin by assuming that there is no effect of our treatments — the p-value is then the chance we will get as large of a result (our test statistic) and the null hypothesis is true. Note that this definition does not include a statement about evidence of the null hypothesis being true. To get evidence of “truth” we need additional tools, like the Bayes Factor and the correction of the p-value to the conditional error probability (see above). Why not dump all of the NHST and go directly to a Bayesian perspective, as some advise? The single best explanation was embedded in the assumption we made about the prior probability in order to calculate the conditional error probability. We assumed the prior probability was 50%. For many, many experiments, that is simply a guess. The truth is we generally don’t know what the prior probability is. Thus, if this assumption is incorrect, then the justification for the formula by Sellke et al (2001) is weakened, and we are no closer to establishing evidence than before.
The take home message is that it is unlikely that a single experiment will provide strong evidence for the truth. Thus the message is repeat your experiments — and you already knew that! And the Bayesians can tell us that with the addition of more and more data reduces the effect of the particular value of the prior probability on our calculation of the conditional error probability. So, that’s the key to this controversy over the p-value.
Reporting p-values
Estimated p-values can never be zero. Students may come to use software that may return p-values like “0” — I’m looking at you Google Sheets re: default results from CHISQ.TEST() — but again, this does not mean the probability of the result is zero. The software simply reports values to two significant figures and failed to round. Some journals may recommend that 0 should be replaced by p < 0.01 or even < 0.05 inequalities, but the former lacks precision and the latter over-emphasizes the 5% Type I error rate threshold, the “statistical significance” of the result. In general, report p-value to three significant figures and four digits. If a p-value is small, use scientific notation and maintain significant digits. Thus, a p-value of 0.004955794 should be reported as 0.00496 and a p-value of 0.0679 should be reported as 0.0679. Use R’s signif() function, for example p-value reported as 6.334e-05, then
signif(6.334e-05,3)
[1] 6.33e-05
Rounding and significant figures were discussed in Chapter 3.5. See Land and Altman (2015) for guidelines on reporting p-values and other statistical results.
Questions
- Revisit Figure 1 again and consider the following hypothesis — the sun will rise tomorrow.
- If we take the Frequentist position, what would the null hypothesis be?
- If we take the Bayesian approach, identify the prior probability.
- Which approach, Bayesian or Frequentist, is a better approach for testing this hypothesis?
- Consider the pediatrician who, upon receiving a chest X-ray for a child notes the left lung has a large irregular opaque area in the lower quadrant. Based on the X-ray and other patient symptoms, the doctor diagnoses pneumonia and prescribes a broad-spectrum antibiotic. Is the doctor behaving as a Frequentist or a Bayesian?
- With the p-value interpretations listed in the table above in hand, select an article from PLoS Biology, or any of your other favorite research journals, and read how the authors report results of significance testing. Compare the precise wording in the results section against the interpretative phrasing in the discussion section. Do the authors fall into any of the p-value corner-cutting traps?
Quiz Chapter 8.2
The controversy over proper hypothesis testing
Chapter 8 contents
- Introduction
- The null and alternative hypotheses
- The controversy over proper hypothesis testing<.span>
- Sampling distribution and hypothesis testing
- Tails of a test
- One sample t-test
- Confidence limits for the estimate of population mean
- References and suggested readings