14.7 – Rcmdr Multiway ANOVA
Introduction
We have been talking about the two-way randomized, balanced, replicated design. Here, we take you step by step through use of R to conduct the multiway ANOVA.
R code: Multiway ANOVA
Rcmdr: Statistics → Means → Multiway ANOVA… we will review this as Option 1
or
Rcmdr: Statistics → Fit Models → Linear model… we will review this as Option 2
In either case, as a reminder, your data set must be stacked worksheet, like the data in this worksheet
Table 1. Data set, example.14.7†
| Diet | Population | Response |
| A | 1 | 4 |
| A | 1 | 6 |
| A | 1 | 5 |
| A | 2 | 5 |
| A | 2 | 8 |
| A | 2 | 9 |
| B | 1 | 12 |
| B | 1 | 15 |
| B | 1 | 11 |
| B | 2 | 5 |
| B | 2 | 7 |
| B | 2 | 8 |
Option 1
Your first option is to use the ANOVA menus via “Means.” This is a perfectly good way to handle a standard two-way, fully-crossed, fixed effects model. However, other designs will not run with this command and R will return a report of errors for ANOVA models that do not conform to the replicated, balanced, crossed design.
Rcmdr: Statistics → Means → Multiway Analysis of variance …
Factors: highlight “Diet” AND “Population”
Response variable: pick one (in this window, all we see is “Response”)
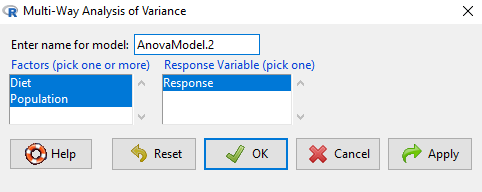
Figure 1. Screenshot Rcmdr multi-way ANOVA.
†Note 1: Don’t forget to convert numeric Population to factor. Assuming Population is part of a data.frame called example.14.7, then example.14.7$Population <- factor(example.14.7$Population).
Interpret the output
AnovaModel.2 <- (lm(Response ~ Diet*Population, data=example.14.7))

Anova(AnovaModel.2)

Anova Table (Type II tests)
Response: Response
                  Sum Sq    Df    F value      Pr(>F)
Diet              36.750     1    12.2500    0.008079 **
Population        10.083     1     3.3611    0.104104
Diet:Population   52.083     1    17.3611    0.003136 **
Residuals         24.000     8
---
Signif. codes: 0 '***' 0.001 '**' 0.01 '*' 0.05 '.' 0.1 ' ' 1
tapply(example.14.7 Response, list(Diet=example.14.7 Diet,
+ Population=example.14.7 Population), mean, na.rm=TRUE) # means
Population
Diet 1 2
A 5.00000 7.333333
B 12.66667 6.666667

tapply(example.14.7 Response, list(Diet=example.14.7 Diet,
+ Population=example.14.7 Population), sd, na.rm=TRUE) # std. deviations
Population
Diet 1 2
A 1.000000 2.081666
B 2.081666 1.527525

tapply(example.14.7 Response, list(Diet=example.14.71 Diet,
+ Population=example.14.7 Population), function(x) sum(!is.na(x))) # counts
Population
Diet 1 2
A 3 3
B 3 3
End R output.
Note 2: What is the “Type II tests”? When you fit a model with categorical predictors using lm() or aov(), you test hypothesis for each effect (main effects and interactions). These tests differ depending on how the model partitions the variance among predictors. See Note 2 in Chapter 12.7 for description of Type I, Type II, and Type III sums of squares.
Summary of multi-way ANOVA command
The multi-way ANOVA command returns our ANOVA table plus the adjusted means, along with standard deviations and number of observations (counts). The adjusted means would then be good to put into a chart to present group comparisons following adjustments from the effects of levels within groups.
Rcmdr: Models → Graphs → Predictor effect plots …
Here’s the chart (hint: 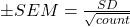 )
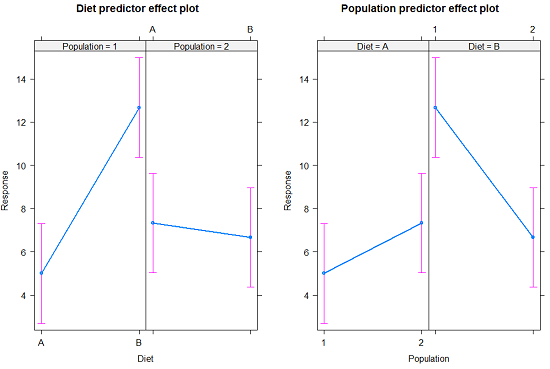
Figure 2. Predictor effect plots, Diet and Population on Response variable.
Option 2
A more general approach is to use the General linear model. This approach can handle the standard 2-way fixed effects ANOVA (above), but any other model as well. The model is Response ~ Diet*Population.
Rcmdr: Statistics → Fit Models → Linear model…
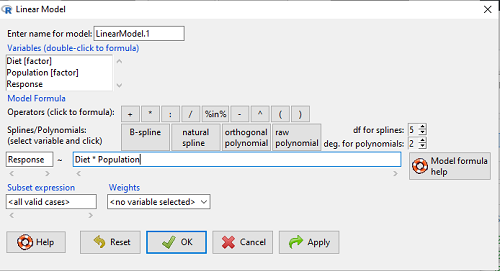
Figure 3. Screenshot Rcmdr linear model menu.
Interpret the output
LinearModel.1 <- lm(Response ~ Diet * Population, data=example.14.7)

summary(LinearModel.1)

Call:
lm(formula = Response ~ Diet * Population, data = example.14.7)

Residuals:
Min 1Q Median 3Q Max
-2.3333 -1.1667 0.1667 1.0833 2.3333

Coefficients:
                        Estimate    Std. Error ..t value .  Pr(>|t|)
(Intercept) .              5.000         1.000 .   5.000    .0.00105 **
Diet[T.B] .                7.667       ..1.414 .   5.421    .0.00063 ***
Population[T.2]           .2.333       ..1.414 .   1.650    .0.13757
Diet[T.B]:Population[T.2] -8.333       ..2.000    -4.167    .0.00314 **
---
Signif. codes: 0 '***' 0.001 '**' 0.01 '*' 0.05 '.' 0.1 ' ' 1

Residual standard error: 1.732 on 8 degrees of freedom
Multiple R-squared: 0.8047, Adjusted R-squared: 0.7315
F-statistic: 10.99 on 3 and 8 DF, p-value: 0.003285
End R output
Lots to sort through, so let’s begin with what is in common between the two approaches, the Multi-way ANOVA command versus the linear model command.
Compare R output from ANOVA and linear model
As a direct output, the linear model option does not provide an ANOVA summary table. Instead of our ANOVA table the linear model returns estimates of coefficients along with t-test results for each coefficient of the model from the lm() command output
Recall that we can get ANOVA tables through the following R commands via Rcmdr.
Rcmdr: Models → Hypothesis tests → ANOVA Table.
Let’s do so for this linear model (accept the default for type of tests = “Type II”).
And the output from lm() stored in the object LinearModel.1 is
Anova(LinearModel.1, type="II")
Anova Table (Type II tests)

Response: Response
                Sum Sq Df F value   Pr(>F)
Diet            36.750  1 12.2500 0.008079 **
Population      10.083  1  3.3611 0.104104
Diet:Population 52.083  1 17.3611 0.003136 **
Residuals       24.000  8
---
Signif. codes:  0 '***' 0.001 '**' 0.01 '*' 0.05 '.' 0.1 ' ' 1
End R output
Now, we’re in business, and, using the lm() function, we have the estimates for each model coefficient plus our ANOVA table.
Same answer! Of course. Which to choose, Option 1 or Option 2? Use the lm() options; more flexible, covers more designs than the multiway ANOVA which is strictly for the crossed fully replicated design.
Note 3: Rcmdr uses Anova(), not anova(). anova() is a generic function, part of the base statistics package, and it returns an ANOVA table. Anova() is not a wrapper to anova(), it is a different function, part of the car package. It uses different default methods and different types of sums of squares: Type-II or Type-III analysis-of-variance tables for model objects produced by lm(), glm(), etc. See Note 2 in Chapter 12.7 for description of Type I, Type II, and Type III sums of squares.
Questions
- Write out the two-way model described for the data in Table 1.
- Write the null hypotheses and provide a summary of the statistical significance of the model.
Quiz Chapter 14.7
Rcmdr Multiway ANOVA
Chapter 14 contents
14.4 – Randomized block design
Introduction
Randomized Block Designs and Two-Factor ANOVA
In previous lectures, we have introduced you to the standard factorial ANOVA, which may be characterized as being crossed, balanced, and replicated. We expect additional factors (covariates) may contribute to differences among our experimental units, but rather than testing them — which would increase need for additional experimental units because of increased number of groups to test — we randomize our subjects. Randomization is intended to disrupt trends of confounding variables (aka covariates). If the resulting experiment has missing values (see Chapter 5), then we can say that the design is partially replicated; if only one observation is made per group, then the design is not replicated — and perhaps, not very useful!!
A special type of Two-factor ANOVA which includes a “blocking” factor and a treatment factor.
Randomization is one way to control for “uninteresting” confounding factors. Clearly, there will be scenarios in which randomization is impossible. For example, it is impossible to randomly assign subjects to The blocking factor is similar to the 10.3 – Paired t-test. In the paired t-test we had two individuals or groups that we paired (eg, twins). One specific design is called the Randomized Block Design and we can have more than 2 members in the group. We arrange the experimental units into similar groups, ie, the blocking factor. Examples of blocking factors may include day (experiments are run over different days), location (experiments may be run at different locations in the laboratory), nucleic acid kits (different vendors), operator (different assistants may work on the experiments), etcetera.
In general we may not be directly interested in the blocking factor. This blocking factor is used to control some factor(s) that we suspect might affect the response variable. Importantly, this has the effect of reducing the sums of squares by an amount equal to the sums of squares for the block. If variability removed by the blocking is significant, Mean Square Error (MSE) will be smaller, meaning that the F for treatment will be bigger — meaning we have a more powerful ANOVA than if we had ignored the blocking.
Statistical Testing in Randomized Block Designs
“Blocks” is a Random Factor because we are “sampling” a few blocks out of a larger possible number of blocks. Treatment is a Fixed Factor, usually.
The statistical model is

The Sources of Variation are simpler than the more typical Two-Factor ANOVA because we do not calculate all the sources of variation – the interaction is not tested! (Table 1).
Table 1. Sources of variation for a two-way ANOVA, randomized block design
|
Sources of Variation & Sum of Squares
|
DF
|
Mean Squares
|
 |
 |
 |
 |
 |
 |
 |
 |
 |
 |
 |
 |
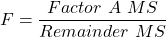
Critical Value F0.05(2), (a – 1), (Total DF – a – b)
In the exercise example above: Factor A = exercise or management plan.
Notice that we do not look at the interaction MS or the Blocking Factor (typically).
Learn by doing
Rather than me telling you, try on your own. We’ll begin with a worked example, then proceed to introduce you to three problems. Click here (Ch 14.8)for general discussion of Rcmdr and linear models for models other than the standard 2-way ANOVA (Chapter 14.8).
Worked example
Wheel running by mice is a standard measure of activity behavior. Even wild mice will use wheels (Meijer and Roberts 2014). For example, we conduct a study of family parity to see if offspring from the first, second, or third sets of births from wheel-running behavior in mice (total revs per 24 hr period). Each set of offspring from a female could be treated as a block. Data are for 3 female offspring from each pairing. This type of data set would look like this:
Table 2. Wheel running behavior by three offspring from each of three birth cohorts among four maternal sets (moms).
|
Revolutions of wheel per 24-hr period
|
||||
|
Block
|
Dam 1
|
Dam 2
|
Dam 3
|
Dam 4
|
|
b1
|
1100
|
1566
|
945
|
450
|
|
b1
|
1245
|
1478
|
877
|
501
|
|
b1
|
1115
|
1502
|
892
|
394
|
|
b2
|
999
|
451
|
644
|
605
|
|
b2
|
899
|
405
|
650
|
612
|
|
b2
|
745
|
344
|
605
|
700
|
|
b3
|
1245
|
702
|
1712
|
790
|
|
b3
|
1300
|
612
|
1745
|
850
|
|
b3
|
1750
|
508
|
1680
|
910
|
Thus, there were nine offspring for each female mouse (Dam1 – Dam4), three offspring per each of three litters of pups. The litters are the blocks. We need to get the data stacked to run in R. I’ve provided the full dataset for readers, scroll to end of this page or click here.
Question 1. Describe the problem and identify the treatment and blocking factors.
Answer. Each female has three litters. We’re primarily interested in genetics (and maternal environment) of wheel running behavior, which is associated with the moms (Treatment factor). The questions is whether there is an effect of birth parity on wheel running behavior. Offspring of a first-time mother may experience different environment than offspring of experienced mother. In this case, parity effects is an interesting question, nevertheless, blocking is the appropriate way to handle this type of problem.
Question 2. What is the statistical model?
Answer. Response variable, Y, is wheel running. Let α the effect of Dam and β the birth cohorts (ie, the blocking effect).
Question 3. Test the model.
Answer. We fit the main effects, Dam and Block Fig 1.

Rcmdr: Statistics → Fit models → Linear model
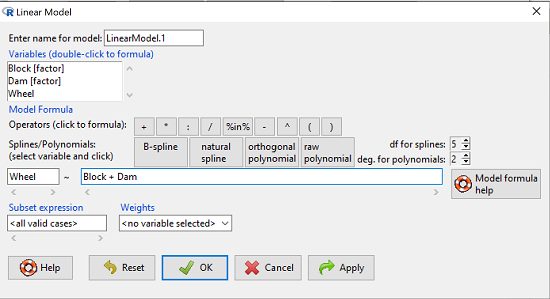
Figure 1. Screenshot Rcmdr Linear Model menu.
then run the ANOVA summary to get the ANOVA table. Rcmdr: Models → Hypothesis tests → ANOVA table.
R Output
Anova Table (Type II tests)

Response: Wheel
           Sum Sq  Df  F value    Pr(>F)
Dam       1467020   3   4.4732   0.01036 *
Block     1672166   2   7.6482   0.00207 **
Residuals 3279544  30
Question 4. Conclusions?
Answer 4. The null hypotheses are:
Treatment factor: Offspring of the different dams have same wheel running activity of offspring.
Blocking factor: No effect of litter parity on wheel running activity of offspring.
Both the treatment factor (p = 0.01036) and the blocking factor (p = 0.00207) were statistically significant.
Questions
Problem 1.
Or we might want to measure the Systolic Blood Pressure of individuals that are on different exercise regimens. However, we are not able to measure all the individuals on the same day at the same time. We suspect that time of day and the day of the year might effect an individuals blood pressure. Given this constraint, the best research design in this circumstance is to measure one individual on each exercise regime at the same time. These different individuals will then be in the same “block” because they share in common the time that their blood pressure was measured. This type of data set would look like this (Table 2):
Table 2. Simulated blood pressure of five subjects on three different exercise regimens.†
|
Subject
|
No
Exercise |
Moderate Exercise
|
Intense Exercise
|
|
1
|
120
|
115
|
114
|
|
2
|
135
|
130
|
131
|
|
3
|
115
|
110
|
109
|
|
4
|
112
|
107
|
106
|
|
5
|
108
|
103
|
102
|
Let’s make a line graph to help us visualize trends (Fig 2).
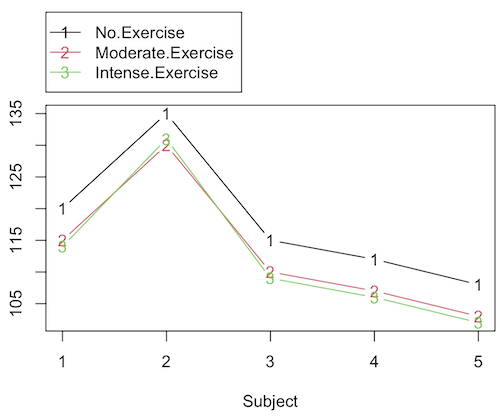
Figure 2. Line graph of data presented in Table 2.
Question 1. Describe the problem and identify the treatment and blocking factors.
Question 2. What is the statistical model?
Question 3. Test the model.
Question 4. Conclusions?
†You’ll need to arrange the data like the data set for the worked example.
Problem 2.
Another example in conservation biology or agriculture. There may be three different management strategies for promoting the recovery of a plant species. A good research design would be to choose many plots of land (blocks) and perform each treatment (management strategy) on a portion of each plot of land (block). A researcher would start with an equal number of plantings in the plots and see how many grew. The plots of land (blocks) share in common many other aspects of that particular plot of land that may effect the recovery of a species.
Table 3. Growth of plants in 5 different plots subjected to one of three management plans (simulated data set).†
|
Plot No.
|
No Management Used
|
Management
Plan 1 |
Management
Plan 2 |
|
1
|
0
|
11
|
14
|
|
2
|
2
|
13
|
15
|
|
3
|
3
|
11
|
19
|
|
4
|
4
|
10
|
16
|
|
5
|
5
|
15
|
12
|
†You’ll need to arrange the data the same arrangement as for the worked example.
These are examples of Two-Factor ANOVA but we are usually only interested in the treatment Factor. We recognize that the blocking factor may contribute to differences among groups and so wish to control for the fact that we carried out the experiments at different times (eg, seasons) or at different locations (eg, agriculture plots)
Question 5. Describe the problem and identify the treatment and blocking factors. Make a line graph to help visualize.
Question 6. What is the statistical model?
Question 7. Test the model.
Question 8. Conclusions?
Repeated-Measures Experimental Design
If multiple measures are taken on the same individual, then we have a repeated-measures experiment. This is a Randomized Block Design. In other words, each animal gets all levels of a treatment (assigned randomly). Thus, samples (individuals) are not independent and the analysis needs to take this into account. Just like for paired-T tests, one can imagine a number of experiments in biomedicine that would conform to this design.
Problem 3.
The data are total blood cholesterol levels for 7 individuals given 3 different drugs (from example given in Zar 1999, Ex 12.5, pp. 257-258).
Table 5. Repeated measures of blood cholesterol levels of seven subjects on three different drug regimens.†
|
Subjects
|
Drug1
|
Drug2
|
Drug3
|
|
1
|
164
|
152
|
178
|
|
2
|
202
|
181
|
222
|
|
3
|
143
|
136
|
132
|
|
4
|
210
|
194
|
216
|
|
5
|
228
|
219
|
245
|
|
6
|
173
|
159
|
182
|
|
7
|
161
|
157
|
165
|
†You’ll need to arrange the data like the data set for the worked example.
Question 9: Is there an interaction term in this design? Make a line graph to help visualize.
Question 10: Are individuals a fixed or a random effect?
Question 11. What is the statistical model?
Question 12. Test the model. Note that we could have done the experiment with 21 randomly selected subjects and a one-factor ANOVA. However, the repeated measures design is best IF there is some association (“correlation”) between the data in each row. The computations are identical to the randomized block analysis.
Question 13. Conclusions?
Problem 4.
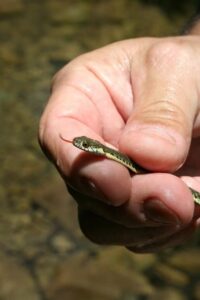
Figure 3. Juvenile garter snake, image from juvenile garter snake in hand, public domain.
Here is a second example of a repeated measures design experiment. Garter snakes (Fig 3) respond to odor cues to find prey. Snakes use their tongues to “taste” the air for chemicals, and flick their tongues rapidly when in contact with suitable prey items, less frequently for items not suitable for prey. In the laboratory, researchers can test how individual snakes respond to different chemical cues by presenting each snake with a swab containing a particular chemical. The researcher then counts how many times the snake flicks its tongue in a certain time period (data presented p. 301, Glover and Mitchell 2016).
Table 6. Tongue flick counts of naïve newborn snakes to extracts†
|
Snake
|
Control (dH2O)
|
Fish mucus
|
Worm mucus
|
|
1
|
3
|
6
|
6
|
|
2
|
0
|
22
|
22
|
|
3
|
0
|
12
|
12
|
|
4
|
5
|
24
|
24
|
|
5
|
1
|
16
|
16
|
|
6
|
2
|
16
|
16
|
†You’ll need to arrange the data like the data set for the worked example.
Question 14. Describe the problem and identify the treatment and blocking factors. Make a line graph to help visualize.
Question 15. What is the statistical model?
Question 16. Test the model.
Question 17. Conclusions?
Quiz Chapter 14.4
Randomized block design
Data sets used in this page
Problem 1 data set
| Block | Dam | Wheel |
|---|---|---|
| B1 | D1 | 1100 |
| B1 | D2 | 1566 |
| B1 | D3 | 945 |
| B1 | D4 | 450 |
| B1 | D1 | 1245 |
| B1 | D2 | 1478 |
| B1 | D3 | 877 |
| B1 | D4 | 501 |
| B1 | D1 | 1115 |
| B1 | D2 | 1502 |
| B1 | D3 | 892 |
| B1 | D4 | 394 |
| B2 | D1 | 999 |
| B2 | D2 | 451 |
| B2 | D3 | 644 |
| B2 | D4 | 605 |
| B2 | D1 | 899 |
| B2 | D2 | 405 |
| B2 | D3 | 650 |
| B2 | D4 | 612 |
| B2 | D1 | 745 |
| B2 | D2 | 344 |
| B2 | D3 | 605 |
| B2 | D4 | 700 |
| B3 | D1 | 1245 |
| B3 | D2 | 702 |
| B3 | D3 | 1712 |
| B3 | D4 | 790 |
| B3 | D1 | 1300 |
| B3 | D2 | 612 |
| B3 | D3 | 1745 |
| B3 | D4 | 850 |
| B3 | D1 | 1750 |
| B3 | D2 | 508 |
| B3 | D3 | 1680 |
| B3 | D4 | 910 |