20.15 — Meta-analysis
Introduction
Meta-analysis is a type of systematic review (Greenhalgh 1997, Akobeng 2005), a statistical method used to combine the results from multiple independent studies that addressed the same topic. By combining studies, the goal is to calculate a pooled estimate as a measure of overall effectiveness of the treatment. The underlying logic is that multiple studies draw subjects from the same reference population, thus, combining data provides a more powerful test of the hypothesis.
Meta-analysis can increase the overall sample size, which improves the study’s ability to detect an effect if one exists. So, how to combine results from different studies ostensibly addressing the same hypothesis? Inevitably, some subjectivity will come into decisions about including or excluding studies — the goal is to identify quality studies, which may have conflicting conclusions and test whether a single conclusion of effectiveness is warranted based on a summary of evidence.
Meta-analysis is now a routine type of study, conducted in multiple disciplines, including biomedical field (eg, Cochrane Reviews, more than 15K since 1993, Anderson et al 2024), and environmental studies (eg, Resende et al 2021), and sports science (eg, Miyamoto-Mikami et al 2018).
In general, meta-analysis studies return the combined effect size –the single, pooled effect across all included studies — of an intervention and the heterogeneity among the studies — how consistent measured differences. Models may be fixed effects — that is, any observed differences among studies are due to chance or sampling error — or random effects — the true effect size varies from study to study and that these effects are drawn from a distribution.
The purpose of this page is to provide a basic overview and an introduction to the meta-analysis approach. We previously introduced the Cochran’s Q test aka heterogeneity  test in Chapter 9.4. The chi-square test test asks whether results from combined studies are consistent. After discussing inclusion criteria, we provide plotting techniques and additional statistical tests for heterogeneity of studies.
In Chapter 12.4, we introduced a simple meta-analysis combining ten separate one sample t-tests of the hypothesis that inbred mice and genetically diverse mouse strains do not differ for average lifespan. P-values were combined and we used Fisher’s method to evaluate the hypothesis.
Note 1: The most robust and recommended method for meta-analysis is to use effect sizes (eg, standardized mean differences, odds ratios, risk ratios) and their corresponding standard errors or confidence intervals (Nakagawa and Cuthill 2007). This approach avoids the limitations of arbitrary p-value thresholds and provides a more complete picture of the effect’s magnitude and precision.
Selection criteria
Any project, whether an observational study or an experiment, starts with a question that is modified into one or more testable hypothesis. We don’t collect the data then speculate about causes for perceived patterns that may appear. Rather, pattern recognition process can be used to generate hypotheses subject to future testing. Our example was about lifespan and genetic background and genetic diversity: Longevity refers to the capacity to live a long life whereas lifespan is the maximum amount of time an individual can live. We ask if genetic diversity increases longevity across a population; specific genetic background is linked to an individual’s predisposition to long life.
Given the importance such work has in clinical research, as you can imagine, there is plenty of advice and suggested guidelines for how to proceed. Of note, review systematic review Population, Intervention, Comparison, Outcome (PICO) guidelines (Schardt et al 2007). Additionally, see the Cochrane Handbook (2024).
With a clear hypothesis in hand, for both systematic review and meta-analysis, the study begins with a search of the published literature. Search results from the query “inbred mice strain lifespan,” in Pubmed returned about 1134 publications; replacing “longevity” for “lifespan,” returned 654 publications. We want primary literature, not reviews, so we add NOT (Review[Publication Type]) to the query: 1080 and 617, respectively. Further restricting the pool by restricting range to last ten years returned a manageable 197 and 116 results, respectively. We can begin selecting our data from the studies. We now have to decide whether all or only some meet our standards for consideration. Of course, this is not the same thing as looking at the results and selecting only the studies that confirm our thinking! Ideally, reporting of both positive (large effect size, small p-value) and negative (small effect size, large p-value) studies can — and should — be included. Our goal, combine the results of multiple independent studies on the same topic to reach a more powerful and reliable conclusion than a single study could provide.
Note 2: Publication bias concerns likely overestimates of effect size for meta-analysis, just as the tendency for reporting only “statistically significant” p-values (Ioannidis 2008).
Inclusion criteria are the requirements a study must meet to be considered for the review; exclusion criteria are the specific reasons a study is disqualified. Decisions about which studies to include consider demographics, intervention type, and study design. For example, the review may focus only on RCT studies. Likely, the review is focused on experimental work and so, excluding previous systematic reviews would be an example of an exclusion criteria. At the same time we need to be transparent about our approach; that includes defining a clear research question, establishing strict inclusion/exclusion criteria, conducting a comprehensive literature search across multiple databases, and performing a rigorous data extraction and quality assessment of included studies (Meline 2006, Paldam 2015, Cochrane Handbook). For our lifespan and genetic diversity example I found two studies that met my criteria: the studies needed multiple inbred strains or outbred strains and the raw data needed to be available. Two studies met this need: Yuan et al (2009) and Mullis et al (2025).
An imperfect example. To practice applying selection and exclusion criteria for a meta-analysis, I ran a PubMed search using the keywords botox migraine. I limited the results to clinical trials published within the past five years, which gave me 14 papers. I read the abstracts and decided to include studies only if they had a control group, focused on patients with chronic migraine, and reported an exact p-value instead of just saying “P < 0.05.” Table 1 shows what I found, including the PubMed link for each paper, whether it was included, the sample size, the p-value, and my comments on why any studies were excluded.
Table 1. Example data collection for meta-analysis, topic botox and treatment of chronic migraines.
| paper | Include | N | p-value | Why exclude? |
|---|---|---|---|---|
| https://pubmed.ncbi.nlm.nih.gov/37499085/ | No | review | ||
| https://pubmed.ncbi.nlm.nih.gov/38982666/ | Yes | 1384 | 0.01 | |
| https://pubmed.ncbi.nlm.nih.gov/37994890/ | No | 209 | 0.155 | no control group |
| https://pubmed.ncbi.nlm.nih.gov/41091731/ | No | 775 | > 0.05 | no CI, no exact p-value |
| https://pubmed.ncbi.nlm.nih.gov/34404257/ | No | 32 | 0.03 | within subjects design, no control group |
| https://pubmed.ncbi.nlm.nih.gov/37315247/ | Yes | 209 | 0.365 | |
| https://pubmed.ncbi.nlm.nih.gov/33722518/ | No | 60 | < 0.001 | within subjects design, no control group, no exact p-value |
| https://pubmed.ncbi.nlm.nih.gov/36189948/ | No | 0.092 | no sample size, no control | |
| https://pubmed.ncbi.nlm.nih.gov/36189948/ | No | 0.174 | no sample size, no control | |
| https://pubmed.ncbi.nlm.nih.gov/35166150/ | No | method paper | ||
| https://pubmed.ncbi.nlm.nih.gov/33106278/ | Yes | 15 | 0.038 | |
| https://pubmed.ncbi.nlm.nih.gov/37235358/ | No | 139 | < 0.0001 | no CI, no exact p-value |
| https://pubmed.ncbi.nlm.nih.gov/35064733/ | No | overuse, not migraine | ||
| https://pubmed.ncbi.nlm.nih.gov/33241323/ | No | PTH, not migraine | ||
| https://pubmed.ncbi.nlm.nih.gov/32873093/ | No | no control group |
That leaves only three papers, not enough for a meta-analysis. By changing years from five to ten, 40 papers were available to search. By removing all time restrictions, 109 papers were returned since year 2000. Medical use of botox dates to the 1970s (Scott 2023).
R packages
metafor package: provides extensive functions for calculating various effect sizes, fitting different statistical models (e.g., fixed- and random-effects, mixed-effects), conducting meta-regression, and generating numerous meta-analytical plots.
See also metaforGUI package which provides a Graphical User Interface (GUI) for the R metafor Package.
meta package: provides user-friendly and comprehensive collection of functions for conducting standard meta-analyses.
Much has been written about how to conduct meta-analysis and caveat emptor — readers should be on notice that I present here just a fraction of the “how to” and pitfalls of meta-analysis. Interested readers should see Doing meta-analysis with R: A hands-on guide by M. Harrer et al (2021).
I2 or I-squared test
In a meta-analysis, the I-squared test  quantifies the percentage of total variation in a set of study results that is due to differences between studies rather than random sampling error (chance). An of 0% means all variation is due to chance, while a higher percentage indicates that differences between studies are a significant source of variation. As a reminder, the test returns a p-value that can be used to interpret whether that heterogeneity is statistically significant. We run our life span of inbred and genetically diverse outbred mouse strains example in Chapter 12.4; the p-value was small — we used Fisher’s method p-value combination approach to test the main hypothesis.
Here, we calculate ; we first need the effect size; Cohen’s d (Chapter 11.4) will do.
Table 1. Updated Table 1 from Chapter 12.4.
| Strain | n | mean | sd | cohen’s d | V(d) |
| 129S1/SvImJ | 32 | 787.4 | 159.16 | 0.045 | 0.191 |
| A/J | 32 | 630.7 | 130.20 | 1.26 | 0.04 |
| BALB/cByJ | 32 | 734.4 | 154.43 | 0.389 | 0.0368 |
| BUB/BnJ | 24 | 611.3 | 218.34 | 0.839 | 0.0485 |
| C3H/HeJ | 29 | 724.1 | 131.48 | 0.536 | 0.0403 |
| C57BL/6J | 29 | 855.7 | 185.34 | 0.330 | 0.0399 |
| CBA/J | 30 | 622.9 | 181.95 | 0.943 | 0.0405 |
| FVB/NJ | 26 | 750.3 | 230.11 | 0.192 | 0.0438 |
| P/J | 32 | 676.0 | 178.82 | 0.663 | 0.0374 |
| SWR/J | 31 | 831.9 | 181.31 | 0.206 | 0.0376 |
The effect size ranged from practically no difference (Cohen’s d of 4.5%) to substantial effect on average lifespan of inbred vs outbred strains (Cohen’s d of 126%). The simple average of the Cohen’s d values was 0.541; a weighted average accounting for differences in variance needs to be applied. Regardless, the statistic we want is the coefficient from meta-regression, which indicates how a change in that predictor relates to the effect size.
Note 3: The greatest effect size — difference in average lifespan — was reported for the A/J strain — this strain is primarily used in cancer research because of its susceptibility to cancers. The smallest effect size was for the 129S1/SvImJ strain, which is used for creating genetically modified mice.
With effect size calculated, we proceed to get . We use rma() from metafor package. This function performs several tests: a fixed-effects model and therefore we test a model where we assume all studies found the exact same effect, a random-effects model where the assumption is that effects are similar but vary across studies, plus a mixed-effects model uses a combination of both, and finally, a meta-regression. The meta-regression uses the data from those studies to try and explain why the results differ.
R code
library(metafor)
strains <- 1:10
my_effsize <- c(0.0446092, 1.258065, 0.3891731, 0.8390583,
0.5354427, 0.3302039, 0.9431162, 0.192082, 0.6626776, 0.2062765)
my_sample <- c(32, 32, 32, 24, 29, 29, 30, 26, 32, 31)
my_varC <- (my_effsize^2)/(2*my_sample)
myData <- data.frame(strains, my_effsize, my_sample, my_varC)
rma(yi = my_effsize, vi = my_varC, data = myData)
R output
Random-Effects Model (k = 10; tau^2 estimator: REML)

tau^2 (estimated amount of total heterogeneity): 0.1299 (SE = 0.0643)
tau (square root of estimated tau^2 value): 0.3604
I^2 (total heterogeneity / total variability): 99.15%
H^2 (total variability / sampling variability): 117.11

Test for Heterogeneity:
Q(df = 9) = 390.9415, p-val < .0001

Model Results:

estimate     se   zval   pval  ci.lb  ci.ub
  0.5208 0.1169 4.4558 <.0001 0.2917 0.7499 ***
---
Signif. codes: 0 ‘***’ 0.001 ‘**’ 0.01 ‘*’ 0.05 ‘.’ 0.1 ‘ ’ 1
Interpretation.
With an of 99%, which suggests a very high degree of heterogeneity among the comparison between the DO strain and the ten inbred strains for life span. As before, the heterogeneity or Q test was highly statistically significant, suggests that the observed variability is larger than what would be expected due to chance alone. Thus, all of the variability in the observed effects comes from between-strain differences, not random chance — it also justifies use of a random effects model, not a fixed model. Strain A/J, with the greatest difference in lifespan compared to the DO strain, is recognized for its susceptibility to carcinogenic tumors
From the meta regression, the coefficient was 0.52 — inbred strain membership was associated with change in the size of the effect. We conclude that in general, the genetically inbred strains differ substantially for average lifespan compared to the genetically variable DO strain: The true average effect was somewhere between 0.2917 and 0.7499.
Our results conform to our expectations — longevity is likely affected by a combination of effects from many genes along with an individual’s genetic background and interaction with the environment, cf discussion in Mullis et al (2025).
Forest plot of effect size.
A forest plot visually summarizes results from multiple studies, showing each study’s effect size (eg, odds ratio, mean difference, Cohen’s d) and variance or confidence interval as squares and lines, plus the overall pooled estimate (diamond). It helps quickly assess study consistency (heterogeneity), see individual study contributions, and determine if the combined evidence points to a significant overall effect.
For example, our inbred strains vs the outbred DO strain for lifespan shows a clear, overall effect (Fig 1). The diverse genetic strain lifespan is significantly greater than the majority of inbred strains, and the combined effect is about 0.5.
R code
library(metafor)
myData <- data.frame(
Strains = paste("Strains", c("129S1/SvImJ", "A/J", "BALB/cByJ", "BUB/BnJ",
"C3H/HeJ", "C57BL/6J", "CBA/J", "FVB/NJ", "P/J", "SWR/J")),
cohenD = c(0.045, 1.26, 0.389, 0.839, 0.536, 0.33, 0.943, 0.192, 0.663, 0.206),
cohenV = c(0.1910, 0.0400, 0.0368, 0.0485, 0.0403, 0.0399, 0.0405, 0.0438, 0.0374, 0.0376)
)

res2 <- rma(cohenD, cohenV, data = myData, method="REML")
# str(res2)

forest(res2,
slab = myData$Strains,
xlab = "Cohen's d")
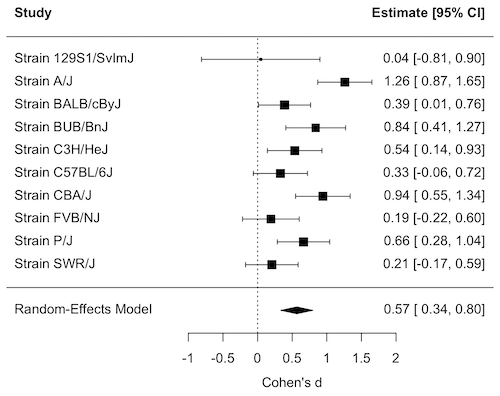
Figure 1. Forest plot, Cohen’s effect size lifespan differences among inbred strains of mice compared to outbred strain.
Questions
1. What’s the difference between a literature review and a systematic review?
2. For which kinds of research goals would a meta-analysis be more appropriate than a systematic review?
Quiz Chapter 20.15
Meta-analysis
References and suggested readings
Akobeng, A. K. (2005). Understanding systematic reviews and meta-analysis. Arch Dis Child, 90:845-848.
Andersen, M. Z., Zeinert, P., Rosenberg, J., & Fonnes, S. (2024). Comparative analysis of Cochrane and non-Cochrane reviews over three decades. Systematic Reviews, 13, 120.
Cochrane reviews, Cochrane Library. (2025). https://www.cochranelibrary.com/
Greenhalgh, T. (1997). How to read a paper: Papers that summarise other papers (systematic reviews and meta-analyses). BMJ, 315(7109), 672–675.
Gurevitch, J., Koricheva, J., Nakagawa, S., & Stewart, G. (2018). Meta-analysis and the science of research synthesis. Nature, 555(7695), 175–182.
Hansen, C., Steinmetz, H., & Block, J. (2022). How to conduct a meta-analysis in eight steps: A practical guide. Management Review Quarterly, 72(1), 1–19.
Harrer, M., Cuijpers, P., Furukawa, T.A., & Ebert, D.D. (2021). Doing Meta-Analysis with R: A Hands-On Guide. Boca Raton, FL and London: Chapman & Hall/CRC Press. Link to website.
Ioannidis, J. P. A. (2008). Why Most Discovered True Associations Are Inflated. Epidemiology, 19(5), 640.
Higgins JPT, Thomas J, Chandler J, Cumpston M, Li T, Page MJ, Welch VA (editors). Cochrane Handbook for Systematic Reviews of Interventions version 6.5 (updated August 2024). Cochrane, 2024. Available from www.cochrane.org/handbook.
Meline, T. (2006). Selecting studies for systemic review: Inclusion and exclusion criteria. Contemporary Issues in Communication Science and Disorders, 33(Spring), 21–27.
Miyamoto-Mikami, E., Zempo, H., Fuku, N., Kikuchi, N., Miyachi, M., & Murakami, H. (2018). Heritability estimates of endurance-related phenotypes: A systematic review and meta-analysis. Scandinavian Journal of Medicine & Science in Sports, 28(3), 834–845.
Mullis, M. N., Wright, K. M., Raj, A., Gatti, D. M., Reifsnyder, P. C., Flurkey, K., Archer, J. R., Robinson, L., Di Francesco, A., Svenson, K. L., Korstanje, R., Harrison, D. E., Ruby, J. G., & Churchill, G. A. (2025). Analysis of lifespan across diversity outbred mouse studies identifies multiple longevity-associated loci. Genetics, 230(4), iyaf081.
Nakagawa, S., & Cuthill, I. C. (2007). Effect size, confidence interval and statistical significance: A practical guide for biologists. Biological Reviews, 82(4), 591–605.
Paldam, M. (2015). Meta-analysis in a nutshell: Techniques and general findings. Economics, 9(1), 20150011.
Resende, P. S., Viana-Junior, A. B., Young, R. J., & Azevedo, C. S. (2021). What is better for animal conservation translocation programmes: Soft- or hard-release? A phylogenetic meta-analytical approach. Journal of Applied Ecology, 58(6), 1122–1132.
Schardt, C., Adams, M. B., Owens, T., Keitz, S., & Fontelo, P. (2007). Utilization of the PICO framework to improve searching PubMed for clinical questions. BMC Medical Informatics and Decision Making, 7, 16.
Scott, A. B., Honeychurch, D., & Brin, M. F. (2023). Early development history of Botox (onabotulinumtoxinA). Medicine, 102(Suppl), e32371.
van Aert, R. C. M., Wicherts, J. M., & van Assen, M. A. L. M. (2016). Conducting Meta-Analyses Based on p Values. Perspectives on Psychological Science, 11(5), 713–729.
Yuan, R., Tsaih, S.-W., Petkova, S. B., de Evsikova, C. M., Xing, S., Marion, M. A., Bogue, M. A., Mills, K. D., Peters, L. L., Bult, C. J., Rosen, C. J., Sundberg, J. P., Harrison, D. E., Churchill, G. A., & Paigen, B. (2009). Aging in inbred strains of mice: Study design and interim report on median lifespans and circulating IGF1 levels. Aging Cell, 8(3), 277–287.
Chapter 20 contents
- Additional topics
- Area under the curve
- Peak detection
- Baseline correction
- Surveys
- Time series
- Dimensional analysis
- Estimating population size
- Diversity indexes
- Survival analysis
- Growth equations and dose response calculations
- Plot a Newick tree
- Phylogenetically independent contrasts
- How to get the distances from a distance tree
- Binary classification
- Meta-analysis
12.3 – Fixed effects, random effects, and agreement
Introduction
Within discussions of one-way ANOVA models the distinction between two general classes of models needs to be made clear by the researcher. The distinction lies in how the levels of the factor are selected. If the researcher selects the levels, then the model is a Fixed Effects Model, also called a Model I ANOVA. On the other hand, if the levels of the factor were selected by random sampling from all possible levels of the factor, then the model is a Random Effects Model, also called a Model II ANOVA. This page is about such models and I’ll introduce the intraclass correlation coefficient, abbreviated as ICC, as a way to illustrate applications of Model II ANOVA.
Here’s an example to help the distinction. Consider an experiment to see if over the counter painkillers are as good as prescription pain relievers at reducing numbers of migraines over a six week period. The researcher selects Tylenol®, Advil®, Bayer® Aspirin, and Sumatriptan (Imitrex®), the latter an example of a medicine only available by prescription. This is clearly an example of fixed effects; the researcher selected the particular medicines for use.
Random effects, in contrast, implies that the researcher draws up a list of all over the counter pain relievers and draws at random three medicines; the researcher would also randomly select from a list of all available prescription medicines.
Fixed effects are probably the more common experimental approaches. To be complete, there is a third class of ANOVA called a Mixed Model or Model III ANOVA, but this type of model only applies to multidimensional ANOVA (eg, two-way ANOVA or higher), and we reserve our discussion of the Model III until we discuss multidimensional ANOVA (Table 1).
Table 1. ANOVA models
| ANOVA model | Treatments are |
| I | Fixed effects |
| II | Random effects |
| III | Mixed, both fixed & random effects |
Although the calculations for the one-way ANOVA under Model I or Model II are the same, the interpretation of the statistical significance is different between the two.
In Model I ANOVA, any statistical difference applies to the differences among the levels selected, but cannot be generalized back to the population. In contrast, statistical significance of the Factor variable in Model II ANOVA cannot be interpreted as specific differences among the levels of the treatment factor, but instead, apply to the population of levels of the factor. In short, Model I ANOVA results apply only to the study, whereas Model II ANOVA results may be interpreted as general effects, applicable to the population.
This distinction between fixed effects and random effects can be confusing, but it has broad implications for how we interpret our results in the short-term. This conceptual distinction between how the levels of the factor are selected also has general implications for our ability to acquire generalizable knowledge by meta-analysis techniques (Hunter and Schmidt 2000). Often we wish to generalize our results: we can do so only if the levels of the factor were randomly selected in the first place from all possible levels of the factor. In reality, this may not often be the case. It is not difficult to find examples in the published literature in which the experimental design is clearly fixed effects (ie, the researcher selected the treatment levels for a reason), and yet in the discussion of the statistical results, the researcher will lapse into generalizations.
Random Effects Models and agreement
Model II ANOVA is common in settings in which individuals are measured more than once. For example, in behavioral science or in sports science, subjects are typically measured for the response variable more than once over a course of several trials. Another common setting of Model II ANOVA is where more than one raters are judging an event or even a science project. In all of these cases what we are asking is about whether or not the subjects are consistent, in other words, we are asking about the precision of the instrument or measure.
In the assessment of learning by students, for example, different approaches may be tried and the instructor may wish to investigate whether the interventions can explain changes in test scores. To assess instrument validity — an item score from a grading rubric (Goertzen and Klaus 2023), tumor budding as biomarker for colorectal cancer (Bokhorst et al 2020) — agreement or concordance among two or more raters or judges (inter-rater reliability) needs to be established (same citations and references therein). For binomial data, we would be tempted to use the phi coefficient, Is it actually reliable Cohen’s kappa (two judges) or Fleiss Kappa (two or more judges) is a better tool. Phi coefficient and both assessment scores were introduced in Chapter 9.2.
For ratio scale data, agreement among scores of two or more scores from judges There is an enormous number of articles on reliability measures in the social sciences and you should be aware of a classical paper on reliability by Shrout and Fleiss (1979) (see also McGraw and Wong, 1996). Both the ICC and the Pearson product moment correlation, r, which we will introduce in Chapter 16, are measures of strength of linear association between two ratio scale variables (Jinyuan et al 2016). But ICC is more appropriate for association between repeat measures of the same thing, eg, repeat measures of running speed or agreement between judges. In contrast, the product moment correlation can be used to describe association between any two variables, eg, between repeat measures of running speed, but also between say running speed and maximum jumping height. The concept of repeatability of individual behavior or other characteristics is also a common theme in genetics and so you should not be surprised to learn that the concept actually traces to RA Fisher and his invention of ANOVA. Just as in the case of the sociology literature, there are many papers on the use and interpretation of repeatability in the evolutionary biology literature (eg, Lessels and Boag 1987; Boake 1989; Falconer and Mackay 1996; Dohm 2002; Wolak et al 2012).
Agreement and repeatability are Model II (random effects) because the subjects, items, or raters being studied are treated as a random sample from a larger population rather than specific, fixed levels of interest. In reliability studies, subjects are not chosen for their specific characteristics but as representatives of the population variability. The goal is to infer whether a measurement tool works for any future subject or rater, not just the ones tested in the study. These factors are designed to estimate variance components and generalize results beyond the specific sample used. Put another way, the goal of Model II is often to estimate how much variance is due to differences between subjects versus within subjects (repeatability), which requires treating the subject effect as random.
There are many ways to analyze these kinds of data but a good way is to treat this problem as a one-way ANOVA with Random Effects. Thus, the Random Effects model permits the partitioning of the variation in the study into two portions: the amount that is due to differences among the subjects or judges or intervention versus the amount that is due to variation within the subjects themselves. The Factor is the Subjects and the levels of the factor are how ever many subjects are measured twice or more for the response variable.
If the subjects performance is repeatable, then the Mean Square Between (Among) Subjects,  , component will be greater than the Mean Square Error component,
 , of the model. There are many measures of repeatability or reliability, but the intraclass correlation coefficient or ICC is one of the most common. The ICC may be calculated from the Mean Squares gathered from a Random Effects one-way ANOVA. ICC can take any value between zero and one.
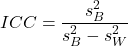
where
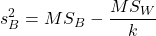
and

B and W refers to the among group (between or among groups mean square) and the within group components of variation (error mean square), respectively, from the ANOVA, MS refers to the Mean Squares, and k is the number of repeat measures for each experimental unit. In this formulation k is assumed to be the same for each subject.
By example, when a collection of sprinters run a race, if they ran it again, would the outcome be the same, or at least predictable? If the race is run over and over again and the runners cross the finish lines at different times each race, then much of the variation in performance times will be due to race differences largely independent of any performance abilities of the runners themselves and the Mean Square Error term will be large and the Between subjects Mean Square will be small. In contrast, if the race order is preserved race after race: Jenny is 1st, Ellen is 2nd, Michael is third, and so on, race after race, then differences in performance are largely due to individual differences. In this case, the Between-subjects Mean Square will be large as will the ICC, whereas the Mean Square for Error will be small, and so will the ICC.
Can the intraclass correlation be negative?
In theory, no. Values for ICC range between zero and one. The familiar Pearson product moment correlation, Chapter 16, takes any value between -1 and +1. However, in practice, negative values for ICC will result if  .
In other words, if the within group variability is greater than the among group variability, then negative ICC are possible. The question is whether negative estimates are ever biologically relevant or, simply result of limitations of the estimation procedure. Small ICC values and few repeats increases the risk of negative ICC estimates. Thus, a negative ICC would be “simply a(n) “unfortunate” estimate (Liljequist et al 2019). However, there may be situations in which negative ICC is more than unfortunate. For example, repeatability, a quantitative genetics concept (Falconer and Mackay 1996), can be negative (Nakagawa and Schielzeth 2010).
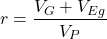
Repeatability reflects the consistency of individual traits over time (or spatially, eg, scales on on a snake), is defined as the ratio of within individual differences and among individuals differences. Thus, within individual variance is attributed to general environmental effects,  , whereas variance among individuals is both genetic and environmental. Scenarios for which repeated measures on the same individual may occur under environmental conditions, termed specific environmental effects or
 by Falconer and Mackay (1996), that negatively affect performance are not hard to imagine — it remains to be determined how common these conditions are and whether or not estimates of repeatability are negative.
ICC Example
I extracted 15 data points from a figure about nitrogen metabolism in kidney patients following treatment with antibiotics (Figure 1, Mitch et al 1977). I used a web application called WebPlot Digitizer (https://apps.automeris.io/wpd/), but you can also accomplish this task within R via the digitize package. I was concerned about how steady my hand was using my laptop’s small touch screen, a problem that very much can be answered by thinking statistically, and taking advantage of the ICC. So, rather than taking just one estimate of each point I repeated the protocol for extracting the points from the figure three times generating a total of three points for each of the 15 data points or 45 points in all. How consistent was I?
Let’s look at the results just for three points, #1, 2, and 3.
In the R script window enter
points = c(1,2,3,1,2,3,1,2,3)
Change points to character so that the ANOVA command will treat the numbers as factor levels.
points = as.character(points)
extracts = c(2.0478, 12.2555, 16.0489, 2.0478, 11.9637, 16.0489, 2.0478, 12.2555, 16.0489)
Make a data frame, assign to an object, eg, “digitizer”
digitizer = data.frame(points, extracts)
The dataset “digitizer” should now be attached and available to you within Rcmdr. Select digitizer data set and proceed with the one-way ANOVA.
Output from oneway ANOVA command
Model.1 <- aov(extracts ~ points, data=digitizer)

 summary(Model.1)
            Df    Sum Sq   Mean Sq  F value     Pr(>F)
points       2 313.38895 156.69448 16562.49 5.9395e-12 ***
Residuals    6   0.05676   0.00946
---
Signif. codes:  0 '***' 0.001 '**' 0.01 '*' 0.05 '.' 0.1 ' ' 1

numSummary(extracts , groups = points,
+   statistics=c("mean", "sd"))
         mean           sd data:n
1  2.04780000 0.0000000000      3
2 12.15823333 0.1684708085      3
3 16.04890000 0.0000000000      3
End R output. We need to calculate the ICC

I’d say that’s pretty repeatable and highly precise measurement!
But is it accurate? You should be able to disentangle accuracy from precision based on our previous discussion (Chapter 3.5), but now in the context of a practical way to quantify precision.
ICC calculations in R
We could continue to calculate the ICC by hand, but better to have a function. Here’s a crack at the function to calculate ICC along with a 95% confidence interval.
myICC <- function(m, k, dfN, dfD) {
 testMe <- anova(m)
 MSB <- testMe$"Mean Sq"[1]
 MSE <- testMe$"Mean Sq"[2]
 varB <- MSB - MSE/k
 ICC <- varB/(varB+MSE)
 fval <- qf(c(.025), df1=dfN, df2=dfD, lower.tail=TRUE)
 CI = (k*MSE*fval)/(MSB+MSE*(k-1)*fval)
 LCIR = ICC-CI
 UCIR = ICC+CI
 myList = c(ICC, LCIR, UCIR)
 return(myList)
}
The user supplies the ANOVA model object (eg, Model.1 from our example), k, which is the number of repeats per unit, and degrees of freedom for the among groups comparison (2 in this example), and the error mean square (6 in this case). Our example, run the function
m2ICC = myICC(Model.1, 3, 2,6); m2ICC
and R returns
[1] 0.9999396 0.9999350 0.9999442
with the ICC reported first, 0.9999396, followed by the lower limit (0.9999350) and the upper limit (0.9999442) of the 95% confidence interval.
Instead of writing your own function, several R packages can calculate the intraclass correlation coefficient (ICC) and its variants. These packages include: irr, psy, psych, and rptR. For complex experiments involving multiple predictor variables, these packages are helpful for obtaining the correct ICC calculation (cf Shrout and Fleiss 1979; McGraw and Wong 1996). For the one-way ANOVA it is easier to just extract the information you need from the ANOVA table and run the calculation directly. We do so for a couple of examples.
Example: Are marathon runners consistent more consistent than my commute times?

Figure 1.Honolulu Marathon 2024 participant. Image credit: Pdubs.94, licensed under CC BY 4.0 (Creative Commons Attribution 4.0 International License), via Wikipedia.
A marathon is 26 miles, 385 yards (42.195 kilometers) long (World Athletics.org). And yet, tens of thousands of people choose to run in these events. For many, running a marathon is a one-off, the culmination of a personal fitness goal. For others, it’s a passion and a few are simply extraordinary, elite runners who can complete the courses in 2 to 3 hours (Table 3). That’s about 12.5 miles per hour. For comparison, my 20 mile commute on the H1 freeway on Oahu typically takes about 40 minutes to complete, or 27 miles per hour (Table 2, yes, I keep track of my commute times, per Galton’s famous maxim: “Whenever you can, count”).

Figure 2. View west along Interstate H-1 (Lunalilo Freeway) at 6:30AM on a weekday, Honolulu, Oahu, Hawaii. Image used with permission, credit: S. Dohm.
Table 2. A sampling of average commute speeds, miles per hour (mph), on the H1 freeway during DrD’s morning commute (distance about 19.3 miles).
| Week | Monday | Tuesday | Wednesday | Thursday | Friday |
|---|---|---|---|---|---|
| 1 | 28.5 | 23.8 | 28.5 | 30.2 | 26.9 |
| 2 | 25.8 | 22.4 | 29.3 | 26.2 | 27.7 |
| 3 | 26.2 | 22.6 | 24.9 | 24.2 | 34.3 |
| 4 | 23.3 | 26.9 | 31.3 | 26.2 | 30.2 |
Try on your own.
Calculate the ICC for my commute speeds.
Run the one-way ANOVA to get the necessary mean squares and input the values into our ICC function. We have
require(psych)
m2ICC = myICC(AnovaModel.1, 4, 4,11); m2ICC
[1] 0.7390535 0.6061784 0.8719286
Repeatability, as estimated by the ICC, was 0.74 (95% CI 0.606, 0.872), for repeat measures of commute times.
We can ask the same about marathon runners — how consistent from race to race are these runners? The following data are race times drawn from a sample of runners who completed the Honolulu Marathon in both 2016 and 2017 in 2 to 3 hours (times recorded in minutes). In other words, are elite runners consistent?
Table 3. Honolulu marathon running times (min) for eleven repeat, elite runners.
| ID | Time |
|---|---|
| P1 | 179.9 |
| P1 | 192.0 |
| P2 | 129.9 |
| P2 | 130.8 |
| P3 | 128.5 |
| P3 | 129.6 |
| P4 | 179.4 |
| P4 | 179.7 |
| P5 | 174.3 |
| P5 | 181.7 |
| P6 | 177.2 |
| P6 | 176.2 |
| P7 | 169.0 |
| P7 | 173.4 |
| P8 | 174.1 |
| P8 | 175.2 |
| P9 | 175.1 |
| P9 | 174.2 |
| P10 | 163.9 |
| P10 | 175.9 |
| P11 | 179.3 |
| P11 | 179.8 |
Stacked worksheet, P refers to person, therefore P1 is person ID 1, P2 is person ID 2, and so on.
After running a one-way ANOVA, here are results for the marathon runners
m2ICC = myICC(Model.1, 2, 10,11); m2ICC
[1] 0.9780464 0.9660059 0.9900868
Repeatability, as estimated by the ICC, was 0.98 (95% CI 0.966, 0.990), for repeat measures of marathon performance. Put more simply, knowing what a runner did in 2016 I would be able to predict their 2017 race performance with high confidence, 98%!
And now, we compare: the runners are more consistent!
Clearly this is an apples-to-oranges comparison, but it gives us a chance to think about how we might make such comparisons. The ICC will change because of differences among individuals. For example, if individuals are not variable, if everyone finishes the race at the same time, then the ICC will be low (or even zero). Because there is no variance to be attributed to individual differences, the proportion of total variance explained by those differences will be being minimal.
Visualizing repeated measures.
Waterfall plot.
If just two measures, then a profile plot will do. We introduced profile plots in the paired t-test chapter (Ch10.3). For more than two repeated measures, a line graph will do (see question 9 below). Another graphic increasingly used is the waterfall plot (waterfall chart), particularly for before and after measures or other comparisons against a baseline. For example, it’s a natural question for our eleven marathon runners — how much did they improve on the second attempt of the same course? Figure 3 shows my effort to provide a visual.
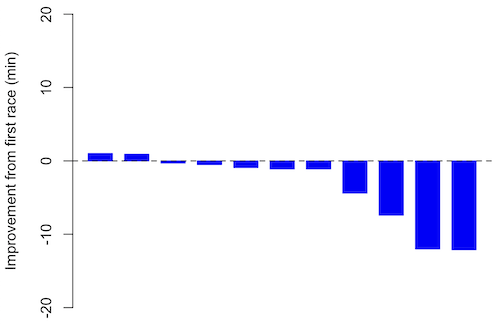
Figure 3. Simple waterfall plot of race improvement for Table 3 data. Dashed horizontal line at zero.
R code
Data wrangling: Create a new variable, eg, race21, by subtracting the first time from the second time. Multiply by -1 so that improvement (faster time in second race) is positive. Finally, apply descending sort so that improvement is on the left and increasingly poorer times are on the right.
df <- data.frame(
ID = rep(paste0("P", 1:11), each = 2),
Time = c(179.9,192.0,
129.9,130.8,
128.5,129.6,
179.4,179.7,
174.3,181.7,
177.2,176.2,
169.0,173.4,
174.1,175.2,
175.1,174.2,
163.9,175.9,
179.3,179.8)
)

# Convert to wide format
df_wide <- reshape(df, idvar = "ID", timevar = "ID",
direction = "wide")

# Extract first and second times manually
time_matrix <- matrix(df$Time, ncol = 2, byrow = TRUE)
colnames(time_matrix) <- c("Time1", "Time2")

# Calculate improvement (second - first)
base21 <- time_matrix[,2] - time_matrix[,1]

# Sort for waterfall display
base21 <- sort(base21, decreasing = TRUE)

# Waterfall plot
barplot(base21, col="blue", border="blue", space=0.5,
ylim=c(-20,20),
ylab="Improvement from first race (min)")
abline(h=0, lty=2)
Interpretation.
From the graph (Fig 3) we see that few of the racers improved their times the second time around — a few had decreased times.
Spaghetti plots.
Spaghetti plots, which display individual trajectories over time or multiple measurements, is a specialized line plot effective for visualizing the consistency of performance. The vertical thickness or spread of a single subject’s line across measurements indicates their level of repeatability. A “flat” line indicates high repeatability, while a volatile, zig-zagging line indicates low repeatability. Spaghetti plots are useful to visualize growth, decline, or stability over time for a single performance measure.
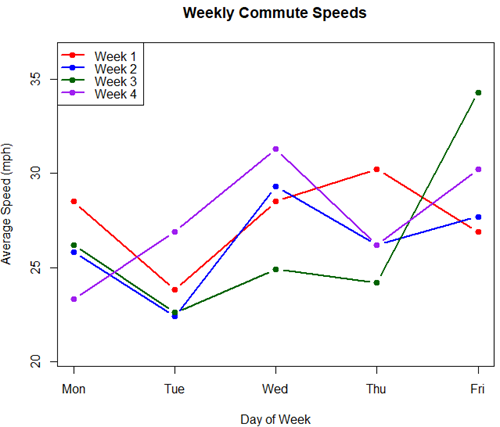
Figure 4. A spaghetti plot of average commute speeds from Table 2 data.
R code
# 1. Enter the data from Table 2.
commute <- data.frame(
Week = 1:4,
Monday = c(28.5, 25.8, 26.2, 23.3),
Tuesday = c(23.8, 22.4, 22.6, 26.9),
Wednesday = c(28.5, 29.3, 24.9, 31.3),
Thursday = c(30.2, 26.2, 24.2, 26.2),
Friday = c(26.9, 27.7, 34.3, 30.2)
)

head(commute)

# 2. Set the X-axis points
days <- 1:5
day_names <- c("Mon", "Tue", "Wed", "Thu", "Fri")

# 3. Create empty plot
# Find range of Y to ensure all data fits
ymin <- min(commute[, 2:6]) - 2
ymax <- max(commute[, 2:6]) + 2

plot(NA, xlim = c(1, 5), ylim = c(ymin, ymax),
xlab = "Day of Week", ylab = "Average Speed (mph)",
main = "Weekly Commute Speeds", xaxt = "n")

# Add X-axis labels
axis(1, at = 1:5, labels = day_names)

# 4. Add lines for each week (spaghetti)
colors <- c("red", "blue", "darkgreen", "purple")
for (i in 1:nrow(commute)) {
# Plot lines
lines(days, commute[i, 2:6], col = colors[i], lwd = 2, type = "b", pch = 19)
}

# 5. Add legend
legend("topleft", legend = paste("Week", 1:4), col = colors, lwd = 2, pch = 19)
Parallel coordinates plots.
Parallel coordinates plot allows each entity to be represented by a unique, continuous line traced across several vertical axes (each representing a different measurement or variable). High repeatability is indicated when a line remains roughly horizontal across all axes, while poor repeatability is visualized as lines that zig-zag or change direction between measurements.
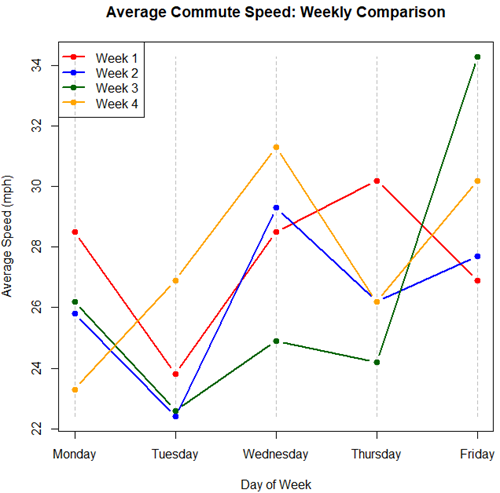
Figure 5. A parallel coordinates plot of average commute speeds from Table 2 data.
Both spaghetti plots and parallel coordinate plots can be used to visualize consistency of performance over multiple measures, but they differ significantly in their handling of data, scale, and context. Spaghetti plots are best for tracking within-subject variability over time, but quickly become a mess — like pasta tossed and sticking to a wall — when subject count increases. Parallel coordinate plots are a multivariate generalization — each line represents an individual’s profile across different tests, eg, accuracy, speed, VO2max.
R code.
# 1. Create the data frame
# see above

# 2. Extract only the numerical commute data for plotting
commute_data <- commute[, 2:6]

# 3. Setup the plot area
# Define range for y-axis
y_range <- range(commute_data)
# Define number of days (5)
num_days <- ncol(commute_data)

# Create empty plot
plot(NA, xlim = c(1, num_days), ylim = y_range,
xaxt = "n", xlab = "Day of Week", ylab = "Average Speed (mph)",
main = "Average Commute Speed: Weekly Comparison")

# Add x-axis labels
axis(1, at = 1:num_days, labels = colnames(commute_data))

# 4. Draw vertical lines for each day
for (i in 1:num_days) {
lines(c(i, i), y_range, col = "grey", lty = 2)
}

# 5. Add lines for each week (repeated measures)
colors <- c("red", "blue", "darkgreen", "orange")
for (i in 1:nrow(commute_data)) {
lines(1:num_days, commute_data[i, ], col = colors[i], lwd = 2, type = "b", pch = 19)
}

# 6. Add legend
legend("topleft", legend = paste("Week", commute$Week), col = colors, lwd = 2, pch = 19)
Heat map.
Heat map quickly identify patterns, such as an individual’s performance improving, degrading, or remaining stable over time. For example, uniform, solid colors across rows (individuals) or columns (time/trials) indicate high consistency, while varied colors indicate poor repeatability.
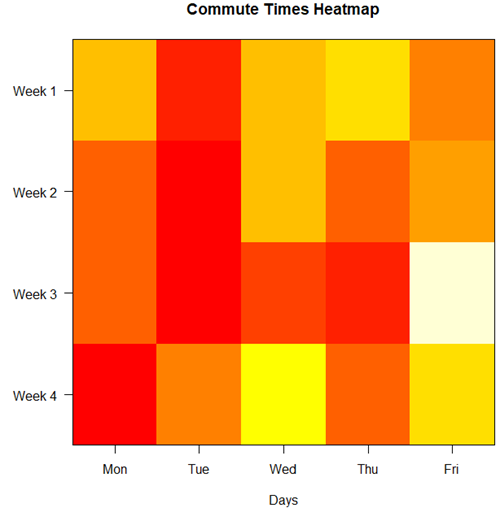
Figure 6. A heat map of the commute speeds data set.
R code.
# 1. Create the data
# Week is excluded from matrix to only include numerical commute times
commute_data <- matrix(c(
28.5, 23.8, 28.5, 30.2, 26.9,
25.8, 22.4, 29.3, 26.2, 27.7,
26.2, 22.6, 24.9, 24.2, 34.3,
23.3, 26.9, 31.3, 26.2, 30.2
), nrow = 4, byrow = TRUE)

# 2. Add row and column names
rownames(commute_data) <- c("Week 1", "Week 2", "Week 3", "Week 4")
colnames(commute_data) <- c("Mon", "Tue", "Wed", "Thu", "Fri")

# 3. Create the heatmap
# Use t() to transpose so weeks are rows and days are columns
# Use rev() on rows to have Week 1 at the top
image_data <- t(apply(commute_data, 2, rev))

# Set up the plotting area (margins for labels)
par(mar = c(5, 6, 4, 2))

# Plot the matrix
# Option 1
image(1:nrow(image_data), 1:ncol(image_data), image_data,
col = heat.colors(12),
axes = FALSE, xlab = "Days", ylab = "",
main = "Commute Times Heatmap")

# Add axes labels
axis(1, at = 1:5, labels = colnames(commute_data))
axis(2, at = 1:4, labels = rev(rownames(commute_data)), las = 1)
box()
Interpretation.
The graphs (Fig 4 – 6) show a lack of trends in consistency of drive speeds. The heat map suggests more consistency on Monday — low speeds (Fig 4 & Fig 5), but that’s a stretch.
An example for you to work, from our Measurement Day
If you recall, we had you calculate length and width measures on shells from samples of gastropod and bivalve species. In the table are repeated measures of shell length, by caliper in mm, for a sample of Conus shells (Fig 7 and Table 4).
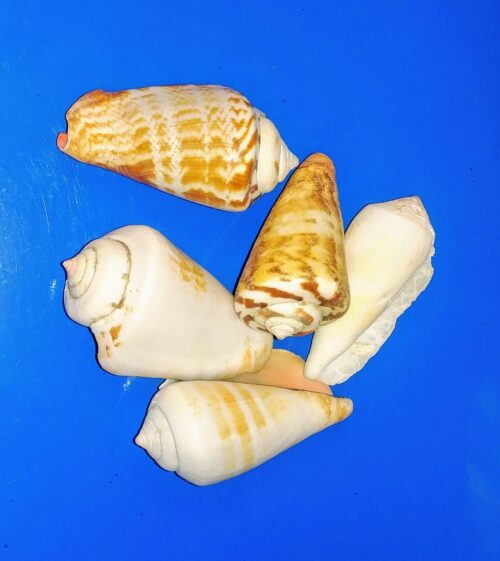
Figure 7. Conus shells, image by M. Dohm.
Repeated measures of the same 12 Conus shells.
Table 4. Unstacked dataset of repeated length measures on 12 shells
| Sample | Measure1 | Measure2 | Measure3 |
|---|---|---|---|
| 1 | 45.74 | 46.44 | 46.79 |
| 2 | 48.79 | 49.41 | 49.67 |
| 3 | 52.79 | 53.45 | 53.36 |
| 4 | 52.74 | 53.14 | 53.14 |
| 5 | 53.25 | 53.45 | 53.15 |
| 6 | 53.25 | 53.64 | 53.65 |
| 7 | 31.18 | 31.59 | 31.44 |
| 8 | 40.73 | 41.03 | 41.11 |
| 9 | 43.18 | 43.23 | 43.2 |
| 10 | 47.1 | 47.64 | 47.64 |
| 11 | 49.53 | 50.32 | 50.24 |
| 12 | 53.96 | 54.5 | 54.56 |
Maximum length from from anterior end to apex with calipers. Repeated measures were conducted blind to shell id, sampling was random over three separate time periods.
Questions
- Consider data in Table 2, Table 3, and Table 4. True or False: The arithmetic mean is an appropriate measure of central tendency. Explain your answer.
- Enter the shell data into R; Best to copy and stack the data in your spreadsheet, then import into R or R Commander. Once imported, don’t forget to change Sample to character, otherwise R will treat Sample as ratio scale data type. Run your one-way ANOVA and calculate the intraclass correlation (ICC) for the dataset. Is the shell length measure repeatable?
- The marathon results in Table 2 are paired data, results of two races run by the same individuals. Make a profile plot for the data (see Ch10.3 for help).
- A profile plot is used to show paired data; for two or more repeat measures, use a line graph instead.
A. Produce a line graph for data in Table 4. The line graph is an option in R Commander (Rcmdr: Graphs Line graph…), and can be generated with the following simple R code:
lineplot(Sample, Measure1, Measure2, Measure3)
B. What trends, if any, do you see? Report your observations.
C. Make another line plot for data in Table 2. Report any trend and include your observations.
Quiz Chapter 12.3
Fixed effects, random effects, and agreement
Chapter 12 contents
- Introduction
- The need for ANOVA
- One way ANOVA
- Fixed effects, random effects, and agreement
- ANOVA from “sufficient statistics”
- Effect size for ANOVA
- ANOVA posthoc tests
- Many tests one model
- References and suggested readings