2.1 – Why (Bio)Statistics?
- What are the basic elements of biostatistics? .
- Why we require you to take Biostatistics as part of your major?.
- But, I’m pre-med and plan to apply to medical school ….
- With machine learning and AI, why learn biostatistics?.
- In what disciplines are biostatisticians employed?.
- Conclusions.
- Questions.
- Quiz.
- Chapter 2 contents
What are the basic elements of biostatistics?
.
What will you learn from an introductory course on (bio)statistics? Concepts and skills: An understanding (concepts) about the purpose and limits of descriptive statistics, inferential statistics, and statistical modeling for answering questions in biology and how to use elements of R programming (skills) applied to biology-related data sets to accomplish these tasks (see Table 1). Related, you will learn how (skills) to collect and manage data from projects, and why (concepts) statistical analysis can help answer questions, even inform decisions in public health. Thus, assessment in BI-311 of student learning includes both formative and summative assignments, exams, and culminates with a student research project.
Note 1: From time to time in this book I write “(bio)statistics” instead of “biostatistics.” It’s my subtle way of highlighting that whatever argument or statement is attached applies more generally to the statistical discipline, not just biostatistics. However, I’m not particularly consistent with this typology in the book.
What skills are you going to get from all of this? You will get different opinions on the elements of an essential first course in statistics or biostatistics. Certainly the basics are a foundation in probability and a breadth of classical elementary statistical procedures, which will include descriptive statistics, analysis of variance and linear regression, and an introduction to multivariate analysis. In preparation for your course in epidemiology you will also be introduced to risk analysis and survival analysis. However, the primary return for your time, I hope, will be a deeper appreciation for how to think about problems in biology from experimental design and data analysis perspectives. Practical skills you will learn include how to process and clean data for analysis, data visualization, and a foundation in parametric and nonparametric statistical methods.
The data sets described and provided in this course are small, with sample sizes in the tens to thousands (rarely). This framework is consistent with the development of the discipline of (bio)statistics, which originated to help interpret experiments conducted in agriculture, industry, and medical research (see Chapter 2.3). But, as you now know, because of genomics and other data-intensive disciplines, data sets can be very large, much beyond the kinds of data sets used prior to use of the computer in data analysis. However, as we will argue later on this page, learning foundational skills in (bio)statistics with small data sets facilitates working with and gaining insights from larger data sets. For example, we will emphasize during our work this semester how to develop a workflow with small data sets; these same workflows then can be scaled up and would include pipelines — based on tools and techniques developed in the broader discipline of bioinformatics — to large data sets, including use of Artificial Intelligence and machine learning.
Note 2: In data science, a workflow refers to the entire, end-to-end process needed in a project, from data collection, data processing, to descriptive statistics and modeling or inferential statistics, and report writing. A pipeline described elements of a workflow that can be automated.
Why we require you to take (Bio)statistics as part of your major?
.
At Chaminade University we require all biology students to take biostatistics, and we do so with an emphasis on use of data analysis skill development. This requirement aligns our program to national expectations of biology undergraduate education (eg, AAAS, NAS, NIH, NSF). As stated in Bio2010: Transforming Undergraduate Education for Future Research Biologists,
“Biology majors should be adept at using computers to acquire and process data, carry out statistical characterization of the data and perform statistical tests, and graphically display data in a variety of representations (p. 15).”
Learning biostatistics from a course like BI311 — which relies heavily on use of the R programming language and data sets — helps the biology student develop these skills.
In the next pages I will outline a history of statistics (Chapter 2.3), but here I wish to make the point that biostatistics is now considered to be a core skill set for biologists. Biostatistics as a discipline came into its own in the 1930’s, but extensive reliance on statistics in research really dates to more recent times because of the ubiquity of personal computers (Salsburg 2002). Modern biological and biomedical research requires computational and quantitative methods to collect, process, analyze, and interpret large data sets. And yet, even a casual survey of required courses for entry into graduate programs in biology (eg, only recommended for admissions to Marine Biology and Cell and Molecular Biology programs at University of Hawaiʻi – Manoa) will reveal that biostatistics is not required of candidates; so, what gives?
The first point is that programs list only minimum requirements. The second point is that many programs (genomics, ecology, etc) will expect the graduate student to take a year or more of (bio)statistics. The need is so crucial that at Harvard Medical School, all biology graduate students are expected to take a crash-course in computing and statistics to work with data (Stefan et al 2015).
Moreover, while graduate programs are not listing statistics as a requirement, many biology undergraduate curricula now require a course in (bio)statistics to reflect the increasingly data driven modern biology — where the jobs are!
My BI-311 students, I’ll make you a bet — or at least, I’ll make this part of your required homework (see BI311 Workbook)! Even a causal search of a research journal article in a biology discipline of your choosing will prove that there is no doing biology research today without an understanding of statistics.
But, I’m pre-med and plan to apply to medical school …
.
Even a cursory look at the literature will result in finding many authors strongly calling for this kind of preparation for a successful career in medicine (eg, Brieger and Hardin 2012). It’s obvious, but needs stating — you’re applying to medical school to become a doctor — you’ll spend the majority of your adult life as a doctor. Statistical thinking is crucial to answering the daily question: “My patient tested positive for biomarker X, what’s the chance that the patient has disease Y?”
Note 3: Following work done by Biomarkers and Surrogate Endpoint Working Group (Clin. Pharmacol. Ther. 69(3), 89–95 2001), biomarkers are biological characteristics that can be “… objectively measured and evaluated as an indicator of normal biological processes, pathogenic processes, or pharmacological responses to a therapeutic intervention” (Naylor 2003). Compare to biomarkers are “[a] defined characteristic that is measured as an indicator of normal biological processes, pathogenic processes, or responses to an exposure or intervention, including therapeutic interventions” (2016 by FDA-NIH Biomarker Working Group in BEST (Biomarkers, EndpointS, and other Tools) Resource).
If your answer today is, the patient has the disease, then you objectively need this course! Hint: there are four possible outcomes, not two, of a test, see Chapter 7.3 – Conditional Probability and Evidence Based Medicine.
Need more convincing? Take a look at the targets of questions intended to evaluate Skill 4 of the Scientific Inquiry and Reasoning Skills standard of the revised MCAT2015 Exam (p. 107, What’s on the MCAT2015 exam?).
- Using, analyzing, and interpreting data in figures, graphs, and tables.
- Evaluating whether representations make sense for particular scientific observations and data.
- Using measures of central tendency (mean, median, and mode) and measures of dispersion (range, interquartile range, and standard deviation) to describe data.
- Reasoning about random and systematic error.
- Reasoning about statistical significance and uncertainty (eg, interpreting statistical significance levels, interpreting a confidence interval).
- Using data to explain relationships between variables of make predictions.
- Using data to answer research questions and draw conclusions.
- Identifying conclusions that are supported by research results.
- Determining the implications of results for real-world situations.
Before we move on, there’s another justification for learning biostatistics we need to discuss.
With machine learning and AI, why learn biostatistics?
Oh, my goodness. If I was starting over, I would definitely want to pursue expertise in machine learning, ML (Fig 2). Machine learning is about finding patterns in large data sets, and modern biological research may be characterized by the impact of large datasets. The machine learning field, and artificial intelligence, AI, in general, are rapidly evolving, but built on more than 20 years of algorithm and computer discoveries. So why not skip biostatistics and go directly to data science?
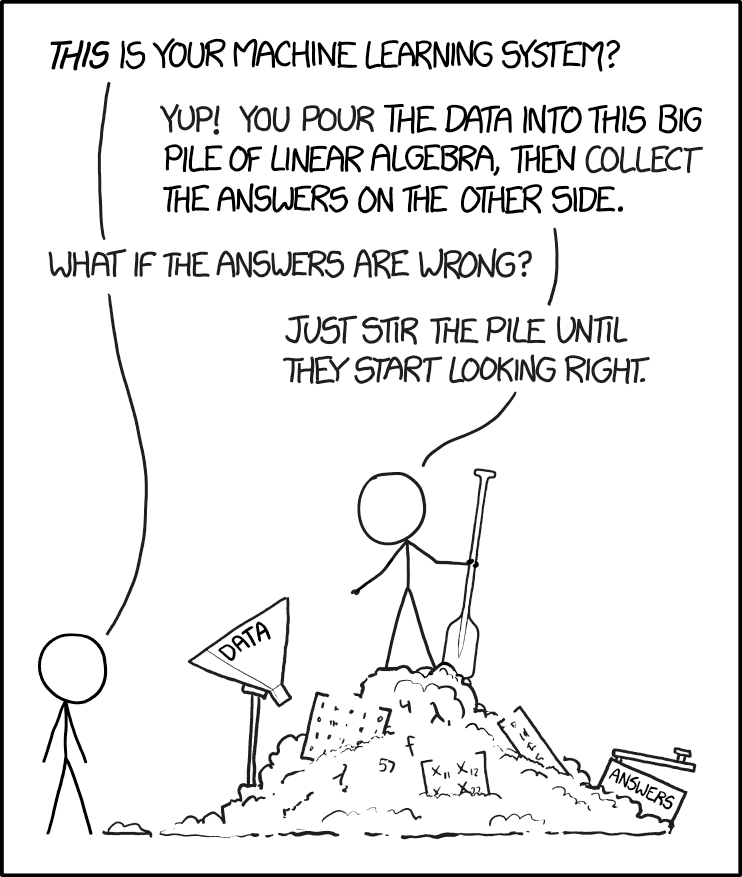
Figure 2. “Machine learning,” https://xkcd.com/1838/.
The parable presented in Figure 2 is about right: Without understanding the statistical foundations behind machine learning algorithms, you’re using tools without really knowing how they work (Lin et al 2025, more generally, see Downey 2024). We have a lot of work ahead of us, but, from time to time, we will exploit the power of AI and ML. For a start, I asked ChatGPT (August 2025), “What statistics is most relevant for ML?”, AI listed responses mapped to “Mike’s Biostatistics Book” are provided in Table 1.
Table 1. AI recommended core statistical topics matched to Mike’s Biostatistics Book
| ChatGPT recommended core statistics topics | Mike's Biostatistics Book |
|---|---|
| Descriptive statistics | Chapter 3 |
| Probability theory | Chapter 6 - 7 |
| Common probability distributions | Chapter 6 |
| Statistical inference | Chapter 8 |
| Estimation and Likelihood | Chapter 3, 6, 17 - 20 |
| Regression analysis | Chapter 17 - 18 |
| Analysis of Variance (ANOVA) | Chapter 12 - 14 |
| Resampling methods | Chapter 19 |
| Dimensionality reduction | Chapter 16, 20 |
| Time series and autocorrelation | Chapter 17 - 18, 20 |
| Optional: Bayesian statistics | Chapter 8 - 9, 18, 20 |
Biostatistics is embedded in bioinformatics and data science, in general. Thus, as implied by Figure 2, a critical step in working with datasets, whether small or large, is to ensure the inputs are valid. This holds across the dat science disciplines. Learning data processing tasks, data cleaning and, more generally, data wrangling are included in our biostatistics course.
Note 4: For larger data sets in the course we will introduce you to rattle, an R package that helps with data processing and data mining with access to simple hypothesis tests (eg, do groups differ?), and pattern detection (eg, correlations and dendrograms). For their required project, students in BI311 may elect to work with the R package targets to build automated data pipelines (eg, calculating growth rates for tomato germination experiments or the essential genes project in Genomics class (BI-308).
In what disciplines are biostatisticians employed?
.
One way to begin this discussion is to think about where statisticians work. The job market includes:
Health Science.
- Drug design, causes of diseases (many “causes” of cancers).
- Health Professional (nurses, physical therapists).
- Type of care and recovery period (importance of a person’s mood on health).
- Exercise regime and recovery from injury.
- Nutrition:- vitamins and health: diet and health.
Ecology & Evolution.
- Causes of changes in population sizes (conservation biology).
- Effects of pollution on organisms and ecosystems.
- Evolution of traits in populations over time.
- Global environmental changes and changes in population sizes or species diversity.
Genetics & Molecular Biology.
- Identifying genes that influence traits (eg, breast cancer, cystic fibrosis).
- Nature vs. nurture (heredity and environment effects on phenotypes).
- Multiple sequence alignment in comparative genomics.
Agriculture.
- Fertilizer effects on plant growth and productivity.
- Compare farming and harvesting methods (eg, organic vs conventional farming).
- Compare plant hybrids for differences in productivity.
Here’s a web site that keeps track of statistics jobs Biostatistics. I would go on to add that experience and competence in statistics would also translate to employment in non-biology fields, eg, business analytics.
Conclusions.
.
Moving forward, we have much to do — you will be exposed to many specific examples of statistical tests, how to calculate estimators, and how to make inferences from experiments. An important goal of this course is for you to be introduced and develop your ability to design experiments. why should you, as biologists and future health care providers, learn biostatistics?
- Develop statistical reasoning skills. Most, if not all graduate students will need to take several courses in statistics.
- Statements about research findings, new and better products, sociological and political issues often depend in large part on some form of statistical analysis.
- By learning a little about experimental design, sampling, and statistical testing, you will be much closer to being able to participate fully in these debates.
- Most, if not all graduate students will need to take several courses in statistics.
- Most, if not all jobs in biology require some training in statistics.
So, there’s really no doing biology without at least some knowledge of statistics. You’re getting a head start!
Questions
- Write up three learning outcomes for this page. Hint: Point your favorite generative AI to this page and ask for help.
- Explore current “biostatistics,” “bioinformatics,” and “data science” job prospects at Indeed.com or other recruiting sites. Search your area/city and also try a wider search.
- Given the rise of AI, now is a great time to explore current thinking about the future and need for biostatistics skills. Write a one paragraph perspective, your “worldview” about pros/cons of developing statistics and data science skill sets.
.
Quiz Chapter 2.1
Why (bio)statistics?
Chapter 2 contents
.
9.5 – Fisher exact test
Introduction
We mentioned that chi-square tests for contingency tables are fine as long as two conditions are met. These are the assumptions of a  test.
- No cell should have expected values less than 5%.
- The test performs poorly at DF = 1 because we are approximating an infinite distribution with an exact test.
You will note that any time you have a 2X2 table, the second condition is always an issue because 2X2 tables have DF=1. Thus, in biomedical research, it is common to have an experiment that may be appropriate for a contingency analysis but the data may suffer from one or both of these limitations. Fisher’s exact test is always an option for these types of problems, but with the advantage that it always returns the exact p-value.
A reminder, the 2×2 table looks like
Table 1. 2×2 table reporting numbers of subjects who have (Yes) or do not have (No) the event.
| Column 1 | Column 2 | ||
| Subjects | Yes | No | |
| Row 1 | Treatment 1 | a | b |
| Row 2 | Treatment 2 | c | d |
where a is the count of Treatment 1 – treated subjects who have the event, b is the count of Treatment 1 – treated subjects who do not have the event, c is the count of Treatment 2 – treated subjects who have the event, d is the count of Treatment 2 – treated subjects who do not have the event. Note the row and column totals:
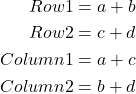
For example, a fairly common, “Gee, that’s curious,” fact is the seven left-handed US Presidents since 1901 (21), is higher than the proportion of left-handers in the general population (about 10%). For comparison, we could ask the same question about Vice Presidents.†
Table 2. U.S. Presidents and Vice-Presidents handedness.
| Subjects | Yes | No |
| Presidents | 7 | 14 |
| Vice presidents | 5 | 20 |
†Seven Vice-Presidents went on to become President, four right-handers, three left-handers.
Ronald A. Fisher came up with a test that is now called “Fisher’s Exact test” that circumvents this problem. It is an extremely useful test to know about because it provides a way to get an exact probability of the outcome compared to all other possible outcomes. Thus, when asked for a possible alternate to the chi-square contingency test for a 2X2 table, you can respond “Fisher’s Exact test.”
Although tedious to calculate by hand, and resource demanding when done by computer because of the multiple factorial expressions, the major advantage of the test is that it does not rely on the assumption that an underlying distribution applies. The Fisher Exact test can be used to calculate the exact probability of the observed outcome (P).
The equation for the Fisher Exact test can be written as
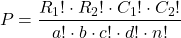
where R stands for row total, C stands for column total, n is the sample size, ! is the factorial, and a, b, c, and d are defined as in Table 1.
How does Fisher’s Exact test work? The data are setup in the usual way for a contingency problem, but now, we calculate the probability for all possible outcomes that we COULD have seen from our experiment, and ask if the actual outcome is unusual (low p-value). The trick is recognizing that you have to keep the totals constrained (note row and column totals stay the same).
Table 3. Original 2X2 contingency table (bold), with the next two more extreme outcomes.
| original data |  |
more extreme | |
next more extreme still | |
| Yes | No | Yes | No | Yes | No |
| 10 | 5 | 11 | 4 | 12 | 3 |
| 4 | 12 | 3 | 13 | 2 | 14 |
 |
 |
 |
I’ve shown just the one-tailed outcomes, so the p-values are for one-tailed tests of hypothesis. The essence of the test is to find all outcomes MORE extreme than the original, in one direction. The one-tailed P-value then is the sum of all probabilities from those more extreme tables of outcomes.
To get the two-tailed probability, remember that you multiply the one-tailed probability by two. More accurate methods are also available (Agresti 1992).
Calculation of Fisher’s test involves using all possible combinations and factorials. Rcmdr has Fisher’s 2X2 built in via the Contingency table and as part of some Rcmdr plugins (eg, RcmdrPlugin.EBM, the Evidence Based Medicine plugin). Here we illustrate Fisher Exact test from the context menu in the main Statistics menu.
Alternatively, there are many web sites out there that provide an online calculator for Fisher’s Exact test. Here’s a link to one such calculator on GraphPad’s web site, cookies must be enabled to run this calculator).
To get the Fisher Exact test, your data must already be summarized into a 2X2 table, in which case you can use R Commander via the Contingency tables… menu selection (Fig 1).
Table 4. 2X2 table smokers vs vitamin use.
| Smoker: No | Smoker: Yes | |
| Vitamin use: No | 14 | 26 |
| Vitamin use: Yes | 19 | 15 |
With the data summarized as in Table 4, we can proceed directly via R Commander to analyze the contingency table, either by Chi-square test of Fisher exact test. First, bring up menu to enter the data (Fig 1):
Rcmdr: Statistics → Contingency tables… → Enter and analyze two-way table…
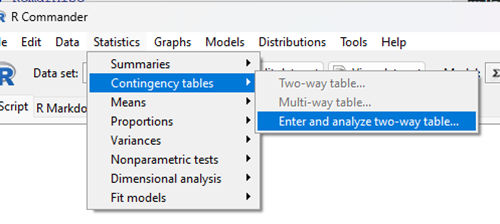
Figure 1. Screenshot Rcmdr menu, Contingency tables.
The image of the R worksheet below contains two columns: Smoker (No, Yes) and Vitamin use (No, Yes). Complete the form (Fig 2).
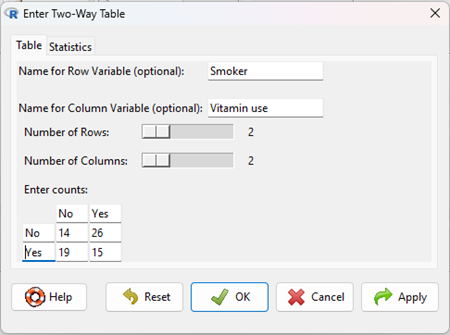
Figure 2. Screenshot Rcmdr menu, Enter Two-Way Table.
Alternatively, if the original data are available, do not tally the counts, let R do the work for you. The worksheet would be stacked like so (Table 5).
Table 5. Portion of subject and row entries in stacked worksheet for smokers vs vitamin use.
| Subject | Vitamin.use | Smoking |
| 1 | No | No |
| 2 | No | No |
| 3 | No | No |
| 4 | No | No |
| 5 | No | No |
| . | . | . |
| 71 | Yes | Yes |
| 72 | Yes | Yes |
| 73 | Yes | Yes |
| 74 | Yes | Yes |
And from the R Commander menu select as before
Rcmdr: Statistics → Contingency tables… → Two way table … (Fig 3).
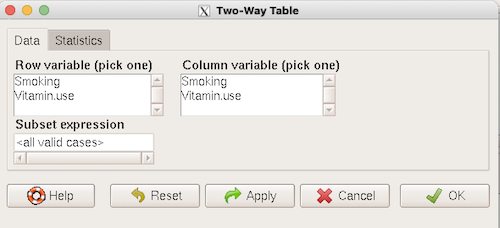
Figure 3. Screenshot Rcmdr two-way table menu, load the data from stacked worksheet.
Data is now ready.
R code
To carry out contingency table analysis on the entered data (Fig 2 or Fig 3), select the Statistics option tab (Fig 4, green arrow).
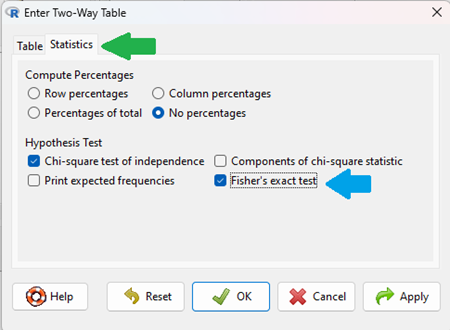
Figure 4. Screenshot Rcmdr menu Statistics option. Select Chi-square test of independence, Fisher’s exact test, or both.
Check the box next to the Fisher’s exact test (Fig 4, blue arrow).
Click OK, and here is the R output.
> fisher.test(.Table)
Fisher's Exact Test for Count Data

data: .Table
p-value = 0.1008
alternative hypothesis: true odds ratio is not equal to 1
95 percent confidence interval:
0.1496417 1.1985775
sample estimates:
odds ratio
0.4302094
We accepted the defaults Is this a one or two-tailed test of hypothesis?
What can we conclude about the null hypothesis? Do we accept or reject?
Want to know what the “odds ratio” is? Follow the link to the next subchapter.
When to use the Fisher Exact Test?
Here’s the take-home message: the Fisher exact test is an alternate and better choice over the contingency table chi-square for 2X2 tables if one or more of the cells has expected values less than 5%. It is also appropriate for cases in which you have only 1 degree of freedom (as do all 2X2 tables!), but it doesn’t make sense if each cell has more than 5% expected values (the calculation is too tedious), but rather, apply the Yate’s correction. As the sample sizes get larger, the different methods converge to virtually identical answers.
Some examples.
Is there an association between final grades and attendance on a randomly selected day?
Table 6. First 2X2 scenario.
| cc | Yes | No |
| Letter grade A | 2 | 3 |
| Other letter grade | 1 | 6 |
Table 7. Second 2X2 scenario.
| cc | Yes | No |
| Letter grade A | 5 | 6 |
| Other letter grade | 2 | 12 |
Table 8. Third 2X2 scenario.
| cc | Yes | No |
| Letter grade A | 10 | 12 |
| Other letter grade | 4 | 24 |
Code hints for tests with direct 2X2 entry with matrix() are
grades.Table <- matrix(c(2,3,1,6), 2, 2, byrow=TRUE)
Chi-square test of independence
chisq.test(grades.Table, correct=FALSE)
Fisher Exact test
fisher.test(grades.Table, alternative = "greater")
Questions
1. Apply Fisher exact test on the four contingency tables (a – d) introduced in section 9.3, question 2. Make note of the p-value from Fisher exact test and from analyses used to complete question 2. Note any trends. (Hint: make sure you are testing the same null hypothesis.)
(a)
| Yes | No | |
| A | 18 | 6 |
| B | 3 | 8 |
(b)
| Yes | No | |
| A | 10 | 12 |
| B | 3 | 14 |
(c)
| Yes | No | |
| A | 5 | 12 |
| B | 12 | 18 |
(d)
| Yes | No | |
| A | 8 | 12 |
| B | 3 | 3 |
Quiz Chapter 9.5
Fisher Exact Test
Chapter 9 contents
7.3 – Conditional Probability and Evidence Based Medicine
- Conditional probability and risk communication
- Probability and independent events
- Example of multiple, independent events
- Probabilistic risk analysis
- Conditional probability of non-independent events
- Diagnosis from testing
- Standard million
- Per capita rate
- Practice and introduce PPV and test decision criteria
- Evidence Based Medicine
- Software
- Example
- Questions
- Quiz
- Chapter 7 contents
Conditional probability and risk communication.
Conditional probabilities can be used to accurately and effectively convey the risk of specific health outcomes to patients and the public. Tools introduced in this chapter help move from an initial assessment of disease risk to a revised probability after a test result is returned. Although there are other interpretations, here we frame EBM — evidence-based-medicine — as a form of Bayesian decision-making.
This sub-chapter covers a lot of ground. We begin by addressing how probability of multiple events are calculated assuming each event is independent. The assumption of independence is then relaxed, and how to determine probability of an event happening given another event has already occurred, conditional probability, is introduced. Use of conditional probability to interpret results of a clinical test are also introduced, along with the concept of EBM. We also introduce Bayes’ rule and Bayesian probability.
Probability and independent events.
Probability distributions are mathematical descriptions of the probabilities of how often different possible outcomes occur. We also introduced basic concepts related to working with the probabilities involving more than one event.
For review, for independent events, you multiply the individual chance that each event occurs to get the overall probability.
Example of multiple, independent events.
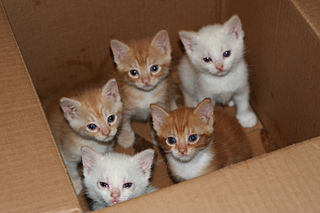
Figure 1. Now that’s a box full of kittens. Creative Commons License, source: https://www.flickr.com/photos/83014408@N00/160490011.
What is the chance of five kittens in a litter of five to be of the same sex? In feral cat colonies, siblings in a litter share the same mother, but not necessarily the same father, superfecundation. Singleton births are independent events, thus the probability of the first kitten is female is 50%; the second kitten is female, also 50%; and so on. We can multiply the independent probabilities (hence, the multiplicative rule), to get our answer:
kittens <- c(0.5, 0.5, 0.5, 0.5, 0.5)
prod(kittens)
[1] 0.03125
Probabilistic risk analysis.
Risk analysis is the use of information to identify hazards and to estimate the risk. A more serious example. Consider the 1986 Space Shuttle Challenger Disaster (Hastings 2003). Among the crew killed was Ellison Onizuka, the first Asian American to fly in space (Fig 2, first on left back row). Onizuka was born and raised on Hawai`i and graduated from Konawaena High School in 1964.

Figure 2. STS-51-L crew: (front row) Michael J. Smith, Dick Scobee, Ronald McNair; (back row) Ellison Onizuka, Christa McAuliffe, Gregory Jarvis, Judith Resnik. Image by NASA – NASA Human Space Flight Gallery, Public Domain.
The shuttle was destroyed just 73 seconds after lift off (Fig 3).

Figure 3. Space Shuttle Challenger launches from launchpad 39B Kennedy Space Center, FL, at the start of STS-51-L. Hundreds of shorebirds in flight. Image by NASA – NASA Human Space Flight Gallery, Public Domain.
This next section relies on material and analysis presented in the Rogers Commission Report June 1986. NASA had estimated that the probability of one engine failure would be 1 in 100 or 0.01; two engine failures would mean the shuttle would be lost. Thus, the probability of two rockets failing at the same time was calculated as 0.01 X 0.01, which is 0.0001 or 0.01%.
NASA had planned to fly the fleet of shuttles 100 times per year, which would translate to a shuttle failure once in 100 years. The Challenger launch on January 28, 1986, represented only the 25th flight of the shuttle fleet.
One difference on launch day was that the air temperature at Cape Canaveral was quite low for that time of year, as low as 22 °F overnight.
Attention was pointed at the large O-rings in the boosters (engines). In all, there were six of these O-rings. Testing suggested that, at the colder air temperatures, the chance that one of the rings would fail was 0.023. Thus, the chance of success was only 0.977. Assuming independence, what is the chance that the shuttle would experience O-ring failure?
shuttle <- c(0.977, 0.977, 0.977, 0.977, 0.977, 0.977)
#probability of success then was
prod(shuttle)
[1] 0.869

#and therefore probability of failure was
1 - prod(shuttle)
[1] 0.1303042
Conditional probability of non-independent events.
But in many other cases, independence of events cannot be assumed. The probability of an event given that another event has occurred is referred to as conditional probability. Conditional probability is used extensively to convey risk. We’ve touched on some of these examples already:
- the risk of subsequent coronary events given high cholesterol;
- the risk of lung cancer given a person smokes tobacco;
- the risk of mortality from breast cancer given that regular mammography screening was conducted.
There are many, many examples in medicine, insurance, you name it. It is even an important concept that judges and lawyers need to be able to handle (eg, discussion in Berry 2008).
A trigger warning: what follows is emotional, traumatic material, provided to emphasize the importance of these concepts, and the far-reaching implications understanding conditional probability can have for us.
A now famous example of conditional probability in the legal arena came from arguments over the chance that a husband or partner who beats his wife will subsequently murder her — this was an argument raised by the prosecution during pre-trial in the 1995 O.J. Simpson trial (The People of the State of California v. Orenthal James Simpson), and successfully argued by O.J. Simpson’s attorneys… judge ruled in favor of the defense and evidence of O.J. Simpson’s prior abuse were not included in trial. Gigerenzer (2002, following discussions by others, eg, Good 1995) and others (eg, Skorupski and Wainer 2015), have called this the Defendent’s Fallacy, the reverse of the Prosecutor’s Fallacy, where the more typical scenario is that the prosecution provides a list of probabilities about characteristics of the defendant, leaving the jury to conclude that no one else could have possibly fit the description ( and 1987).
In the O.J. Simpson case, the argument went something like this. From the CDC we find that the chance of an average woman being murdered by a stranger or an unrelated party was about 1 in 20,000. CDC statistics indicate 1.3 million women are abused each year by their partner or former partner; each year about 1000 women are murdered. One thousand divided by 1.3 million is a small number, so even when there is abuse the argument goes, 99% of the time there is not murder. The Simpson judge ruled in favor of the defense and much of the evidence of prior abuse was excluded.
Something is missing from the defense’s argument. Nicole Brown Simpson did not belong to a population of battered women — she belonged to the population of murdered women. When we ask, if a woman is murdered, what is the chance that she knew her murderer, we find that more than 55% knew their murderer — and of that 55%, 93% were killed by a partner who had a history of prior abuse against the victim.
Instead of looking at all 1.3 million abused women, we isolate a representative cohort of 100,000 abused women to see what mathematically happens to them in a given year:
Group 1: Murdered by their abuser. According to the defense’s rate of 1 in 2,500:
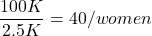
Group 2: Murdered by someone else:
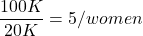
Given that an abused woman was murdered, what is the probability it was done by her abuser?

or 89%.
This is a huge difference from how the Defense portrayed the chance, where they wanted the judge to assume every single one of those 2500 abusers is equally likely to have committed the crime. In reality, we must condition the match on all other available evidence.
The key — Nicole Simpson (and Ron Goldman) were murdered; O.J. Simpson was an ex-partner who had been guilty of assault against Nicole Simpson. Now, it goes from an impossibly small chance, to a much greater chance. Conditional probability, and specifically Bayes’ rule, is used for these kinds of problems. The defense successfully masked a probability that was heavily stacked against their client.
Bayes’ rule provides guidance for how to update the probability of an event based on new evidence. Named after Thomas Bayes (1701- 1761), more generally, Bayes’ rule, described below, is used to quantify conditional probability. Bayesian probability, where probability is interpreted as reasonably expectation instead of frequency of some event. We discuss Bayesian and Frequentist approaches to hypothesis testing in Chapter 8.2.
Note 1: Following our epidemilogy definitions, women murdered by their abuser (Group 2), epidemiology terms, that would be  , the exposure rate in controls, whereas abused woman murdered by her abuser (Group 1), that would be
 , the exposure rate in cases.
Diagnosis from testing.
Let’s turn our attention to medicine. A growing practice in medicine is to claim that decision making in medicine should be based on approaches that give us the best decisions. A search of PubMed texts for “evidence based medicine” found more than 91,944 (13 October 2021, and increase of thirteen thousand since last I looked (10 October, 2019). Evidence based medicine (EBM) is the “conscientious, explicit, judicious and reasonable use of modern, best evidence in making decisions about the care of individual patients” (Masic et al 2008). By evidence, we may mean results from quantitative, systematic reviews, meta-analysis, of research on a topic of medical interest, eg, Cochrane Reviews.
Note 2: Primary research refers to generating or collecting original data in pursuit of tests of hypotheses. Both systematic reviews and meta-analysis are secondary research or “research on research.” As opposed to a literature review, systematic review make explicit how studies were searched for and included; if enough reasonably similar quantitative data are obtained through this process, the reviewer can combine the data and conduct an analysis to assess whether a treatment is effective (De Vries 2018).
As you know, no diagnostic test is 100% fool-proof. For many reasons, test results come back positive when the person truly does not have the condition — this is a false positive result. Correctly identifying individuals who do not have the condition, 100% – false positive rate, is called the specificity of a test.
Think of specificity in this way — provide the test 100 true negative samples (eg, 100 samples from people who do not have cancer) — how many times out of 100 does the test correctly return a “negative”? If 99 times out of 100, then the specificity rate for this test is 99%. Which is pretty good. But the test results mean more if the condition/disease is common; for rare conditions, even 99% is not good enough. Incorrect assignments are rare, we believe, in part because the tests are generally quite accurate. However, what we don’t consider is that detection and diagnosis from tests also depend on the base rate — how frequent the incidence of the condition is in the population. Paradoxically, the lower the base rate, the poorer diagnostic value even a sensitive test may have.
Note 3: This concept, that the base rate effects clinical relevance of interpreting testing — has really important, real-world consequences. It directly bears on clinical testing of cancer and other relatively rare diseases; it also dramatically influences applicability of highly sensitive tests for drug use in clinical samples.
To summarize our jargon for interpreting a test or assay, so far we have
- True positive (a), the person has a disease and the test correctly identifies the person as having the disease.
- False positive (b), test result incorrectly identifies disease; the person does not have the disease, but the test classifies the person as having the disease.
- False negative (c), test result incorrectly classifies person does not have disease, but the person actually has the disease.
- True negative (d), the person does not have the disease and the test correctly categorizes the person as not having the disease.
- Positive predictive value (PPV), the proportion of patients with a positive test result who actually have the disease,
 .
- Negative Predictive Value (NPV), the probability that a person who receives a negative test result really does not have the disease,
 .
- Negative Predictive Value (NPV), the probability that a person who receives a negative test result really does not have the disease,
- Sensitivity of test (Se), the proportion of persons who test positive and do have the disease (true positives):
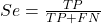
If a test has 75% sensitivity, then out of 100 individuals who do have the disease, then 75 will test positive (TP = true positive). - Specificity of a test (Sp), refers to the rate that a test correctly classifies a person that does not have the disease (TN = true negatives):
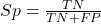
If a test has 90% specificity, then out of 100 individuals who truly do not have the disease, then 90 will test negative (= true negatives).
A worked example. A 50 year old male patient is in the doctor’s office. The doctor is reviewing results from a diagnostic test, eg, a FOBT — fecal occult blood test — a test used as a screening tool for colorectal cancer (CRC). The doctor knows that the test has a sensitivity of about 75% and specificity of about 90%. Prevalence of CRC in this age group is about 0.2% (cf NCI SEER). The prevalence is also the prior probability — the baseline rate of the condition in the population before a test is taken. Figure 4 shows our probability tree using our natural numbers approach (Fig 4).
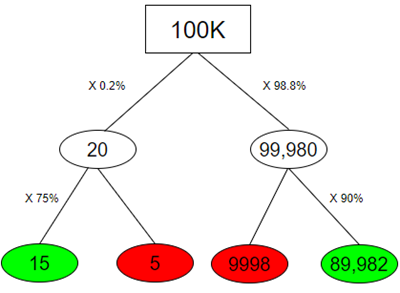
Figure 4. Probability tree for FOBT test; Good test outcomes shown in green: TP stands for true positive and TN stands for true negative. Poor outcomes of a test shown in red: FN stands for false negative and FP stands for false positive.
Note 4: Since U.S. Preventative Task Force (2021), FOBT has largely been replaced by Fecal Immunochemical Test (FIT): sensitivity 74%, specificity 95%, and Multitarget Stool DNA Test: sensitivity 76%, specificity 90%. Cologuard combines both: sensitivity 92%, specificity 97% (cf discussion in Imperiale et al 2014).
- The U.S. Supreme Court (Kennedy v. Braidwood Management, Inc) supported USPSTF’s authority to recommend preventive services covered by insurers (see 2025 article by R. Payerchin in Medical Economics).
The associated probabilities for the four possible outcomes of these kinds of tests (eg, what’s the probability of a person who has tested positive in screening tests actually has the disease?) are shown in Table 1.
Table 1. A 2 X 2 table of possible outcomes of a diagnostic test.
| Person really has the disease | ||
| Test Result | Yes | No |
| Positive | a TP |
b FP |
| Negative | c FN |
d TN |
We want the posterior probability — the chance that a positive test result is a true positive. Bayes’ rule is often given in probabilities,

Bayes’ rule, where truth is represented by either D (the person really does have the disease”) or ND (the person really does not have the disease”) and ⊕ is symbol for “exclusive or” and reads “not D” in this example.
An easier way to see this is to use frequencies and our table instead (Table 1, numbers in Figure 4).
Now, the formula is

Simplified Bayes’ rule, where a is the number of people who test positive and DO HAVE the disease and b is the number of people who test positive and DO NOT have the disease. Thus,  , the posterior probability was

or 0.15%. Because the condition is so rare (0.2% prior) and the test generates a very high number of False Positives (9,998), getting a positive result actually lowers oour confidence slightly from the base rate (from 0.2% down to 0.15%). This occurs because the test is highly unreliable in screening this specific population — it’s known as the base rate fallacy. Thus, the chance that a positive FOBT test for our 50 year old male patient is 99.85% likely wrong.
Standardized million.
Where did the 100,000 come from? We discussed this in chapter 2: it’s a simple trick to adjust rates to the same population size. We use this to work with natural numbers instead of percent or frequencies. You choose to correct to a standardized population based on the raw incidence rate. A rough rule of thumb:
Table 2. Relationship between standard population size and incidence rate.
| Raw IR rate about | IR | Standard population |
| 1/10 | 10% | 1000 |
| 1/100 | 1% | 10,000 |
| 1/1000 | 0.1% | 100,000 |
| 1/10,000 | 0.01% | 1,000,000 |
| 1/100,000 | 0.001% | 10,000,000 |
| 1/1,000,000 | 0.0001% | 100,000,000 |
The raw incident rate is simply the number of new cases divided by the total population.
Per capita rate.
Yet another standard manipulation is to consider the average incidence per person, or per capita rate. The Latin “per capita” translates to “by head” (Google translate), but in economics, epidemiology, and other fields it is used to reflect rates per person. Tuberculosis is a serious infectious disease of primarily the lungs. Incidence rates of tuberculosis in the United States have trended down since the mid 1900s: 52.6 per 100K in 1953 to 2.7 per 100K in 2019 (CDC). Corresponding per capita values are 5.26 x 10⁻⁴ and 2.7 x 10⁻⁵, respectively. Divide the rate by 100,000 to get per person rate.
Practice and introduce PPV and test decision criteria.
Let’s break these problems down, and in doing so, introduce some terminology common to the field of “risk analysis” as it pertains to evaluating assay and diagnotistc tests in biology and epidemiology. Our first example considers the fecal occult blood test, FOBT, test. Blood in the stool may (or may not) indicate polys or colon cancer (Park et al 2010).
A table like the one shown above (Table 1) will appear again and again throughout this and subsequent chapters, but in different forms. We start with Table 3.
Table 3. A 2 X 2 table of possible outcomes of FOBT test.
| Person really has the disease | |||
| Yes | No | ||
| Positive | 15 | 9998 | PPV = 15/(15+9998) = 0.15% |
| Negative | 5 | 89,982 | NPV = 89982/(89982+5) = 99.99% |
We want to know how good is the test, particularly if the goal is early detection? This is conveyed by the PPV, positive predictive value of the test. Unfortunately, the prevalence of a condition is also at play: the lower the prevalence, the lower the PPV must be, because most positive tests will be false when population prevalence is low.
Youden (1950) proposed a now widely adopted index that summarizes how effective a test is. Youden’s J is the sum of specificity and sensitivity minus one.

where Se stands for sensitivity of the test and Sp stands for sensitivity of the test.
Youden’s J takes on values between 0, for a terrible test, and 1, for a perfect test. For our FOBT example, Youden’s J was 0.65. This statistic looks like it’s independent of prevalence, but it’s use as a decision criterion (eg, a cutoff value, above which test is positive, below test is considered negative), assumes that the cost of misclassification (false positives, false negatives) are equal. Prevalence affects number of false positives and false negatives for a given diagnostic test, so any decision criterion based on Youden’s J will also be influenced by prevalence (Smits 2010).
Youden’s J is insensitive to base rates and therefore may be of little practical use in the field. Unsurprisingly, other tools are available, including Matthew’s Correlation Coefficient (MCC),

and the positive and negtive Clinical Utility Index (CUI+, CUI-),

or the F1-score,

epiR will calculate Youden’s J, but the others are either calculated by hand or by way of additional packages. So, we’ll provide a function.
R code to calculate testing decision criteria — code genereated with Gemini AI assistance.
run_screening_wizard <- function() {
# 1. Sequential user prompts starting with cell a
cat("--- 2x2 Matrix Entry Wizard ---\n")
a <- as.numeric(readline(prompt = "Enter cell a (True Positives, TP): "))
b <- as.numeric(readline(prompt = "Enter cell b (False Positives, FP): "))
c <- as.numeric(readline(prompt = "Enter cell c (False Negatives, FN): "))
d <- as.numeric(readline(prompt = "Enter cell d (True Negatives, TN): "))

# 2. Map cells to short variables for calculation
tp <- a
fp <- b
fn <- c
tn <- d

# 3. Construct and print the visual 2x2 matrix
user_matrix <- matrix(
c(tp, fp, fn, tn),
nrow = 2,
byrow = TRUE,
dimnames = list(Test = c("+", "-"), Disease = c("+", "-"))
)
cat("\n[+] Captured Matrix:\n")
print(user_matrix)

# 4. Run background metrics math
sensitivity <- tp / (tp + fn)
specificity <- tn / (tn + fp)
ppv <- tp / (tp + fp)
if (is.nan(ppv)) ppv <- 0

youden_j <- sensitivity + specificity - 1
cui_pos <- sensitivity * ppv

f1_score <- 2 * ((ppv * sensitivity) / (ppv + sensitivity))
if (is.nan(f1_score)) f1_score <- 0

mcc_num <- (tp * tn) - (fp * fn)
mcc_den <- sqrt(as.numeric(tp + fp) * as.numeric(tp + fn) *
as.numeric(tn + fp) * as.numeric(tn + fn))
mcc <- if (mcc_den == 0) 0 else mcc_num / mcc_den

# 5. Compile into the copy/paste ready console matrix
output_matrix <- matrix(
c(round(youden_j, 4), "No", "Good (Overly optimistic baseline)",
round(mcc, 4), "Yes", "Poor (Correctly captures imbalance)",
round(cui_pos, 4), "Yes", "Unacceptable clinical utility",
round(f1_score, 4), "Yes", "Near-total prediction failure"),
nrow = 4, byrow = TRUE
)

dimnames(output_matrix) <- list(
c("Youden's J Index", "MCC", "CUI+", "F1-Score"),
c("Value", "Base_Rate_Dep", "Console_Interpretation")
)

final_df <- as.data.frame(output_matrix)

# 6. Print and invisibly return the dataframe
cat("\n[+] Resulting Metrics Table (Copy/Paste Ready):\n")
print(final_df)
return(invisible(final_df))
}

# Run the function at the R command prompt.
run_screening_wizard()
End R code.
Thus, using a metric sensitive to low base rate, our FOBT tests are (modified from R output)
Table 4. Decision criteria.
| Value | Base rate dependent? | Interpretation | |
 |
0.65 | No | Good |
 |
0.0306 | Yes | Poor |
 |
0.0011 | Yes | Unacceptable clinical utility |
 |
0.0030 | Yes | Near-total prediction failure |
Another worked example. A study on cholesterol-lowering drugs (statins) reported a relative risk reduction of death from cardiac event by 22%. This does not mean that for every 1000 people fitting the population studied, 220 people would be spared from having a heart attack. In the study, the death rate per 1000 people was 32 for the statin versus 41 for the placebo — recall that a placebo is a control treatment offered to overcome potential patient psychological bias (see Chapter 5.4). The absolute risk reduction due to statin is only 41 – 32 or 9 in 1000 or 0.9%. By contrast, relative risk reduction is calculated as the ratio of the absolute risk reduction (9) divided by the proportion of patients who died without treatment (41), which is 22% (LIPID Study Group 1998).
Note that risk reduction is often conveyed as a relative rather than as an absolute number. The distinction is important for understanding arguments based in conditional probability. Thus, the question we want to ask about a test is summarized by absolute risk reduction (ARR) and number needed to treat (NNT), and for problems that include control subjects, relative risk reduction (RRR). We expand on these topics in the next section, 7.4 – Epidemiology: Relative risk and absolute risk, explained.
Evidence Based Medicine.
One culture change in medicine is the explicit intent to make decisions based on evidence (Masic et al 2008). Of course, the joke then is, well, what were doctors doing before, diagnosing without evidence? The comic strip xkcd offers one possible answer (Fig 5).
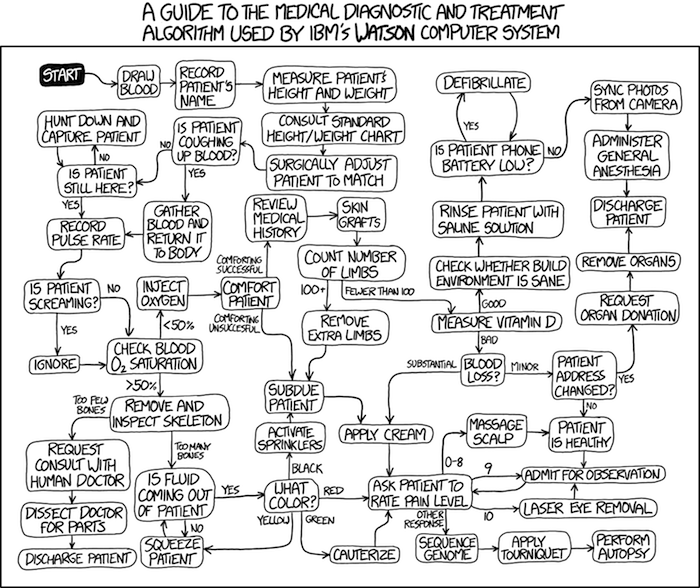
Figure 5. A summary of “evidence based medical” decisions, perhaps? “Watson Medical Algorithm,” https://xkcd.com/1619/.
As you can imagine, there’s considerable reflection about the EBM movement (see discussions in response to Accad and Francis 2018, eg, Goh 2018). More practically, our objective is for you to be able to work your way through word problems involving risk analysis. You can expect to be asked to calculate, or at least set up for calculation, any of the statistics listed above (eg, False negative, false positive, etc.). Practice problems are listed at the end of this section, and additional problems are provided to you (Homework 4). You’ll also want to check your work, and in any real analysis, you’d most likely want to use R.
Software.
R has several epidemiology packages, and with some effort, can save you time. Another option is to run your problems in OpenEpi, a browser-based set of tools. OpenEpi is discussed with examples in the next section, 7.4.
Here, we illustrate some capabilities of the epiR package, expanded more also in the next section, 7.4. We’ll use the example from Table 3.
R code
library(epiR)
Table3 <- matrix(c(15, 5, 9998, 89982), nrow = 2, ncol = 2)
epi.tests(Table3)
R output
         Outcome + Outcome -   Total
Test +          15      9998   10013
Test -           5     89982   89987
Total           20     99980  100000

Point estimates and 95% CIs:
--------------------------------------------------------------
Apparent prevalence *                      0.10 (0.10, 0.10)
True prevalence *                          0.00 (0.00, 0.00)
Sensitivity *                              0.75 (0.51, 0.91)
Specificity *                              0.90 (0.90, 0.90)
Positive predictive value *                0.00 (0.00, 0.00)
Negative predictive value *                1.00 (1.00, 1.00)
Positive likelihood ratio                  7.50 (5.82, 9.67)
Negative likelihood ratio                  0.28 (0.13, 0.59)
False T+ proportion for true D- *          0.10 (0.10, 0.10)
False T- proportion for true D+ *          0.25 (0.09, 0.49)
False T+ proportion for T+ *               1.00 (1.00, 1.00)
False T- proportion for T- *               0.00 (0.00, 0.00)
Correctly classified proportion *          0.90 (0.90, 0.90)
--------------------------------------------------------------
* Exact CIs
Oops! I wanted PPV, which by hand calculation was 0.15%, but R reported “0.00?” This is a significant figure reporting issue. The simplest solution is to submit options(digits=6) before the command, then save the output from epi.tests() to an object and use summary(). For example
options(digits=6)
myEpi <- epi.tests(Table3)
summary(myEpi)
And R returns
     statistic           est        lower        upper
1           ap  0.1001300000 0.0982761568  0.102007072
2           tp  0.0002000000 0.0001221693  0.000308867
3           se  0.7500000000 0.5089541283  0.913428531
4           sp  0.9000000000 0.8981238085  0.901852950
5      diag.ac  0.8999700000 0.8980937508  0.901823014
6      diag.or 27.0000000000 9.8110071871 74.304297826
7         nndx  1.5384615385 1.2265702376  2.456532054
8       youden  0.6500000000 0.4070779368  0.815281481
9       pv.pos  0.0014980525 0.0008386834  0.002469608
10      pv.neg  0.9999444364 0.9998703379  0.999981958
11      lr.pos  7.5000000000 5.8193604069  9.666010707
12      lr.neg  0.2777777778 0.1300251423  0.593427490
13      p.rout  0.8998700000 0.8979929278  0.901723843
14       p.rin  0.1001300000 0.0982761568  0.102007072
15      p.tpdn  0.1000000000 0.0981470498  0.101876192
16      p.tndp  0.2500000000 0.0865714691  0.491045872
17      p.dntp  0.9985019475 0.9975303919  0.999161317
18      p.dptn  0.0000555636 0.0000180416  0.000129662
There we go — pv.pos reported as 0.0014980525, which, after turning to a percent and rounding, we have 0.15%. Note also the additional statistics provided — a good rule of thumb — always try to save the output to an object, then view the object, eg, with summary(). Refer to help pages for additional details of the output (?epi.tests).
What about R Commander menus?
Note 3: Confirmed Fall 2026 — I have not been able to run the EBM plugin successfully! Simply returns an error message — — on data sets which have in the past performed perfectly. Thus, until further notice, do not use the EBM plugin. Instead, use commands in the epiR package. I’m leaving the text here on the chance the error with the plugin is fixed.
Rcmdr has a plugin that will calculate ARR, RRR and NNT. The plugin is called RcmdrPlugin.EBM (Leucuta et al 2014) and it would be downloaded as for any other package via R.
Download the package from your selected R mirror site, then start R Commander.
install.packages("RcmdrPlugin.EBM")
From within R Commander (Fig 6), select
Tools → Load Rcmdr plug-in(s)…
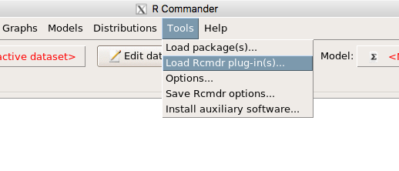
Figure 6. To install an Rcmdr plugin, first go to Rcmdr → Tools → Load Rcmdr plug-in(s)…
Next, select from the list the plug-in you want to load into memory, in this case, RcmdrPlugin.EBM (Fig 7).
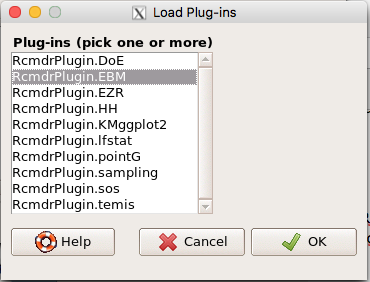
Figure 7. Select the Rcmdr plugin, then click the “OK” button to proceed.
Restart Rcmdr again (Fig 8),
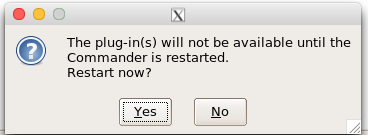
Figure 8. Select “Yes” to restart R Commander and finish installation of the plug-in.
and the menu “EBM” should be visible in the menu bar (Fig 9).
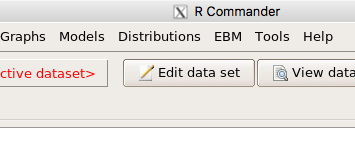
Figure 9. After restart of R Commander the EBM plug-in is now visible in the menu.
Note that you will need to repeat these steps each time you wish to work with a plug-in, unless you modify your .RProfile file. See
Rcmdr → Tools → Save Rcmdr options…
Clicking on the EBM menu item brings up the template for the Evidence Based Medicine module. We’ll mostly work with 2 X 2 tables (eg, see Table 1) , so select the “Enter two-way table…” option to proceed (Fig 10).
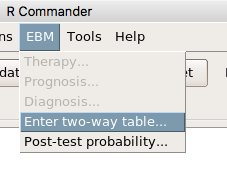
Figure 10. Select “Enter two-way table…”.
And finally, Figure 11 shows the two-way table entry cells along with options. We’ll try a problem by hand then use the EBM plugin to confirm and gain additional insight.
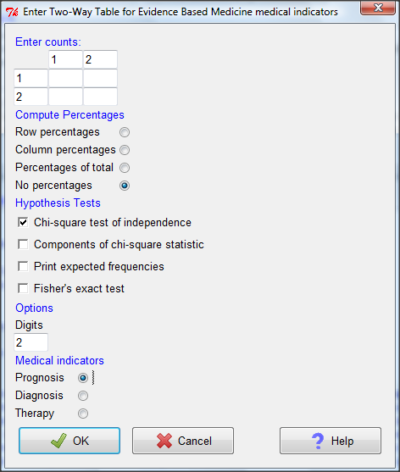
Figure 11. Two-way table Rcmdr EBM plug-in.
For assessing how good a test or assay is, use the Diagnosis option in the EBM plugin. For situations with treated and control groups, use Therapy option. For situations in which you are comparing exposure groups (eg, smokers vs non-smokers), use the Prognosis option.
Example.
Here’s a simple one (problem from Gigerenzer 2002).
About 0.01% of men in Germany with no known risk factors are currently infected with HIV. If a man from this population actually has the disease, there is a 99.9% chance the tests will be positive. If a man from this population is not infected, there is a 99.9% chance that the test will be negative. What is the chance that a man who tests positive actually has the disease?
Start with the reference, or base population (Figure 12). It’s easy to determine the rate of HIV infection in the population if you use numbers. For 10,000 men in this group, exactly one man is likely to have HIV (0.0001X10,000), whereas 9,999 would not be infected.
For the man who has the disease it’s virtually certain that his results will be positive for the virus (because the sensitivity rate = 99.9%). For the other 9,999 men, one will test positive (the false positive rate = 1 – specificity rate = 0.01%).
Thus, for this population of men, for every two who test positive, one has the disease and one does not, so the probability even given a positive test is only 100*1/2 = 50%. This would also be the test’s Positive Predictive Value.
Note that if the base rate changes, then the final answer changes! For example, if the base rate was 10%
It also helps to draw a tree to help you determine the numbers (Fig 12)
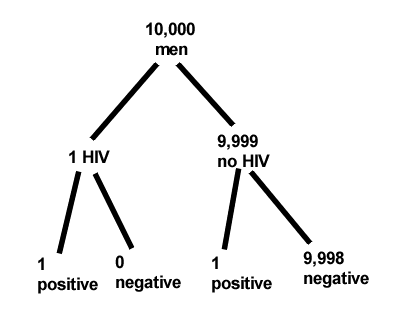
Figure 12. Draw a probability tree to help with the frequencies.
From our probability tree in Figure 12 it is straight-forward to collect the information we need.
- Given this population, how many are expected to have HIV? Two.
- Given the specificity and sensitivity of the assay for HIV, how many persons from this population will test positive? Two.
- For every positive test result, how many men from this population will actually have HIV? One.
Thus, given this population with the known risk associated, the probability that a man testing positive actually has HIV is 50% (=1/(1+1)).
Use the EBM plugin. Select two-way table, then enter the values as shown in Fig 13.
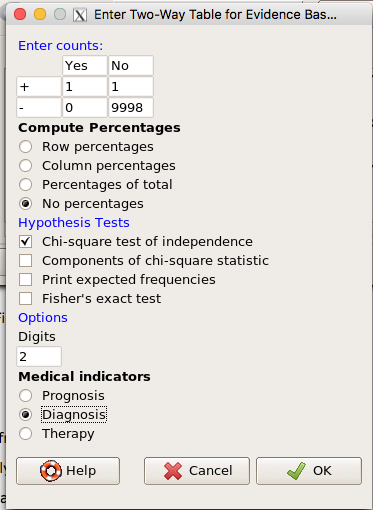
Figure 13. EBM plugin with data entry.
Select the “Diagnosis” option — we are answering the question: How probable is a positive result given information about sensitivity and specificity of a diagnosis test. The results from the EBM functions are given below
Rcmdr> .Table
      Yes No
   +  1    1
   -  0 9998
Rcmdr> fncEBMCrossTab(.table=.Table, .x='', .y='', .ylab='', .xlab='',
Rcmdr+ .percents='none', .chisq='1', .expected='0', .chisqComp='0', .fisher='0',
Rcmdr+ .indicators='dg', .decimals=2)
# Notations for calculations
        Disease + Disease -
Test +      "a"         "b"
Test -      "c"         "d"
# Sensitivity (Se) = 100 (95% CI 2.5 - 100) %. Computed using formula: a / (a + c)
# Specificity (Sp) = 99.99 (95% CI 99.94 - 100) %. Computed using formula: d / (b + d)
# Diagnostic accuracy (% of all correct results) = 99.99 (95% CI 99.94 - 100) %. Computed using formula: (a + d) / (a + b + c + d)
# Youden's index = 1 (95% CI 0.02 - 1). Computed using formula: Se + Sp - 1
# Likelihood ratio of a positive test = 9999 (95% CI 1408.63 - 70976.66). Computed using formula: Se / (Sp - 1)
# Likelihood ratio of a negative test = 0 (95% CI 0 - NaN). Computed using formula: (1 - Se) / Sp
# Positive predictive value = 50 (95% CI 1.26 - 98.74) %. Computed using formula: a / (a + b)
# Negative predictive value = 100 (95% CI 99.96 - 100) %. Computed using formula: d / (c + d)
# Number needed to diagnose = 1 (95% CI 1 - 40.91). Computed using formula: 1 / [Se - (1 - Sp)]
Note that the formulas used to calculate Sensitivity, Specificity, etc., follow our Table 1 (compare to “Notations for calculations”). The use of EBM provides calculations of our confidence intervals.
Questions.
- The sensitivity of the fecal occult blood test (FOBT) is reported to be 0.68. What is the False Negative Rate?
- The specificity of the fecal occult blood test (FOBT) is reported to be 0.98. What is the False Positive Rate?
- For men between 50 and 54 years of age, the rate of colon cancer is 61 per 100,000. If the false negative rate of the fecal occult blood test (FOBT) is 10%, how many persons who have colon cancer will test negative?
- For men between 50 and 54 years of age, the rate of colon cancer is 61 per 100,000. If the false positive rate of the fecal occult blood test (FOBT) is 10%, how many persons who do not have colon cancer will test positive?
- A study was conducted to see if mammograms reduced mortality
Mammogram Deaths/1000 women No 4 Yes 3 data from Table 5-1 p. 60 Gigerenzer (2002)
What is the RRR? - A study was conducted to see if mammograms reduced mortality
Mammogram Deaths/1000 women No 4 Yes 3 data from Table 5-1 p. 60 Gigerenzer (2002)
What is the NNT? - Does supplemental Vitamin C decrease risk of stroke in Type II diabetic women? A study conducted on 1923 women, a total of 57 women had a stroke, 14 in the normal Vitamin C level and 32 in the high Vitamin C level. What is the NNT between normal and high supplemental Vitamin C groups?
- Sensitivity of a test is defined as
A. False Positive Rate
B. True Positive Rate
C. False Negative Rate
D. True Negative Rate - Specificity of a test is defined as
A. False Positive Rate
B. True Positive Rate
C. False Negative Rate
D. True Negative Rate - In thinking about the results of a test of a null hypothesis, Type I error rate is equivalent to
A. False Positive Rate
B. True Positive Rate
C. False Negative Rate
D. True Negative Rate - During the Covid-19 pandemic, number of reported cases each day were published. For example, 155 cases were reported for 9 October 2020 by Department of Health. What is the raw incident rate?
Quiz Chapter 7.3
Conditional Probability and Evidence Based Medicine
Chapter 7 contents
- Introduction
- Epidemiology definitions
- Epidemiology basics
- Conditional Probability and Evidence Based Medicine
- Epidemiology: Relative risk and absolute risk, explained
- Odds ratio
- Confidence intervals
- References and suggested readings
6.5 – Discrete probability distributions
Binomial distribution
Discrete refers to particular outcomes — data that take on only specific separate values. Discrete data types include all of the categorical types we introduced earlier, including binary, ordinal, and nominal.
The binomial probability distribution is a discrete distribution for the number of successes, k, in a sequence of n independent trials, where the outcome of each trial can take on only one of two possible outcomes. For cases of 0 or 1, yes or no, “heads” or “tails,” male or female, pass or fail, we talk about the binomial distribution, because the outcomes are discrete and there can be only two possible (binary) outcomes.
Note 1: The biological definition of sex is binary — whether sexually reproducing organism produces male (sperm) or female (ovum) gametes (cf discussion in Goymann et al 2022). For the argument that sex is a continuum held by some biomedical and social scientists, see Ainsworth 2015.
The mathematical function of the binomial is written as

where the binomial coefficient is given by
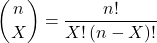
and X refers to the number of ways to choose “success” from n observations.
Consider an example.
We have to define what we mean by success. For coin toss, this might be the number of heads.
The mean for the binomial this is given simply as

where X is “Heads” (the category of successes for our example), and p corresponds to the probability the selected event occurs, in this case, “Heads.”
The variance of the binomial distribution is given by

Here’s a density plot of two trials with success 2% with n (x) equal to 20 (Fig 1).
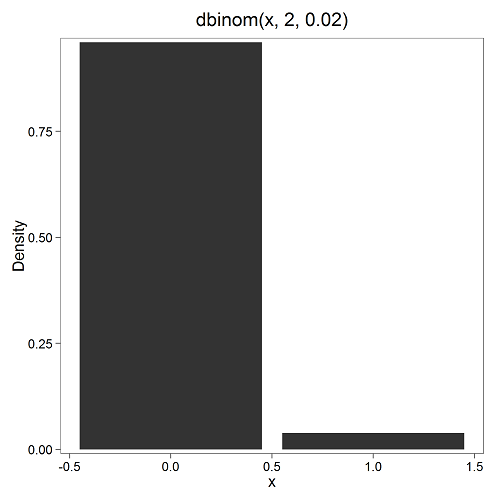
Figure 1. Plot generated with KMggplot2 Rcmdr plugin.
Here’s the R code
Create the trials, 1 through 20, then create an object to hold the number of trials
nSize=1:20
Size <- length(nSize); Size
R returns
[1] 20
Assign the probability value to an object
prob <- 0.02
Next, calculate the mean, mu, and the variance, var, for the binomial with prob = 0.02 and number of trials Size = 20
mu <- Size*prob
var <- Size*prob*(1-prob)
Print the mean and variance; lets assign them to an object then print the object
stats <- c(mu, var); stats
And R returns
[1] 0.400 0.392
And here’s a real-world example. Twinning in humans is rare. In Hawaiʻi in the 1990’s the rate of twin births (monozygotic and dizygotic) was about 20 for every 1000 births or 2%. “Success” here then is twin births.
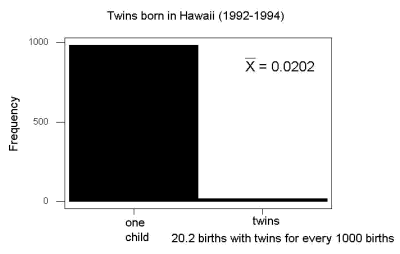
Figure 2. Example of binomial-like distribution: reported twins born in Hawaiʻi.
Interestingly, rates of twins have since increased in Hawaiʻi (31 out of 1000 births) and in the United States overall (33 out of 1000 births) (Table 2, NCHS Data Brief No. 80, 2012). Data for Fig 2 were for year 2009.
Out of ten births, what is the probability of two twin births in Hawaiʻi?

You can solve this with your calculator (yikes!), or take advantage of online calculators (GraphPad QuickCalcs), or use R and Rcmdr.
In R, simply type at the prompt
dbinom(2,10,0.031)
[1] 0.03361446
Try in R Commander.
Rcmdr → Distributions → Discrete distributions → Binomial distribution → Binomial probabilities …

Figure 3. Rcmdr menu to get binomial probability.
Note I used p = 0.033 the rate for entire USA. Here’s the output
> .Table <- data.frame(Pr=dbinom(0:10, size=10, prob=0.033))
> rownames(.Table) <- 0:10
> .Table
Pr
0  7.149320e-01
1  2.439789e-01
2  3.746728e-02 ← Answer, 0.0375 or 3.75%
3  3.409639e-03
4  2.036263e-04
5  8.338782e-06
6  2.371422e-07
7  4.624430e-09
8  5.918028e-11
9  4.487991e-13
10 1.531579e-15
And here is the output for our example from Hawaiʻi (p = 0.031).
> .Table <- data.frame(Pr=dbinom(0:10, size=10, prob=0.031))
> rownames(.Table) <- 0:10
> .Table
Pr
0  7.298570e-01
1  2.334940e-01
2  3.361446e-02 ← Answer, 0.0336 or 3.36%
3  2.867694e-03
4  1.605494e-04
5  6.163507e-06
6  1.643178e-07
7  3.003893e-09
8  3.603741e-11
9  2.561999e-13
10 8.196283e-16
We use the binomial distribution as the foundation for the binomial test, ie, the test of an observed proportion against an expected population level proportion in a Bernoulli trial.
Hypergeometric distribution
The binomial distribution is used for cases of sampling with replacement from a population. When sampling without replacement is done, the hypergeometric distribution is used. It is the number of successes, k, in a sequence of n independent trials drawn from a fixed population.
Note 2: A fixed population in epidemiology refers to a group of individuals, defined by set of characteristics. Examples include individuals selected because they all share a common life event, eg, giving birth. The population is “fixed” because, once an individual is included in the population, they remain a member of the population even if their characteristics change during the duration of the study. The opposite of a fixed population is an dynamic or open population. Definitions from Chapter 2 in Aschengrau and Seage (2003).
This sampling scheme means that each draw is no longer independent — with each draw you decrease the remaining number of observations and thus change the proportion.
The P-value from the hypergeometric distribution is often used to study if genes from a list of Gene Ontology (eg, biological process functional terms like “cell cycle,” or “apoptosis”) are enriched in the sets of genes with expression differences across the treatment groups (cf, discussion in Cao and Zhang 2014). The R package gprofiler2, which links to a Cloud service at g:Profiler, the can be used to do gene enrichment analyses with stunning visualizations (eg, Manhattan plot) suitable for publication.
The mathematical function of the hypergeometric is written as

where N is the population size, K is the number of successes in that population, and n and k are defined as above. Lets look apply this to the twinning problem.
In 2009, 2200 women gave birth in Hawaiʻi County, Hawaiʻi. Out of 10 births, what is the probability of 2 twin births in Hawaiʻi?
Assuming “risk” of twinning is the same rate as in rest of USA, then we have expected 72 successes in this population (0.033 * 2200).
Here’s the graph (Fig 4).
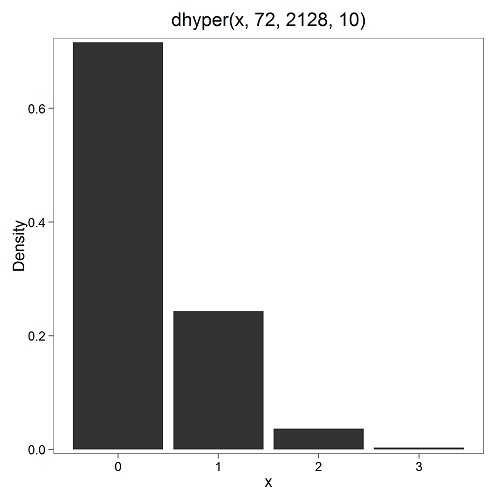
Figure 4. Plot of hypergeometric distribution twinning Hawaiʻi.
where the X axis values shows the number of events with successes (twin births). Taking the bin 2 (we wanted to know about probability of 2 out of ten), we can draw a line back to the Y-axis to get our probability — looks like about 5% roughly. Plot drawn with KMggplot2
To get the actual probability,
Rcmdr → Distributions → Discrete distributions → Hypergeometric distribution → Hypergeometric probabilities …
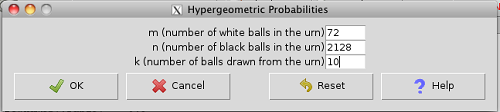
Figure 5. Rcmdr menu to get hypergeometric probability.
where m is the number of successes, n is the number of “failures,” and k is the number of trials.
> .Table
Pr
0 0.716453457
1 0.243438645
2 0.036688041 ← Answer, 0.0367 or 3.67%
3 0.003228871
The reference to white and black balls and urns is a device described by Bernoulli himself and has been used by others ever since to discuss probability problems (called the urn problem) and so I apply it here to be consistent. The urn contains a number of white (x) and a number of black (y) balls mixed together. One ball is drawn randomly from the urn — what color is it? The ball is then is either returned into the urn (replacement) or it is left out (without replacement) as in the hypergeometric problem, and the selection process is repeated.
Besides applications in gambling and balls-in-urns problems, this distribution is the basis for many tests of gene enrichment from microarray analyses. The hypergeometric forms the basis of the Fisher Exact test (see Chapter 9.5).
Discrete uniform distribution
For discrete cases of “1,” “2,” “3,” “4,” “5,” or “6,” on the single toss of fair dice, we can talk about the discrete uniform distribution because all possible outcomes are equally likely. If you are branded as a “card-counter” in Las Vegas, all you’ve done is reached an understanding of the uniform distribution of card suits!
One biological example would be the fate of a random primary oocyte in the human (mammal) female — three out of four will become polar bodies, eventually reabsorbed, whereas one in four will develop into a secondary oocyte (egg); the uniform distribution has to do with the counts of the products — each of the four primary oocytes has the same (apparently) chance (25%) of becoming the egg (Edwards and Beard 1997).
Analyses in biological research often use a uniform distribution as a baseline or null model (Gotelli and Ulrich 2011). For DNA sequencing, the uniform distribution provides a baseline for assessing coverage bias, eg, GC bias (Ross et al 2013). The uniform distribution underlies the Jukes–Cantor evolutionary model. The Jukes–Cantor model assumes equal substitution rates among all four nucleotides (A, T, C, G) and equal base frequencies (Felsenstein 2003).
The uniform distribution exists also for continuous data types, where every value within a specified interval has equal probability density. For example, DNA shearing — by endonucleases, proteases, or tansposases — during initial library prep for sequencing reactions, breakpoints may be modeled as uniformly distributed along fragment length. Non-uniform distributions reveal cleavage bias. Sequence-dependent cleavage bias is concluded when certain DNA fragments or sequences are generated or detected more (or less) frequently than would be expected by chance (Meyer and Liu 2014). This generates many false positives — that is, identifying a biological signal or molecule that isn’t actually there (Nix et a; 2008).
Poisson distribution
An extension from the binomial case is that, rather than following success or failure, you may have the following scenario. Consider a wind-dispersed seed released from a plant. If we markup the area around the plant in grids, we could then count the number of seeds within each grid. Most grids will have no seeds, some grids will have one seed, a few grids may have two seeds, etc. Multiple seeds in grids is a rare event. The graph might look like
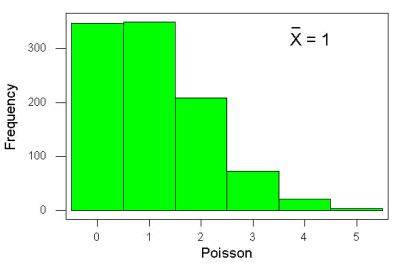
Figure 6. Example, poisson-like graph: the number of wind-dispersed seeds within each grid.
In molecular biology, use of Poisson distribution is common. In digital PCR for example, a DNA sample is diluted and divided into thousands of small reaction volumes or partitions. Thus, each partition contains either zero molecules, one molecule, or more than one molecule, where the loading of molecules into partitions is assumed to be independent, random, and rare per partition. In sequencing, Poisson models are used to describe random sampling of molecules and reads, especially when coverage is generated by non-deterministic processes like shotgun sequencing.
The Poisson has interesting properties, one being that the expected mean, λ, is equal to the variance. Lambda is, with respect to the Poisson distribution, the average number of times an event happens over a specific period or area.
An equation is

where μ is the mean (or could substitute with variance!), e is the natural logarithm, and X is number of successes you are interested in. For example, if μ = 1, what is the probability of observing a grid with five seeds? Simple enough to do this by hand, but let’s use Rcmdr instead. Here’s the graph (Fig 7) from Rcmdr (KMggplot2 plugin).
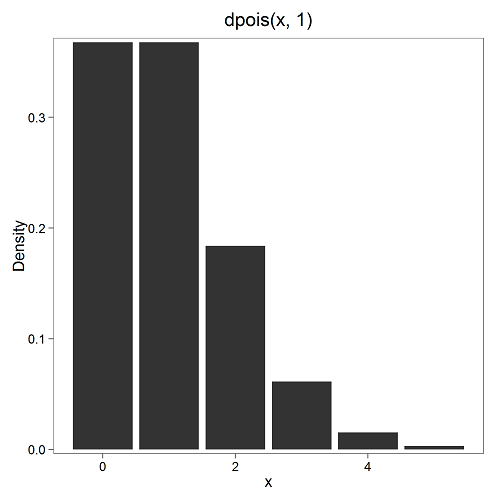
Figure 7. The probability of observing a grid with five seeds, poisson μ = 1 (ggplot2).
and for the actual probability we have from R
dpois(5, lambda = 1)
[1] 0.003065662
Rcmdr → Distributions → Discrete distributions → Poisson distribution → Poisson probabilities … (Fig 8)
The only thing to enter is the mean (some call μ lambda with symbol λ).
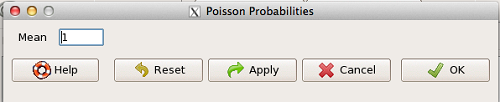
Figure 8. Rcmdr menu, poisson probability.
Here’s the output from R. For intervals 0, 1, 2, 3, …, 6 (Rcmdr just enters this range for you!
> .Table <- data.fram(Pr=dpois(0:6, lambda = 1))
> rownames(.Table) <- 0:6
> .Table
Pr
0 0.3678794412
1 0.3678794412
2 0.1839397206
3 0.0613132402
4 0.0153283100
5 0.0030656620 ← Answer, 0.0307 or 3.07%
6 0.0005109437
Next — Continuous distributions
And finally, for ratio (continuous) scale data, which can take on any value, we can express the chance that probability of a given point as a continuous function, with the normal distribution being one of the most important examples (there are others, like the F-distribution). Many statistical procedures assume that the data we use can be viewed as having come from a “normally distributed population.” See Chapter 6.6.
Questions
1.2. Quarterback sacks by game for the NFL team Seahawks, years 2011 through 2022 are summarized below (data extracted from https://www.pro-football-reference.com/ ).
| Sacks | How many games? |
| 0 | 25 |
| 1 | 46 |
| 2 | 49 |
| 3 | 39 |
| 4 | 25 |
| 5 | 14 |
| 6 | 8 |
| 7 | 2 |
| 8 | 1 |
| 9 | 0 |
a) Assuming a Poisson distribution, what are the mean (lambda) and variance?
b) The table covers a total of 112 games. How many sacks (events) were observed?
c) What is the probability of the Seahawks getting zero sacks in a game (in 2022, a season was 17 games; prior years a season was 16 games)?
Quiz Chapter 6.5
Discrete probability
Chapter 6 contents
- Introduction
- Some preliminaries
- Ratios and proportions
- Combinations and permutations
- Types of probability
- Discrete probability distributions
- Continuous distributions
- Normal distribution and the normal deviate
- Moments
- Chi-square distribution
- t distribution
- F distribution
- References and suggested readings
6.4 – Types of probability
Introduction
By probability, we mean a number that quantifies the uncertainty associated with a particular event or outcome. If an outcome is certain to occur, the probability is equal to 1; if an outcome cannot happen, the probability is equal to zero. Most events we talk about in biology have probability somewhere in between.
A basic understanding, or at least an appreciation for probability is important to your education in biostatistics. Simply put, there is no certainty in biology beyond simple expectations like Benjamin Franklin’s famous quip about “death and taxes…”
Discrete probability
You are probably already familiar with discrete probability. For example, what is the probability that a single toss of a fair coin will result in a “heads?” The outcomes of the coin toss are discrete, categorical, either “heads” or “tails.”
Note 1: Obviously, this statement assumes a few things — coin tossed not in a vacuum, for example. We assume a fair coin — equal chance heads or tails. Fair coins have two sides; tossing a coin we expect “heads” or “tails,” but rarely, some coin types may land and come to rest on edge or side (eg, USA nickels). We still consider the coin toss having binary outcomes, by definition, even though a coin may land on edge about one toss in six thousand (Murray and Teare 1993) because the exception is extremely rare. h/t Dr. Jerry Coyne.
And for ten tosses of the coin? And more cogently, what is the probability that you will toss a coin ten times and get all ten “heads?” While different in tone, these are discrete outcomes. An important concept is independence. Are the multiple events independent? In other words, does the toss of coin on the first attempt affect the toss of the coin on the second attempt and so on up to the tenth toss? At least in principle the repeated tosses are independent so to find the probability you just multiply each event’s probability to get the total.
In contrast, if one or more events are not independent but somehow influence the behavior of the next event, then you add the probabilities for each dependent event. We can do better than simply multiply or add events one at a time; depending on the number of discrete outcomes it is very likely that someone has already calculated all possible outcomes and come up with an equation. In the case of the tossing of two coins this is a binomial equation problem and repeat tosses can be modeled by use of the Bernoulli distribution.
Now, try this on for size. What is the probability that the next child born at Kapiolani Medical Center in Honolulu will be assigned female?
We just described a discrete random variable, which can only take on discrete or “countable” numbers. This distribution of values is the probability mass function. The probability of a one fatal airline accident in a year exactly on 20.1 is practically zero (the area under a point along the curve is zero), so we can get the probability of a range of values around the point as our answer.
Continuous probability
Many events in biology are of degree, not kind. It is kind of awkward to think about it, but for a sample of adult house mice drawn from a population, what is the probability of obtaining a mouse that is 20.0000 grams (g) in weight? Each possible value of body mass for a mouse is considered an event, just like in our example of tossing a coin. But clearly, we don’t expect to get a lot of mice that are exactly 20.0000 g in weight. For variables like body mass, the type of data we collect is continuous, and the probability values need to be rethought along a continuum of possible values and, in turn, how likely each value is for a mouse. Although it is theoretically possible that a mouse could weigh ten pounds, we know by experience that this is impossible. Adult mice weigh between 15 and 50 g or there about.
We just described a continuous random variable, which can take on any value between a specific interval of values. This distribution of values is the probability density function (PDF). The probability of a mouse’s weight falling exactly on 20.1 is practically zero (the area under a point along the curve is zero), so we can get the probability of a range of values around the point as our answer.
In statistical inference, following our measurements of the variables from our sample drawn from a population, we make conclusions with the following kind of caveat: “the mean body mass for this strain of mouse is 20 g.” That is our best estimate of the mean (middle) for the population of mice, more specifically, for the body mass of the mice. Here, the variable body mass is more formally termed a random variable. This implies that there is in fact a true population mean body mass for the mice and that any deviations from that mean are due to chance.
In statistics we don’t settle for a single point estimate of the population mean. You will find most reporting of estimates of random variables is accompanies by a statement like, the mean was 20g with a 95% probability that the true population mean is between 18.9 and 21 g. This is called the 95% confidence interval for the mean and it takes into account how good of an estimate our sample is likely to be relative to the true population value. Not only are we saying that we think the population mean is 20g, but we’re willing to say that we are 95% certain that the true value must be between a lower limit (18.9 g) and and upper limit (21 g). In order to make this kind of statement we have to assume a distribution that will describe the probability of mouse weights. For many reasons we usually assume a normal distribution. Once we make this assumption we can calculate how probable a particular weight is for a mouse.
We introduced how to calculate Confidence Intervals in Chapter 3.4 and will extend this in any chapter that introduces an estimation.
Types of probability
To begin refining our concept of probability, it is sometimes useful to distinguish among kinds of probabilities:
- between theoretical and empirical;
- between subjective and objective.
In most cases, including your statistics book, we would begin our discussion of probability by talking of some probabilities for events we’re familiar with.
- The theoretical probability of heads appearing the next time you flip a fair coin is 1/2 or 50%. As long as we’re talking about a fair coin, the probability of a heads appearing each time you flip the coin remains 50%. We can check this by conducting and experiment: out of 10 tosses, how many heads appear? The answer would be an empirical probability, and we understand the chance in an objective manner (no interpretation needed).
- The theoretical probability that a “5” will appear on the face of a fair dice after a toss is 1/6 or 16.667%. Again, as long as we’re talking about a fair dice, the probability of a “5” appearing each time you roll the dice remains 16.667%.
- The probability that at birth, a human baby’s sex will be male about 1/2 or 50%. This is an empirical probability based on millions of observations. Changes in technology, and ethical standards notwithstanding, the probability will remain the same.
- The probability of the birth of a Downs syndrome baby is 1/800, but increases with age until by age 45, the chance is 1/12. Again, these are empirical and objective.
- The probability of winning the Publisher’s Clearing House Sweepstakes is about 1 in 100 million. This probability is theoretical, it is also objective; however, by adding lots of twists to the game, by having multiple opportunities and by giving the appearance that a person must purchase a magazine, some players perceive their chances as increasing or decreasing by their efforts (=subjective).
R and distributions
R offers access to many named distributions. R generally provides four functions available for each.
density (d):the probability density function (PDF) for continuous distributions or the probability mass function (PMF) for discrete distributions.
probability (p): the cumulative distribution function (CDF), which is the chance (probability) of a random variable being less than or equal to a given value
quantile (q): the quantile function (inverse CDF), which returns the value at a given probability
r: draw random numbers from the specified distribution.
Examples of functions for the normal distribution then, are: dnorm(), pnorm(), qnorm(), and rnorm().
Coding example: Find the PDF for x = 0 in a standard normal distribution. # Find the PDF value for x = 0 in a standard normal distribution (mean=0, sd=1)
dnorm(x = 0, mean = 0, sd = 1)
R output
0.398942280401433
Thus, we conclude the chance that x = 0 is about 40%.
Note 2: Technically it’s not the chance that x is exactly 0 — it refers to the chance that the random variable falls within fractionally small interval around that value. That’s the calculus foundation for probability speaking.
Coding example: Find the probability that for x is equal to -1.2 or less in a standard normal distribution.
pnorm(q = -1.2, mean = 0, sd = 1, lower.tail = TRUE)
R output
0.115069670221708
Thus, we conclude the chance that x is equal to or less than -1.2 is about 11.5%.
Coding example: Assuming normal distribution of test scores, what score will 50% of students score? Find the probability that for x is equal to -1.2 or less in a standard normal distribution.
qnorm(0.5, mean = 75, sd = 10)
R output
75
As expected, at 50% it returns the mean. Now, confirm that the lower 25% and upper 75% are 68.26 and 81.75, respectively.
Last coding example, draw random sample of three scores from the same exam.
rnorm(3, mean = 75, sd = 10)
R output
-
66.0384856946112
-
69.1887923903669
-
77.6342297053815
R Commander: Distributions menus give four options
- Quantiles
- Probabilities
- Plot
- Sampling
Note 3: Looking for more examples? These kinds of problems are common skill-based questions one finds in any statistics course. Homework 3: Distributions & Probability in Mike’s Workbook for Biostatistics offers several additional examples to work through. Additional examples are provided in Chapter 6.5 and Chapter 6.6.
Questions
1. Define and distinguish, with examples
- discrete and continuous probability
- theoretical and empirical probability
- subjective and objective probability
Quiz Chapter 6.4
Types of probability
Chapter 6 contents
- Introduction
- Some preliminaries
- Ratios and proportions
- Combinations and permutations
- Types of probability
- Discrete probability distributions
- Continuous distributions
- Normal distribution and the normal deviate
- Moments
- Chi-square distribution
- t distribution
- F distribution
- References and suggested readings
6.1 – Some preliminaries
Introduction
OK, you say, I get it: statistics is important, and if I am to go on as a biologist, I should learn statistics. Let’s get on with it, start with the equations and the problems already!
Before we review probability theory and introduce risk analysis I want to spend some time to emphasize that at issue is critical thinking, so please bear with me (Fig 1).
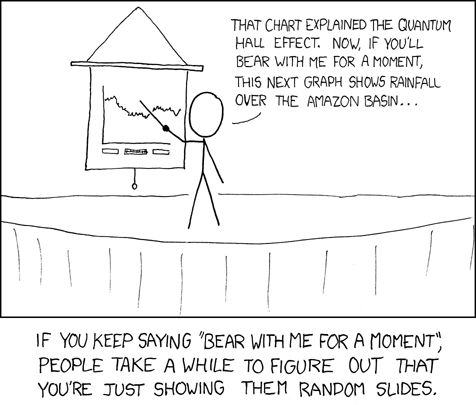
Figure 1. “Slides,” https://xkcd.com/365/.
How likely?
As we start our journey in earnest, we start with the foundations of statistics, probability. Probability in statistics means the chance that a specific outcome will occur. Probability is something we measure, or estimate, or draw from theoretical models, about whether something, a specific outcome from a class of outcomes (events — see Chapter 7.1), will occur. We speak about how likely an outcome is to occur, and this is quantified by the probability. Probabilities are given a value between 0 and 1: at 0% chance, the event will not happen; 100% chance, the event is certain to happen. Remember, probability applies to predicting future events; obviously, when viewed in the past, the event either did (100%), or did not (0%) happen.
If probability is the chance that an outcome will occur, then risk is the probability of a particular outcome occurring over a specified period of time. Related, epidemiologists define exposure risk as the potential for harm (or benefit) from contact with or vulnerability to a hazard (or treatment) or risk factor.
I introduce our discussion of probability through a risk analysis — the process of evaluating the probability and potential impact of health risks to individuals or populations. I like to start this discussion by relaying something I overheard while a number of us were standing on a lava field on the slopes of Kilauea back in November of 1998 (Kilauea erupted with lava flow more or less continually between 1983 and 2018; 5 Jan 2023, started up again).

Figure 2. View of Kamokuna Lava Bench, eruption of Pu`u `O`o, Kilauea, November 1998. Photo by S. Dohm.
In 1998, Volcanoes National Park hadn’t established barricades at the end of Chain of Craters Road, and people were walking to see new lava flows. The night we went, we met a park ranger who pleaded with us that the Park Service believed it was unsafe for us to walk out to see new lava flows because the area, called a lava delta, was unstable. Someone (not in my group), snapped back, “Oh, what are the chances that that will happen?” Of course, the ranger couldn’t quote a chance between zero and 100% for that particular evening. The ranger was saying the risk had increased, based on their subjective, but experienced opinion (see Kinds of probability, below).
As you can see in Figure 2, we went anyway. I have been thinking about her question ever since. We were lucky — some of the same area collapsed two weeks later (SOEST information, eruption about episode 55).
Cool picture though.
While the terms are used interchangeably in everyday language, they have distinct mathematical and statistical definitions. Prospective: You use a known model and its parameters to predict the probability of future data.
Multiple events
Whether or not a newly formed lava delta collapses, that’s a singular or simple event. For cases with more than one one outcome, that’s a multiple event.
I have two coins, a dime and a quarter, in my pocket; when I place the coins on the table, what are the chances that both coins will show heads? A blood sample from a crime scene was typed for two Combined DNA Index System (CODIS) Short Tandem Repeat (STR) loci, THO1 (allele 9.3) and TPOX (allele 8), the same allele types for the defendant. What are the chances of a match, someone other than the defendant has the same genetic profile? In both examples I describe a random process. With randomness, we can predict the probability of each kind of outcome, or series of outcomes, because we know the total possible number of outcomes. If there are just two outcomes, then the probability is equal — 50% that either will occur. If, however, the process is not random, then even if there are just two possible outcomes, the probability can’t be 50% — the outcome depends on some other process than random chance.
What is the chance that two events occur? For two or more independent events we can get the answers by using the product rule.

The two coins are independent, therefore the chance that both are placed heads up is 25% — we would expect to see this combined event one out of every four times. This is an illustration of the counting rule, aka fundamental counting principle: if there are n ways to do one thing (n elements in set A), and m ways to do another thing (m elements in set B), then there are  ways to do both things (combination of elements of A and B sets).
For the DNA profile CODIS problem (cf. Chapter 4, National Research Council 1996), the two alleles are both the most common observed in US Caucasian population at 30.45% and 54.7%, respectively (Moretti et al 2016). Assuming the individual was homozygous at both loci (ie, THO19.3,9.3 and TPOX8,8), then the genotype frequencies (p2) are:


Since THO1 is located on the p arm of chromosome 11, and TPOX is on the p arm of chromosome 2, the two loci are independent and therefore should be in linkage disequilibrium. We can use the product rule to get the probability of the DNA profile for the sample, 2.8%

If two events are not independent, then the product rule cannot be used. For example, CODIS STR D5S818 and CSF1PO are both located on the q arm of chromosome 5 and are therefore linked and not independent (the recombination frequency is about 0.25). The common allele for D5S818 is 11 at 40.84% and for CSF1PO the allele is 12 at 34.16%. Thus the chance that the two most common alleles is not simply the product rule result of 14%, instead we need to view this problem as one of dependent events.
Kinds of probability.
So, how does one go about estimating the likelihood that a particular event, whether it is collapse of a lava delta, or that a person will have a heart attack? The probability of lava delta collapse or of heart attack are examples of empirical probability, as opposed to a theoretical probability. Despite many years of effort, we have no applicable theory that we can apply to say, if a person does this, and that, then a heart attack will happen. But we do have a body of work documenting how often heart attacks occur, and when they occur in association with certain risk factors. Similarly, progress is being made to determine markers of risk of lava field collapse (Di Traglia et al. 2018). Analogously, this is the essential goal of risk analysis in epidemiology. We know of associations between cholesterol and heart attack risk, for example, but we also know that high cholesterol does not raise the probability of the event (heart attack) to 100%. How is this uncertainty part of statistics? Or perhaps you are a molecular scientist in training and have learned about how to assess results of a Western blot where typically the results are scored as “yes” or “no.” How is this relevant to statistics and probability?
A misconception about statistics and statistical thinking
There’s a long history of skepticism of conclusions from health studies, in part because it seems the advice flips. For example,
- Coffee is bad for you (Medical News Today January 2008)
- Coffee is good for you (NBC News July 2018)
- Even light drinking can be harmful to health (Science Daily, January 2022)
- Seven science-backed reasons beer is good for you (NBC News August 2017)
- Meat and cheese may be as bad for you as smoking (Science Daily, March 2014)
- Cheese actually isn’t bad for you (WIRED, February 2021)
The common thread is these studies are assessment of risk: about studies that seem to conclude “only: with statements of probability.
Perhaps you may have heard …? “There are lies and then there is statistics“. The full quote reads as follows:
Figures often beguile me, particularly when I have the arranging of them myself; in which case the remark attributed to Disraeli would often apply with justice and force: “There are three kinds of lies: lies, damned lies and statistics.” – Autobiography of Mark Twain (www.twainquotes.com/Lies.html).
Figure 3. Mark Twain. Image from The Miriam and Ira D. Wallach Division of Art, Prints and Photographs: Photography Collection, The New York Public Library. “Mark Twain in Middle Life” The New York Public Library Digital Collections. 1860 – 1920. https://digitalcollections.nypl.org/items/510d47d9-baec-a3d9-e040-e00a18064a99
Twain attributed the remarks to Benjamin Disraeli, the prime minister of Britain during much of Queen Victoria’s reign, but others have not been able to document this utterance to that effect. Still others believe that the “3-lies” quote belongs to Leonard Courtney, an English mathematician and statistician (1847-1929) (see University of York web site for more).
What is meant by this quote? Tossing aside cynicism — or healthy skepticism of authority one should have, whether that authority is a scientist or a politician(within reason, please!) — what this quote means is that it seems that results of very similar studies are in conflict. To some, this is part of the replication crisis in science (Baker 2016). There’s a perception that one can say just about anything with a number. Partly this is a matter of semantics, but also there is legitimacy to this concern. However, it is not necessarily the case that statistics have been intentionally done to mislead, rather, there is evidence that researchers are not always using proper statistical procedures.
One word, several meanings
We use the term statistics in multiple ways, all correct, but not all equal. For example, a statistic may refer to a number used to describe a population characteristic. From the 2010 U.S. census, we learn that the racial (self-reported) make-up of the U.S. population (then at 303 million) was 72.4% “white” and 12.6% “black” self-reported. In this sense, a statistic is something you calculate as a description. Do you recall the distinction between “statistic” and “statistics” discussed in Chapter 2?
Secondly, two studies essentially about the same topic, yet reaching seemingly different conclusions, may differ in the assumptions employed. It should be obvious that if different assumptions are used, researchers may reach different outcomes.
Finally, how we communicate statistics can be misleading. For example, use of percentages in particular can be confusing, especially in communication of the chance that some event may happen to us (eg, incidence of disease: number of new cases in a specific time period, compared to prevalence of a disease: number of cases of a disease in a specific period of time). On the one hand, percentages seem easy. A percentage is simply a proportion multiplied by 100%, and takes any value between 0% and 100%.
When a product says that it kills 99.99% of all germs on contact, do you feel better? Here’s a cartoon to consider as you think about that statement (Fig 4).
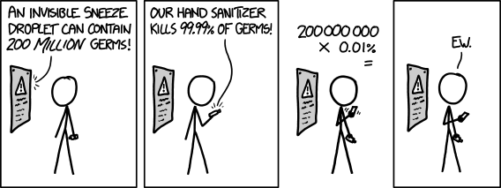
Figure 4. “Hand sanitizer,” https://imgs.xkcd.com/comics/hand_sanitizer.png
Of course numbers cannot be used to justify simultaneously mutually exclusive conclusions, but being able to recognize careless (or deliberate) miscommunication with numbers, well, this needs to be part of your skill set. Here’s a little exercise from transportation safety to ponder as you reflect on the subject of lies and statistics. rather, as you read this next section I ask that you consider
- are the correct statistical descriptors in use?
- what assumptions are being made?
- does the reporting of percentages lead to clear conclusions?
Some concluding thoughts about “lies and statistics”
Statistics is tricky because there are assumptions to be made. And you have to be clear in your thinking.
If the assumptions hold true, then we aren’t lying, and Twain had it wrong.
But if we disagree on the assumptions, then we will necessarily have to disagree on the conclusions drawn from the calculated numbers (the statistics). Risk analysis in particular, but statistics in general, is a tricky business because many assumptions need to be made, and we won’t necessarily have all of the relevant information available to make sure our assumptions are truthful. But it is the assumptions that matter: if we agree with the assumptions that are made, then we have confidence in the conclusions drawn from the statistics.
In a typical statistics course, we would spend a bunch of time on probability. We will here as well, but in the context of risk analysis and in the other contexts, in a less than formal presentation on the subject of probability. For example, in talking about inference, the testing of null hypotheses and estimating the probability that the null hypothesis is correct, I will say things like, “Imagine we repeated the experiment a million times — how many times by chance would we think a correct null hypothesis would none the less be rejected?”
There’s no real substitute for a formal course in probability theory and you should be aware that this foundation is pretty important if you go forward with biostatistics and epidemiology. For now, I will simply refer you to chapters 1, 2 and 3 of a really nice online book on probability from one of the masters, Richard Jeffrey (1926 – 2002; click here to go to Wikipedia). Much of what I will present to you follows from similar discussions.
My aim is to teach you what you need about probability theory by the doing. In the next couple of days we will deal with an aspect of risk analysis, namely a consideration of conditional probability and Baye’s Theorem that will help you evaluate claims such as the one made for airline safety. Risk analysis is tricky, but it is not a subject above and beyond our abilities; by applying some of the rules of statistical reasoning, we can check claims based on statistics. A healthy degree of skepticism is part of becoming a scientist. Do try this at home!
Some examples to consider: what is the relative risk for the following scenarios?
1. Drug testing at the workplace: risk of a worker, who does not use illegal drugs, registering positive (false positives in drug testing);
2. Positive HIV from blood sample from USA male with no associated risks (eg, intravenous drug user), false positives in HIV testing; false positives with mammography;
3. Benefits versus risks of taking a statin drug (drug that reduces serum cholesterol levels) to a person with no history of heart disease.
4. Is it safer to travel by car or by airliner? We’ll break this problem down in the next section.
What we are looking for is the probability of an occurrence of a particular event: that a person who does not use illegal drugs may nonetheless test positive; we are looking for a way to make rational decisions and understanding probability is the foundation.
Questions
- What do you make of the claim (joke) that “There are lies and then there are statistics?”
- Distinguish between empirical and theoretical probability; use examples.
Quiz Chapter 6.1
Some preliminaries
Chapter 6 contents
- Introduction
- Some preliminaries
- Ratios and proportions
- Combinations and permutations
- Types of probability
- Discrete probability distributions
- Continuous distributions
- Normal distribution and the normal deviate (Z)
- Moments
- Chi-square distribution
- t distribution
- F distribution
- References and suggested readings
6 – Probability, Distributions
Introduction
Probability is how likely something, an event, is likely to occur, ie, a prediction of the future. Related, we can ask of the likelihood of an event, which is like working backwards. The event has already occurred and we ask how well a model (parameters) explain the observed data.
Working with probability allows us to contextualize the inherent uncertainty in any measure, which in turn allows us to interpret results from hypothesis tests of observational or experimental data sets. Thus, an important concept to appreciate is that in many cases, like R.A. Fisher’s Lady tasting tea analogy, we can count in advance all possible outcomes of an experiment.
For many more experiments, we cannot count all possible outcomes of the sample space, either because they are too numerous or simply unknowable. In such cases, applying theoretical probability distributions allow us to circumvent the countability problem. Whereas empirical probability distributions are frequency counts of observations, theoretical probabilities are based on mathematical formulas.
At this stage of your training in statistics, you would spend time with the foundations of probability. Scenarios of likelihood of single events regardless of other events are called marginal probability, whereas the union refers to at least one event occuring. The likelihood of two or more events occuring at the same time is called joint probability. Worked examples are presented in the chapter, although the bulk of this chapter concerns conditonal probability, the likelihood of one event occuring given another event already happened. Working with conditional probability is essential for risk analysis, which we introduce in Chapter 7 – Probability, Risk Analysis and expand in Chapter 7.3 – Conditional Probability and Evidence Based Medicine and Chapter 7.4 – Epidemiology: Relative risk and absolute risk, explained.
Probability distributions are key to the null hypothesis significance testing framework for statistical inference. Given assumptions about the data, probability distributions are used to evaluate the likelihood of observing data under the null hypothesis, eg, no difference between means of a control group compared to a treatment group. Much of classical inferential statistics, especially the kind one finds in introductory courses like ours, are built on probability distributions. ANOVA, t-tests, linear regression, etc., are parametric tests and assume errors are distributed according to a particular type of distribution, the normal or Gaussian distribution.
A probability distribution is a list of probabilities for each possible outcome of a discrete random variable in an entire population. Depending on the data type, there are many classes of probability distributions. In contrast, probability density functions are used to for continuous random variables. This chapter begins with basics of probability then gently introduces discrete and continuous probability distributions. In the other sections of this chapter we describe several probability density functions. Emphasis is placed on the normal distribution, which underlies most parametric statistics.
Homework to go with this topic
Homework 3: Distributions & Probability in Mike’s Workbook for Biostatistics.
Quizzes in this chapter
A total of 88 questions among the several subchapters, a mix of true or false and multiple choice question format.
Chapter 6 contents
- Introduction
- Some preliminaries
- Ratios and proportions
- Combinations and permutations
- Types of probability
- Discrete probability distributions
- Continuous distributions
- Normal distribution and the normal deviate (Z)
- Moments
- Chi-square distribution
- t distribution
- The F distribution
- References and suggested readings
2.3 – A brief history of (bio)statistics
Foundations of biostatistics: key definitions.
.
Before discussing history and landmark moments in biostatistics, let’s start with basic definitions.
Bioinformatics is loosely defined as a discipline of biology primarily concerned with work involving large data sets (eg, databases), but a bioinformatician would not primarily be a statistician necessarily. Rather, a bioinformatician in addition to foundation in statistical and mathematical training would likely be fluent in at least one programming language and confident in use and design of databases.
Biostatistics, or biometry, then, refers to use of statistics in biology. Biostatistics encompasses application of statistical approaches to design, analyze, and interpret biological data collected through observation of use of experimentation. In turn, there are many broad disciplines or fields of specialty that trained biostatisticians may work.
Chance, the likelihood that a particular event will occur.
Data scientist, a very general label, is a person likely to work on “big data.” Big data may be loosely and inconsistently identified as access to large detailed and unstructured data sets such as visits and behavior within websites of tens of millions of Internet “hits” to a website like Amazon® or Google®. The data scientist would then be involved in extracting meaning from volumes of this data in a process called data mining. In the context of biology web sites like allele frequency aggregator at NCBI, which houses allele frequency information collected on human populations, the 1000 genome project, or any of the databases accessible at National Center for Biotechnology Information would constitute sources of big data for biological researchers.
Epidemiology refers to the statistics of patterns of and risk of disease in populations, particularly of humans and thus, an epidemiologist would also be considered to be a biostatistician. The statistics of epidemiology include all of the materials we will cover in this course, but perhaps if any particular analytical approach characterizes epidemiology, it would be survival analysis (review in Clark et al 2003) — in competition with compartment models to predict spread of communicable disease in populations (Brauer 2017).
Event, an outcome to which a probability is assigned.
Likelihood, the probable chance of occurrence of an event that has already occurred. Likelihood assesses how well a particular model or set of parameters explains observed data.
Probability, the chance that an event will occur in the future, given a known model or set of parameters.
Random or random chance. This is a good place to share a warning about vocabulary; statistics, like most of science, uses familiar words, but with refined and sometimes different meanings than our everyday usage. Consider our everyday use of random: “without definite aim, direction, rule, or method – subjects chosen at random” (Merriam-Webster online dictionary). In statistics, however, random refers to “an assignment of a numerical value to each possible outcome of an event” (Wikipedia, Eagle 2021). Thus, in statistics, random dictates a method of determining how likely a subject is to be included: If  represents the size of the population, then random sampling implies that each individual had
 chance of being selected. Thus, if
 , then each individual has a 1% (
 ) chance of selection. This is quite different from Merriam-Webster’s definition, in which no method is assumed. To a statistician, then, random as used in everyday conversation would imply haphazard sampling or convenience sampling from a population.
Statistics may be defined as the science of collecting, organizing, and interpreting data. Statistics is a branch of applied mathematics. Note that the word statistic is also used, but refers to a calculated quantity like the mean or standard deviation. A little confusing, but the context in which statistics or statistic is appropriate is usually not a major issue.
Note 1. Did you notice how the definitions for chance, likelihood, and probability were rather circular? Of the three, chance is more informal while both likelihood and probability are distinct concepts in statistics.
From dice games to data science: A brief history of statistics.
.
Figure 1. Soldiers playing dice, painting by Michiel Sweerts (1618–1664). Public domain image, https://commons.wikimedia.org/
The concepts of chance and probability, so crucial to statistical reasoning — because it allows us to interpret data when outcomes are inconsistent — were realized rather late in the history of mathematics. While people have been writing about applied and theoretical math for thousands of years, probability as a topic of interest by (Western) scholars seems to date only back to the late 17th century, beginning with letters written between Pierre de Fermat (1601-1665) and Blaise Pascal (1623 – 1662) and the substantial work on probability by Pierre-Simon Laplace (1749-1827). Often, research on probability developed under the watchful eyes of rich patrons more interested in gaming (sensu Fig 1), than to scientific applications. Work on permutations and combinations, essential for an understanding of probability, trace to India prior to Pascal’s work (Raju 2011).
The history of statistics goes back further if you allow for the dual use of the term statistics, both as a descriptor of the act of collecting data and as a systematic approach to the analysis of data. Prior to the 1700s, statistics was used in the sense of collection of data for use by the governments. It is not until the latter part of the 19th century that we see scholarship on statistical analytical techniques. Many of the statistical approaches we teach and use today were developed in the decades between 1880s and the 1930s. Work by Francis Galton (1822-1911), Karl Pearson (1857-1936), RA Fisher (1890-1962), Sewall Wright (1889-1988), Jerzy Neyman (1894-1981), Egon Pearson (1895-1980, Karl Pearson’s son), George EP Box (1919-2013) remains highly influential today.
Development of randomized controlled (clinical) trials, RCT, the “gold standard,” by the 1950s provides the strongest study design to evaluate the effectiveness of clinical or other kinds of interventions. The general features of RCT are (1) comparison among groups, with at least one control group, (2) randomization, and (3) blinding, where treatment options are concealed from the subjects (single-blind) and from those charged to assess the outcomes (double-blind). Sir Austin Bradford Hill (1887-1991) is generally credited with developing the RCT (Collier 2009, Matthews 2016), but we owe RA Fisher for randomization in experimental design. Hill (1965) is also known for Hill’s criteria of causality — nine principles that can be used to establish causal relationship between epidemiological (observational) evidence and disease. Chief among these nine principles are strength of the association (effect size) and consistent association (reproducibility), elements we return to often in our introduction to biostatistics.
Since the 1950s, there has been an explosion of developments in statistics, particularly as related to power of computer. These include use of resampling, simulation, and Monte Carlo methods (Harris 2010). Resampling — the creation of new samples based on a set of observed data — is a key innovation in statistics. Its use led to a number of innovative ways to estimate the precision of an estimate (see Chapter 3.4 and Chapter 19). Monte Carlo methods, or MCM, which involves resampling from a probability distribution, is used to repeat (simulate) an experiment over and over again (Kroese et al 2014). Computers have so influenced statistics that some now define statistics as “…the study of algorithms for data analysis” (p 175, Beran 2003). So much so, the role of computers and coding to process and model data, we now have the discipline of Data Science. For more on the history of statistics, see Anderson (1992), Fienberg (1992), and Freedman 1999; for excellent, conversational books read Salsburg (2002) and McGrayne (2011). For influential women in early development of statisticians, see Anderson (1992).
Numbers and prejudice: A hidden history of statistics.
.
Many statistical methods in use today, including regression and analysis of variance methods, can trace their origins to the late 1800’s and early 1900’s (Kevles 1998). Many of these early statisticians developed statistical methods to, at least in part, further their interests in understanding differences between racial groups of humans. Sir Francis Galton, who developed regression and correlation concepts (the details and extensions of which were the works of Karl Pearson), coined the term Eugenics, the “science” of improving humans through selective breeding. In an editorial, the journal Nature recently published an apology for it’s complicity providing “a platform to [eugenicists] views” (p 875, Nature 2022). Sir RA Fisher is rightfully remembered as the inventor of analysis of variance and maximum likelihood techniques (Rao 1992; Bodmer et al 2021), and perhaps more important, developed the concepts of sampling from populations, degrees of freedom, among other contributions. Moreover, work of Fisher, Wright, and others led to the realization that populations of the same species differed at many locations in the genome, thus completely refuting any notion of “racial purity” (Bodmer et al 2021). However, Fisher was an active promoter of eugenics (Bodmer et al 2021), and an award given by The Society for the Study of Evolution in his honor, the RA Fisher Prize, was renamed in 2020.
Eugenics is still with us (Liscum and Garcia 2022; see also Legacies of Eugenics: An Introduction Los Angeles Review of Books; Veit et al 2021), but the era of “Three generations of imbeciles are enough” (Buck v. Bell), and the forced sterilization eugenic programs of the Nazi (Kelves 1999), were thoroughly discredited on scientific grounds many times (click here for Eugenics Archive website). Do keep in mind that the times were different, and elements of eugenics thinking remains with us (cf discussion in Veil et al 2021 and references therein), it is interesting nevertheless to learn about the murky history of statistics and the objectives of some of the very bright people responsible for many of the statistical analyses we use today (see Stephen J. Gould’s “The Mismeasure of Man“). Several books tackle aspects of scientific racism, including 2017 Is science racist? by Jonathan Marks and 2019 Superior: The return of of race science, by Angela Saini, Cathy O’Neil’s 2017 accessible book Weapons of math destruction: How big data increases inequality and threatens democracy, and a host of articles and books listed at Wikipedia.
Keep in mind also that geneticists and statisticians were instrumental in showing why Eugenics was unscientific, at best. See partial listing in Bodmer et al (2021). Also, see 2021 review by Rebecca Sear, Demography and the rise, apparent fall, and resurgence of eugenics, in Population studies: A journal of demography. While the algorithms of statistics should be unbiased — and we often believe that they are — clearly, humans, and the interpretations of data may be biased (Celiktutan et al 2024). Statistical reasoning absolutely requires considering sources of bias and their impacts on our conclusions.
Landmark epidemiology studies.
.
John Snow (1813-1858) is credited by some as the “Father of Epidemiology”(Ramsay 2006). During a London outbreak — the sudden increase of disease events — of cholera in 1854, Snow conducted work to establish cholera mortality with source and quality of drinking water. At the time, the prevailing explanation for cholera was that it was an airborne infection. Snow’s map of cholera mortality in the Golden Square district of London in relation to a water pump on Broad Street is shown in Fig 2, Snow’s theory of contaminated water was not accepted as an explanation for cholera until after his death.
Original map by John Snow showing the clusters of cholera cases in the London epidemic of 1854, drawn and lithographed by Charles Cheffins.
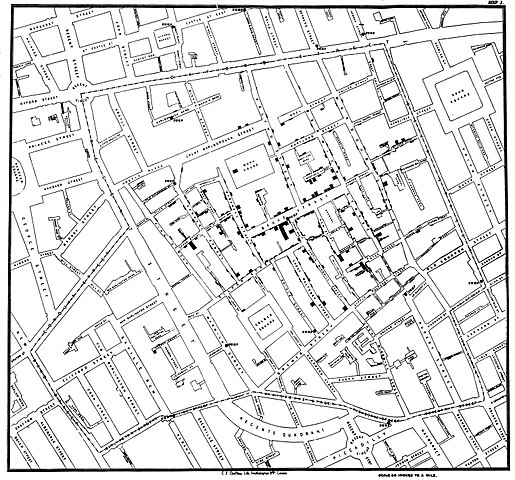
Figure 2. Original map by John Snow showing the clusters of cholera cases in the London epidemic of 1854, drawn and lithographed by Charles Cheffins. Image Public Domain, from Wikipedia.

Snow’s work and dataset can be viewed and thanks to Paul Lindman and others, the work can be expanded: for example, define areas around pumps by walking distance (Fig 3). The R package is cholera. Figure 2 shows a plot like Snow’s annotated map.cholera.
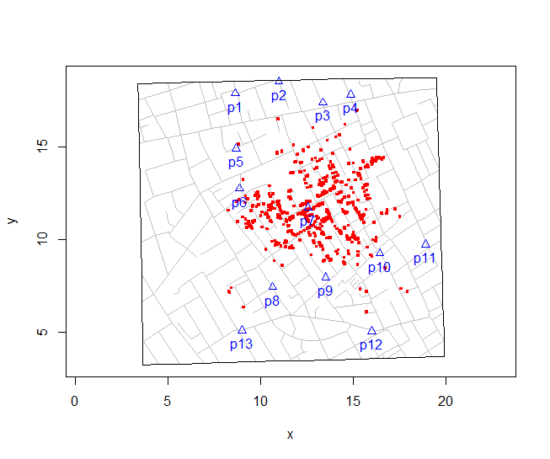
Figure 3. Plot of Snow’s London using R cholera package. Triangles marked with p1-p13 represent public water pumps. Red dots represent cholera cases.
R code to make the plot was
snowMap()Snow’s ideas about cholera were not accepted in his time and you should recognize that by itself, a cluster map supports both the airborne and waterborne theories. The cholera package contains additional data to help visualize the area, including setting regions by walking distance (Fig 4).
Figure 4. Plot of Snow’s London with walking areas drawn about the 13 water pumps. R cholera package.
R code to make the plot was
plot(neighborhoodWalking(case.set = "expected"), "area.polygons")Epidemiology of cancer.
.
This is an undeveloped section in my book. For now, I’ve listed a number of key landmark studies — a selective and incomplete list — in the history of epidemiology and cancer risk — these would serve well as case studies:
- Tobacco as a carcinogen
- Doll R, Hill AB. Smoking and carcinoma of the lung; preliminary report. Br Med J 1950; 2: 739–748
- Fontham ET, Correa P, Wu-Williams A, Reynolds P, Greenberg RS, Buffler PA, Chen VW, Boyd P, Alterman T, Austin DF, Liff J, Greenberg SD. Lung cancer in non-smoking women: a multicenter case-control study. Cancer Epidemiol Biomarkers Prev 1991;1:35-43
- Diet and cancer risk
- Kolonel LN, Hankin JH, Lee J, Chu SY, Nomura AM, Hinds MW. Nutrient intakes in relation to cancer incidence in Hawaii. Br J Cancer 1981;44:332-339.
- Obesity, exercise, and cancer risk
- Calle EE, Rodriguez C, Walker-Thurmond K, Thun MJ. Overweight, Obesity, and Mortality from Cancer in a Prospectively Studied Cohort of U.S. Adults. N Engl J Med 2003;348:1625-1638.
- Hormones and cancer risk
- Marchbanks PA, McDonald JA, Wilson HG, Folger SG, Mandel MG, Daling JR, Bernstein L, Malone KE, Ursin G, Strom BL, Norman SA, Wingo PA, Burkman RT, Berlin JA, Simon MS, Spirtas R, Weiss LK. Oral contraceptives and the risk of breast cancer. New Engl J Med 2002;346(26):2025-2032.
- Cancer risk and occupations
- absence of cervical cancer but high incidence of breast cancer in nuns (Ramazzini, 1713)
- cancer of the scrotums among chimney sweeps of London (Pott, 1775)
- Silverman DT, Hoover RN, Mason TJ, Swanson GM. Motor exhaust-related occupations and bladder cancer. Cancer Res 1986;46:2113-2116.
Please see review by Greenwald and Dunn (2009).
Questions
- Write up three learning outcomes for this page. Hint: Point your favorite generative AI to this page and ask for help.
- Expand my example of landmark studies (also called pivotal or seminal studies) in epidemiology of cancer to a subject of your own interest. For example, vaccination and communicable diseases like polio.
.
Quiz Chapter 2.3
A history of (bio)statistics
Chapter 2 contents
.
- Introduction
- Why biostatistics?
- Why do we use R Software?
- A brief history of (bio)statistics
- Experimental Design and rise of statistics in medical research
- Scientific method and where statistics fits
- Statistical reasoning
- Chapter 2 – References and suggested reading