15 – Nonparametric tests
Introduction
T-tests and ANOVA are members of a statistical family of tests called parametric tests. Parametric tests assume that the
- sample of observations come from a particular probability distribution, eg, normal distribution.
- samples among groups have equal variances.
Assumptions for parametric tests were introduced in Chapter 13. In the case of the t-test and ANOVA, we assume that the samples come from a normal probability distribution and that the probabilities of the test statistic follow the t distribution or the F distribution, respectively.
Providing these assumptions hold, we can then proceed to interpret our results as if we are talking about the population as a whole from which the samples were selected.
In other words, the t-test asks (infers) about properties of a population, hence, we are asking about parameters of the population.
T-tests, ANOVA, and other parametric tests are designed to work with quantitative ratio-scale data types. If the data are of this type and the probability distribution is known, they are the best tests to use… they allow you to make conclusions about experiments at a defined Type I error rate of 5%.
But what if you can’t assume that distribution? Your options include
- transforming the data so as the data better meet the assumptions of parametric tests.
- apply nonparametric statistical tests.
- use of distribution-free resampling methods like the bootstrap as an alternative. Bootstrapping offers methods to estimate confidence intervals and perform hypothesis tests without relying on theoretical distributions.
Here, we introduce some of the classic nonparametric statistics as an alternative to parametric tests. Bootstrapping is introduced in Chapter 19.
Nonparametric tests make fewer assumptions
Nonparametric tests do not make the assumption about a particular distribution — distribution free tests — nor are they used to make inferences about population parameters. Instead, nonparametric tests are used when the data type are ranks (ordinal). Now, when you think about it, all quantitative data can be converted to ranks. Hence, this is the argument for why there are nonparametric alternatives for tests like the t-test. There are a number of nonparametric alternatives to parametric tests and we’ll list several in this chapter (randomization methods like the bootstrap, see Ch19.2, are also considered nonparametric — unless, of course the data is assumed to come from a particular distribution, then it’s called parametric bootstrap). Another nonparametric option is to run a permutation test on the data.
However, nonparametric tests lack statistical power
One downside for nonparametric tests is that they tend to have less statistical power compared to the parametric alternatives (see Chapter 11 for review of Statistical Power). Thus, nonparametric tests tend to have higher Type II rates of error — they fail to properly reject the null hypothesis when they should. This problem tends to be less important for large sample sizes.
Note 1: Instead of transformations or other ad hoc manipulations of the data, modern statistical approaches favor modeling the error structure of the data within a Generalized Linear Model framework (St.-Pierre et al 2018). The advantage of the model approach is that parameter estimation occurs on the raw data. Use of transformations may, however, remain a better choice. While statistically justified, the generalized linear model approach may also tend to have higher rates of Type II error compared to simple transformations.
Thus, this chapter covers some of the more popular nonparametric alternative tests. Chapter 19 – Distribution free statistical methods, highlights use of permutation and randomization approaches, which also are alternatives to parametric tests.
Note 1: Bootstrapping can be either parametric or non-parametric. Non-parametric bootstrapping makes no assumptions about the data’s underlying distribution, while the parametric approach requires assuming a specific distribution.
Suggested homework
Homework 9: Common nonparametric tests.
Quizzes in this chapter
A total of 18 questions among the several subchapters, a mix of true or false and multiple choice question format.
Chapter 15 contents
13 – Assumptions of parametric tests
Introduction
Chapters 8, 10 and 12 were concerned primarily with tests of means among groups of treatments. ANOVA, t-tests, linear models, all involve estimation of parameters, qualities of populations. Although we have included assumptions about these statistics along the way, this chapter provides a summary about assumptions needed to be met in order to correctly interpret results of these statistical tests. Assumptions of parametric tests include how the data are presumed to be distributed (eg, normality) and about the variability within groups (eg, we assume equal or “homogeneity” of variances).
One important caveat: you can always estimate regardless of whether or not the assumptions are met. And, certainly, R and other statistical software will allow you to perform these calculations without warning. However, to the extent one or more assumptions do not hold, your conclusions, eg, p-value and Type I error, will be influenced. That’s what we mean by statistical thinking — knowing when your conclusions are valid.
This is the classic approach — provide tests of assumptions to justify use of ANOVA, etc. The modern approach, perhaps even the best practice approach, is instead to use more powerful statistical modeling approach, eg, generalized linear model (GLS) to model for correlations among residuals (lack of independence assumption) or heteroscedastic variances (equal residual variances).
Quizzes in this chapter
A total of 29 questions among the several subchapters, a mix of true or false and multiple choice question format.
Chapter 13 contents
10.2 – Digging deeper into t-test Plus the Welch test
Introduction
We need to spend some more time with the independent sample t-test; by tearing it apart, we can learn about how parametric tests work in general.
Our assumptions for the independent sample t-test are like the one-sample t-test the data must be continuous and normally distributed (one of our standard assumptions for parametric tests, see Chapter 13). The formula is very similar to the one-sample t-test, except that now we have two sample means and the formula for the standard error (SE) has also changed.

We see that the test statistic t is large if the numerator is large compared to the denominator. Large values of t will be evidence in favor of rejecting the null hypothesis.
The numerator is straightforward: we subtract one sample mean from the other — if there is no difference between the samples, then this difference will be close to zero.
The denominator requires additional discussion. What is it called? It is the pooled standard error of the mean (pooled SEM). Provided the assumption of equal variances holds — an additional standard assumptions for parametric tests, see Chapter 13 — then sample variances estimate the population variance and we can use this information to our advantage to best test the hypothesis about the sample means. In other words, we don’t have to lose a degree of freedom to account for differences in variability for the two groups (see Welch test). More degrees of freedom means more statistical power to test the null hypothesis and at the same time, more confidence that the test is performing to its best.
Lets break down the pooled standard error of the mean in order to see how the assumption of equal variances affects the t-test. We assume that 
Recall that

Now we want a “pooled SE” that is the pooled standard error for both samples. The variance of the difference between the means can be written as
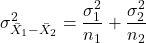
First we need to calculate the pooled variance. where v1 and v2 are degrees of freedom for sample one and sample two, respectively.
Note 1This is just simply a combined formula of the sample variance.
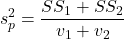
What is SS? The sum of squares , where SS1 and SS2 refer to sum of squares for each of the two groups.
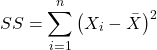
You should recognize SS from your definition of the sample variance, Chapter 3.3.
And the standard error for the difference between two means can now be written as So the 2-sample t-test can be written to reflect the pooled sample standard error of the difference between two sample means. We can see how unequal sample size is accommodated by the t-test.
Conducting the test by hand follows the same form as the one-sample t-test. Find the degrees of freedom (DF), but now for each sample.
Finally we evaluate with the critical value in Table (Appendix, Table of Student’s t distribution) and compare the t test statistic against the critical value with the appropriate degrees of freedom.
Because this is the t-test, again, we are assuming that the variances are the same between the two populations (homoscedasticity) and this allows us to pool the variance. As it turns out, the T-test is not overly sensitive to other deviations from the assumptions, but if the variances are in fact different, then the standard formula may yield incorrect Type I error rates compared to stated probability level (α).
However, it would be poor statistical choice to use a test where there are alternatives. This is why in part that R (Rcmdr) sets as the default for the t-test that variances are unequal! In fact, R does not do a t-test unless you change the default to assume equal variances, which, as we now know, is the t-test.
Welch test
What to do when assumptions to t-test are not met? Many options have been proposed, and Welch’s approximate t is a good alternative to the two-sample t-test — it would be appropriate if the normal assumption still held.
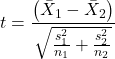
The degrees of freedom for the Welch’s test are now
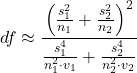
Note 2: The Welch test removes the pooled estimate of the standard error, replaces with both variance estimates directly.
As a default option, R and Rcmdr uses a variation of Welch’s test when you select to do the t-test without making the assumption of equal variance (Fig 1).
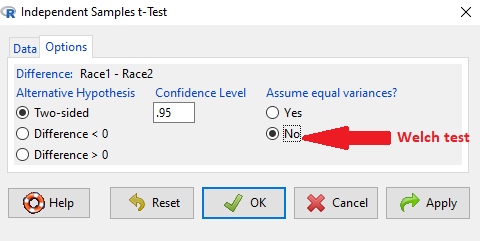
Figure 1. Screenshot Rcmdr t-test options. Default is “No” for Assume equal variances, ie, the Welch test.
The Welch test is not a nonparametric test, it is a different formulation of the t-test.
Justification for beginning with t-test
It’s unlikely that you will need the t-test in today’s research climate. Data sets are large, experiments are complex with multiple variables and samples. Why do we have to consider the t-test, and then a separate test in the case for unequal sample size? I view it as a teaching moment. It makes the general point that ALL statistical tests make assumptions about how the calculations are done and as to the nature of the data set.
This is our first experience with what to do if there is a violation of an assumption of parametric tests (see Chapter 13). Here, the assumption is that the two groups have equal sample size. When they do not, the standard t-test tends to biased estimates. On the other hand, if the assumptions are met, the standard test is the best test because it has more power to do what we intended — that is, it is best at the actual test of the null hypothesis! Take heart — this point is not always appreciated even by scientists (cf. Fagerland 2012).
Note 3: Expert advice will differ here, but you can always calculate the test statistic, even if the assumptions do not hold. The problem, the concern is with the interpretation.
Let’s us approach the problem of violation of assumptions in a couple of ways as an introduction to how, in general, to approach choice of statistical tests.
- Power of a test. Much current statistical research focuses on learning about how a particular statistical test works when assumptions are violated. Thus, in addition to learning what tests are designed to do, we need to consider the effects of violations of assumptions on the performance of the test (namely, is the Type I error at the stated alpha level?). This is a matter of statistical power; power of a test reflects how able the test is to get you the correct result even if assumptions are violated. Often tests perform well if sample sizes are large despite violation of assumptions. We mention without proving that the 2-sample T-test is robust to violations of normality assumption, to requirement for equal sample size, and even to unequal variances. But good experimental design attempts to meet the assumptions because the test does better!
- Alternate forms of some tests are available to handle some aspects of test violations. For example, the simple 2-sample T-test can be modified to accommodate different variances (Welch’s formula). Or you must find a different test (eg, nonparametric tests).
In conclusion, all tests begin with consideration of the assumptions. In some cases we can test our assumptions. For example, we learned about testing the assumption of normal distributions of sample data. We can also test the assumption of equal variances.
Questions
- Consider a clinical trial in which resting blood pressure is recorded on hypertensive subjects at the start of the trial, then 6 weeks after subjects have received daily supplements of flaxseed. Thus, for each subject there are two measures of blood pressure, BEFORE and AFTER.
- Write the null hypothesis
- Write the alternative hypothesis
- Justify why or why not the hypothesis should be two tailed. Explain why or why not an independent sample t-test may be used to compare groups.
Quiz Chapter 10.2
Digging deeper into t-test Plus the Welch test
Chapter 10 contents
- Introduction
- Compare two independent sample means
- Digging deeper into t-test Plus the Welch test
- Paired t-test
- References and suggested reading