12.2 – One way ANOVA
Introduction
In ANalysis Of VAriance, or ANOVA for short, we likewise have tools to test the null hypothesis of no difference between between categorical independent variables — often called factors when there’s just a few levels to keep track of — and a single, dependent response variable. But now, the response variable is quantitative, not qualitative like the  tests.
Analysis of variance, ANOVA, is such an important statistical test in biology that we will take the time to “build it” from scratch. We begin by reminding you of where you’ve been with the material.
We already saw an example of this null hypothesis. When there’s only one factor (but with two or more levels), we call the analysis of means and “one-way ANOVA.” In the independent sample t-test, we tested whether two groups had the same mean. We made the connection between the confidence interval of the difference between the sample means and whether or not it includes zero (ie, no difference between the means). In ANOVA, we extend this idea to a test of whether two or more groups have the same mean. In fact, if you perform an ANOVA on only two groups, you will get the exact same answer as the independent two-sample t-test, although they use different distributions of critical values (t for the t-test, F for the ANOVA — a nice little fact for you square the t-test statistic, you’ll get the F-test statistic:  ).
Let’s say we have an experiment where we’ve looked at the effect of different three different calorie levels on weight change in middle-aged men.
I’ve created a simulated dataset which we will use in our ANOVA discussions. The data set is available at the end of this page (scroll down or click here).
We might graph the mean weight changes ( SEM); Below are two possible outcomes of our experiment (Fig 1).
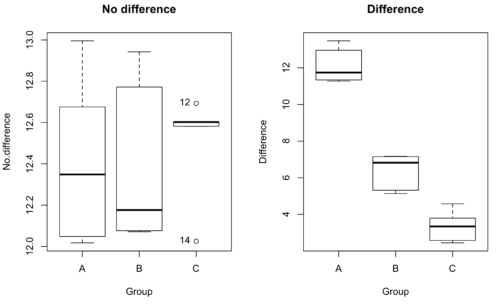
Figure 1. Hypothetical results of an experiment, box plots. Left, no difference among groups; Right, large differences among groups.
As statisticians and scientists, we would first calculate an overall or grand mean for the entire sample of observations; we know this as the sample mean whose symbol is  . But this overall mean is made up of the average of the sample means. If the null hypothesis is true, then the all of the sample means all estimate the overall mean. Put another way, being a member of a treatment group doesn’t matter, ie, there is no systematic effect, all differences among subjects are due to random chance.

The hypotheses among are three groups or treatment levels then are:

Null that there are no differences among the group means. And the alternative hypotheses include any (or all) of the following possibilities

or maybe

or… have we covered all possible alternate outcomes among three groups?
In either case, we could use one-way ANOVA to test for “statistically significant differences.”
Three important terms you’ll need for one-way ANOVA
FACTOR: We have one factor of interest. For example, a factor of interest might be
- Diet fed to hypertensive subjects (men and women)
- Distribution of coral reef sea cucumber species in archipelagos
- Antibiotic drug therapy for adolescents with Acne vulgaris (click see Webster 2002 for review).
Note 1: Character vs factor. In R programming, while it is true that a treatment variable can be a character vector like Gender*, such vectors are handled by R as string. In contrast, by claiming Gender as a factor, R handles the variable as a nominal data type. Hence, ANOVA and other GLM functions expect any treatment variable to be declared as a factor:
Gender <- c("Gender non-conforming", "Men", "Non-binary", "Transgender", "Women", "Declined"); Gender
[1] "Gender non-conforming" "Men" "Non-binary" "Transgender"
[5] "Women" "Declined"
# it’s a string vector, not a factor
is.factor(Gender)
[1] FALSE
Change string vector to a factor.
Gender <- as.factor(Gender); is.factor(Gender) [1] TRUE
* For discussions of ethics of language inclusivity and whether or not such information should be gathered, see Henrickson et al 2020.
LEVELS: We can have multiple levels (2 or more) within the single factor. Some examples of levels for the Factors listed:
- Three diets (DASH), diet rich in fruits & vegetables, control diet)
- Five archipelagos (Hawaiian Islands, Line Islands, Marshal Islands, Bonin Islands, and Ryukyu Islands)
- Five antibiotics (ciprofloxacin, cotrimoxazole, erythromycin, doxycycline, minocycline).
RESPONSE: There is one outcome or measurement variable. This variable must be quantitative (ie, on the ratio or interval scale). Continuing our examples then
- Reduction in systolic pressure
- Numbers of individual sea cucumbers in a plot
- number of microcomedo.
Note 2: A comedo is a clogged pore in the skin; a microcomedo refers to the small plug. Yes, I had to look that up, too.
The response variable can be just about anything we can measure, but because ANOVA is a parametric test, the response variable must be normally distributed!
Note on experimental design
As we discuss ANOVA, keep in mind we are talking about analyzing results from an experiment. Understanding statistics, and in particular ANOVA, informs how to plan an experiment. The basic experimental design is called a completely randomized experimental design, or CDR, where treatments are assigned to experimental units at random.
In this experimental design, subjects (experimental units) must be randomly assigned to each of these levels of the factor. That is, each individual should have had the same probability of being found in any one of the levels of the factor. The design is complete because randomization is conducted for all levels, all factors.
Thinking about how you would describe an experiment with three levels of some treatment, we would have
Table 1. Summary statistics of three levels for some ratio scale response variable.
| Level 1 |
sample mean1 |
sample standard deviation1 |
| Level 2 |
sample mean2 |
sample standard deviation2 |
| Level 3 |
sample mean3 |
sample standard deviation3 |


Note 3: Table 1 is the basis for creating the box plots in Figure 1.
ANOVA sources of variation
ANOVA works by partitioning total variability about the means (the grand mean, the group means). We will discuss the multiple samples and how the ANOVA works in terms of the sources of variation. There are two “sources” of variation that can occur:
- Within Group Variation
- Among Groups Variation
So let’s look first at the variability within groups, also called the Within Group Variation.
Consider and experiment to see if DASH diet reduces systolic blood pressure in USA middle-aged men and women with hypertension (Moore et al 2001). After eight weeks we have
We get the corrected sum of squares, SS, for within group

and the degrees of freedom, DF, for within groups

where i is the identity of the groups,  is the individual observations within group i,
 is the group i mean, ni is the sample size within each group, N is the total sample size of all subjects for all groups, and k is the number of groups.
Importantly, this value is also referred to as “error sums of squares” in ANOVA. It’s importance is as follows — In our example, the within group variability would be zero if and only if all subjects within the same diet lost exactly the same amount of weight. This is hardly ever the case of course in a real experiment. Because there are almost always some other unknown factors or measurement error that affect the response variable, there will be some unknown variation among individuals who received the same treatment (within the same group). Thus, the error variance will generally be larger than zero.
The first point to consider: your ANOVA will never result in statistical differences among the groups if the error variance is greater than the second type of variability, the variability between groups.
The second type of variability in ANOVA is that due to the groups or treatments. Individuals given a calorie-restricted diet will lose some weight; individuals allowed to eat a calorie-rich diet likely will gain weight, therefore there will be variability (a difference) due to the treatment. So we can calculate the variability among groups. We get the corrected sum of squares for among groups

and the degrees of freedom for among groups

where i is the identity of the groups, is the grand mean as defined in Measures of Central Tendency (Chapter 3.1), is the group i mean, ni is the sample size within each group, N is the total sample size of all subjects for all groups, and k is the number of groups.
The sums of squares here is simply subtracting the mean of each population from the overall mean.
- If the Factor is not important in explaining the variation among individuals then all the population means will be similar and the sums of squares among populations would be small.
- If the Factor is important in explaining some of the variation among the individuals then all the population means will NOT be the same and the sums of squares among populations would be large.
Finally, we can identify the total variation in the entire experiment. We have the total sum of squares.

Thus, the insight of ANOVA is that variation in the dataset may be attributed to a portion explained by differences among the groups and differences among individual observations within each group. The inference comes from recognizing that if the among group effect is greater than the within group effect, then there will be a difference due to the treatment levels.
Mean squares
To decide whether the variation associated with the among group differences are greater than the within group variation, we calculate ratios of the sums of squares. These are called Mean Squares or MS for short. The ratio of the Mean Squares is called F, the test statistic for ANOVA.
For the one-way ANOVA we will have two Mean Squares and one F, tested with degrees of freedom for both the numerator  , and denominator
 ).
The Mean Square for (among) groups is

The Mean Square for error is

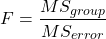
And finally, the value for F, the test statistic for ANOVA, is
Worked example with R
A factor with three levels, A, B, and C
group <- c("A", "A", "A", "B", "B", "B", "C", "C", "C")
and their responses, simulated
response <- c(10.8, 11.8, 12.8, 6.5, 7, 8, 3.8, 2.8, 3)
We create a data frame
all <- data.frame(group, response)
Of course, you could place the data into a worksheet and then import the worksheet into R. Regardless, we now have our dataset.
Now, call the ANOVA function, aov, and assign the results to an object (eg, Model.1)
Model.1 <- aov(response ~ group, data=all)
Now, visualize the ANOVA table
summary(Model.1)
and the output from R, the ANOVA table, is shown below
Note 4: Rcmdr: Statistics → Means → One-way ANOVA… see figures 2 and 3 below
Table 2. Output from aov() command, the ANOVA table, for the “Difference” outcome variable.
           Df   Sum Sq    Mean Sq   F value       Pr(>F)
group       2   111.16      55.58     89.49    0.0000341 ***
Residuals   6     3.73       0.62
---
Signif. codes: 0 '***' 0.001 '**' 0.01 '*' 0.05 '.' 0.1 ' ' 1
Let’s take the ANOVA table one row at a time
- The first row has subject headers defining the columns.
- The second row of the table “groups” contains statistics due to group, and provides the comparisons among groups.
- The third row, “Residuals” is the error, or the differences within groups.
Moving across the columns, then, for each row, we have in turn,
- the degrees of freedom (there were 3 groups, therefore 2 DF for group),
- the Sums of Squares, the Mean Squares,
- the value of F, and finally,
- the P-value.
R provides a helpful guide on the last line of the ANOVA summary table, the “Signif[icance] codes,” which highlights the magnitude of the P-value.
Note 5: On the use of “error” and “residuals.” Error refers to the difference between an observed value and the true population value. Residual is the difference between an observed value and a value predicted by a model. In ANOVA, the “error variance” or “residual variance” is the variation within groups unexplained by the tested factor. It is what remains after the effects of the model are accounted for.
What to report? ANOVA problems can be much more complicated than the simple one-way ANOVA introduced here. For complex ANOVA problems, report the ANOVA table itself! But for the one-way ANOVA it would be sufficient to report the test statistic, the degrees of freedom, and the p-value, as we have in previous chapters (eg, t-test, chi-square, etc.). Thus, we would report:
F = 89.49, df = 2 and 6, p = 0.0000341
where F = 89.49 is the test statistic, df = 2 (degrees of freedom for the among group mean square) and 6 (degrees of freedom for the within group mean square), and p = 0.0000341 is the p-value.
In Rcmdr, the appropriate command for the one-way ANOVA is simply
Rcmdr: Statistics → Means
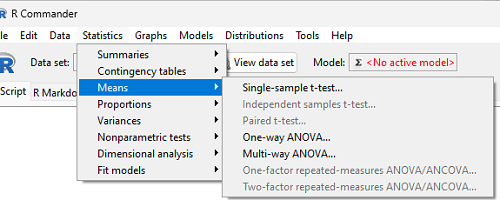
Figure 2. Screenshot Rcmdr select one-way ANOVA.
which brings up a simple dialog. R Commander anticipates factor (Groups) and Response variable. Optional, choose Pairwise comparisons of means for post-hoc test (Tukey’s) and, if you do not want to assume equal variances (see Chapter 13), select Welch F-test.
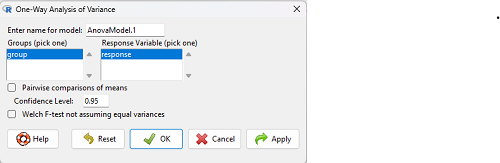
Figure 3. Screenshot Rcmdr select one-way ANOVA options.
Questions
1. Review the example ANOVA Table and confirm the following
- How many levels of the treatment were there?
- How many sampling units were there?
- Confirm the calculation of
 and using the formulas contained in the text.
- Confirm the calculation of F using the formula contained in the text.
- The degrees of freedom for the F statistic in this example were 2 and 6 (F2,6). Assuming a two-tailed test with Type I error rate of 5%, What is the critical value of the F distribution (see Appendix 20.4)
2. Repeat the one-way ANOVA using the simulated data, but this time, calculate the ANOVA problem for the “No.difference” response variable.
3. Leaf lengths from three strains of Arabidopsis thaliana plants grown in common garden are shown in Fig 2. Data are provided for you in the following R script.
arabid <- c("wt","wt","wt","AS1","AS1","AS1","AS2","AS2","AS2")
leaf <- c(4.909,5.736,5.108,6.956,5.809,6.888,4.768,4.209,4.065)
leaves <- data.frame(arabid,leaf)
- Write out a null and alternative hypotheses
- Conduct a test of the null hypothesis by one-way ANOVA
- Report the value of the test statistic, the degrees of freedom, and the P-value
- Do you accept or reject the null hypothesis? Explain your choice.
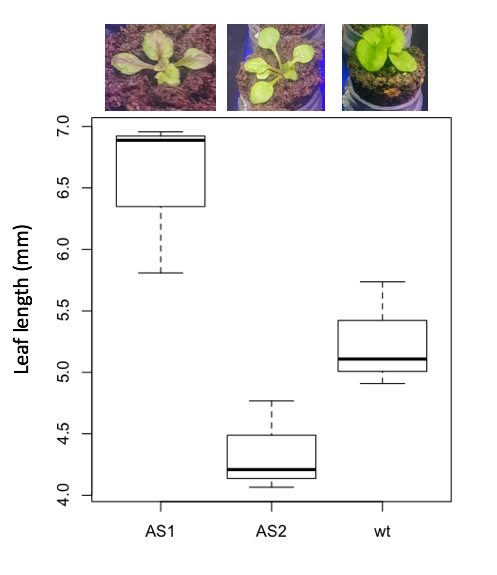
Figure 4. Box plot of lengths of leaves of a 10-day old plant from on of three strains of Arabidopsis thaliana.
4. Return to your answer to question 7 from Chapter 12.1 and review your answer and modify as appropriate to correct your language to that presented here about factors and levels.
5. Conduct the one-way ANOVA test on the Comet assay data presented question 7 from Chapter 12.1. Data are copied for your convenience to end of this page. Obtain the ANOVA table and report the value of the test statistics, degrees of freedom, and p-value.
a. Based on the ANOVA results, do you accept or reject the null hypothesis? Explain your choice.
Quiz Chapter 12.2
One-way ANOVA
Data used in this page
Difference, no difference
Table 12.2 Difference or No Difference
| Group | No.difference | Difference |
|---|---|---|
| A | 12.04822 | 11.336161 |
| A | 12.67584 | 13.476142 |
| A | 12.99568 | 12.96121 |
| A | 12.01745 | 11.746712 |
| A | 12.34854 | 11.275492 |
| B | 12.17643 | 7.167262 |
| B | 12.77201 | 5.136788 |
| B | 12.07137 | 6.820242 |
| B | 12.94258 | 5.318743 |
| B | 12.0767 | 7.153992 |
| C | 12.58212 | 3.344218 |
| C | 12.69263 | 3.792337 |
| C | 12.60226 | 2.444438 |
| C | 12.02534 | 2.576014 |
| C | 12.6042 | 4.575672 |
Comet assay, antioxidant properties of tea
Data presented in Chapter 12.1
Chapter 12 contents
8.2 – The controversy over proper hypothesis testing
Introduction
Over the next several chapters we will introduce and develop an approach to statistical inference, which has been given the title “Null Hypothesis Significance Testing” or NHST.
In outline, NHST proceeds with
- statements of two hypotheses, a null hypothesis, HO, and an alternative hypothesis, HA
- calculate a test statistic comparison of the null hypothesis (assuming some characteristic of data).
- The value of the test statistic is to be compared to a critical value for the test, identified for the assumed probability distribution at associated degrees of freedom for the statistical function, and assigned Type I error rate.
We will expand on these statements later in this chapter, so stay with me here. Basically, the null hypothesis is often a statement like the responses of subjects from the treatment and control groups are the same, eg, no treatment effect. Note that the alternative hypothesis, eg, hypertensive patients receiving hydalazine for six weeks have lower systolic blood pressure than patients receiving a placebo (Campbell et al 2011), would be the scientific hypothesis we are most interested in. But in the Frequentist NHST approach we test the null hypothesis, not the alternative hypothesis. This framework over proper hypothesis testing is the basis of the Bayesian vs Frequentist controversy.
Consider the independent sample t-test (see Chapter 8.5 and 8.6), our first example of a parametric test.

After plugging in the sample means and the standard error for the difference between the means, we calculate t, the test statistic of the t-test. The critical value is treated as a cut-off value in the NHST approach. We have to set our Type I error rate before we start the experiment, and we have available the degrees of freedom for the test, which follows from the sample size. With these in hand, the critical value is found by looking in the t-table of probabilities (or better, use R).
For example, what is the critical value of t-test with 10 degrees of freedom and Type I error of 5%?
In Rcmdr, choose Distributions → Continuous distributions → t distribution → t quantiles… (Fig 1).
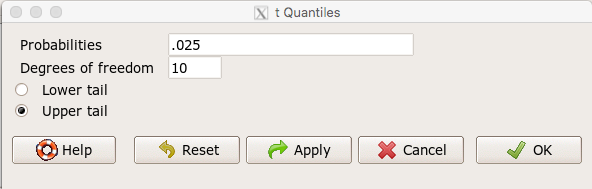
Figure 1. Screenshot t-quantiles Rcmdr menu.
Note we want Type I equal to 5%. Since there are two tails for our test, we divide 5% by two and enter 0.025 and select the Upper tail.
R output
> qt(c(.025), df=10, lower.tail=FALSE)
[1] 2.228139
which is the same thing we would get if we look up on the t-distribution table (Fig 2).
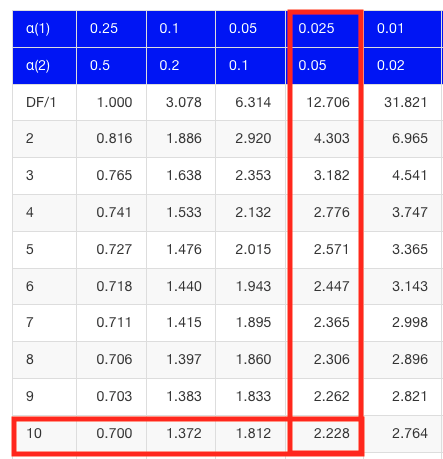
Figure 2. Screenshot of portion of t-table with highlighted (red) critical value for 10 degrees of freedom.
If the test statistic is greater than the critical value, then the conclusion is that the null hypothesis is to be provisionally rejected. We would like to conclude that the alternative hypothesis should favored as best description of the results. However, we cannot — the p-value simply tells us how likely our results would be obtained and if the null hypothesis was true. Confusingly, however, you cannot interpret the p-value as telling you the probability (how likely) that the null hypothesis is true. If however the test statistic is less than the critical value, then the conclusion is that the null hypothesis is to be provisionally accepted.
The test statistic can be assigned a probability or p-value. This p-value is judged to be large or small relative to an a priori error probability level cut off called the Type I error rate. Thus, NHST as presented in this way may be thought of as a decision path — if the test statistic is greater than the critical value, which will necessarily mean that the p value is less than the Type I error rate, then we make one type of conclusion (reject HO). In contrast, if the test statistic is less than the critical value, which will mean that the p-value associated with the test statistic will be greater than the Type I error rate, then we conclude something else about the null hypothesis. The various terms used in this description of NHST were defined in Chapter 8.3.
Sounds confusing, but, you say, OK, what exactly is the controversy? The controversy has to do whether the probability or p-value can be interpreted as evidence for a hypothesis. In one sense, the smaller the p-value, the stronger the case to reject the null hypothesis, right? However, just because the p-value is small — the event is rare — how much evidence do we have that the null hypothesis is true? Not necessarily, and so we can only conclude that the p-value is one part of what we may need for evidence for or against a hypothesis (hint: part of the solution is to consider effect size — introduced in Chapter 9.2 — and the statistical power of the test, see Ch 11). What follows was covered by Goodman (1988) and others. Here’s the problem. Consider tossing a fair coin ten times, with the resulting trial yielding nine out of ten heads (eg, a value of one, with tails equal to zero).
R code
set.seed(938291156)
rbinom(10,1,0.5)
[1] 1 1 1 1 1 1 0 1 1 1
Note 1: To get this result I repeated rbinom() a few times until I saw this rare result. I then used the command get_seed() from mlr3misc package to retrieve current seed of R’s random number generator. Initialize the random seed with the command set.seed().
While rare (binomial probability 0.0098), do we take this as evidence that the coin is not fair? By itself, the p-value provides no information about the alternative hypothesis. More about p-value follows below in sections What’s wrong with the p-value from NHST? and The real meaning and interpretation of P-values.
Statisticians have been aware of limitations of the NHST approach for years (see editorial by Wasserstein et al 2019), but only now is the message getting attention of researchers in the biosciences and other fields. In fact, the New York Times recently had a nice piece by F.D. Flam (“The Odds, Continually Updated,” 29 Sep 2014) on the controversy and the Bayesian alternative. Like most controversies there are strong voices on either side, and it can be difficult as an outsider to know which position to side with (Fig 3).
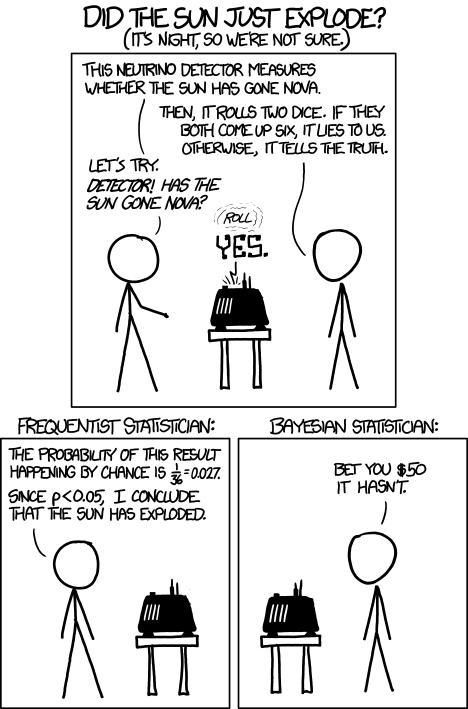
Figure 3. “Frequentists vs. Bayesians,” https://xkcd.com/1132/.
The short answer is — as you go forward do realize that there is a limitation to the frequentist approach and to be on the correct side of the controversy, you need to understand what you can conclude from statistical results. NHST is by far the most commonly used approached in biosciences (eg, out of 49 research articles I checked from four randomly selected issues of 2015 PLoS Biology, 43 used NHST, 2 used a likelihood approach, none used Bayesian statistics). The NHST is also the overwhelming manner in which we teach introductory statistics courses (eg, checking out the various MOOC courses at www.coursera.org, all of the courses related to Basic Statistics or Inferential Statistics are taught primarily from the NHST perspective). However, right from the start I want to emphasize the limits of the NHST approach.
If the purpose of science is to increase knowledge, then the NHST approach by itself is an inadequate framework at best, and in the eyes of some, worthless! Now, I think this latter sentiment is way over the top, but there is a need for us to stop before we begin, in effect, to set the ground rules for what can be interpreted from the NHST approach. The critics of NHST have a very important point, and that needs to be emphasized, but we will also defend use and teaching of this approach so that you are not left with the feeling that somehow this is a waste of time or that you are being cheated from learning the latest knowledge on the subject of statistical inference. The controversy hinges on what probability means.
P-values, statistical power, and replicability of research findings
Science, as a way of knowing how the world works, is the only approach that humans have developed that has been empirically demonstrated to work. Note how I narrowed what science is good for — if we are asking questions about the material world, then science should be your toolkit. Some (eg, Platt 1964), may further argue that there are disciplines in science that have been more successful (eg, molecular biology) than others (eg, evolutionary psychology, cf discussion in Ryle 2006) at advancing our knowledge about the material world. However, to the extent research findings are based solely on statistical results there is reason to believe that many studies in fact have not recovered truth (Ioannidis 2005).
In a review of genomics, it was reported that findings of gene expression differences by many microarray studies were not reproducible (Allison et al 2006). The consensus is that confidence in the findings should hold only for the most abundant gene transcripts of many microarray gene expression profiling studies, a conclusion that undercuts the perceived power of the technology to discover new causes of disease and the basis for individual differences for complex phenotypes. Note that when we write about failure of research reproducibility we are not including cases of alleged fraud (Carlson 2012 on Duke University oncogenomics case), we are instead highlighting that these kinds of studies often lack statistical power; hence, when repeated, the experiments yield different results.
Frequentist and Bayesian Probabilities
Turns out there is a lot of philosophical problems around the idea of “probability,” and three schools of thought. In the Fisherian approach to testing, the researcher devises a null hypothesis, HO, collects the data, then computes a probability (p-value) of the result or outcome of the experiment. If the p-value is small, then this is inferred as little evidence in support of the null hypothesis.
In the Frequentists’ approach, the one we are calling NHST, the researcher devises two hypotheses, the null hypothesis, HO, and an alternative hypothesis, HA. The results are collected from the experiment and, prior to testing, a Type I error rate (α, chance) is defined. The Type I error rate is set to some probability and refers to the chance of rejecting the null hypothesis purely due to random chance. The Frequentist then computes a p-value of result of the experiment and applies a decision criterion: If P-value greater than Type I error rate, then provisionally accept null hypothesis. In both the Fisherian and Frequentist approaches, the probability, again defined at the relative frequency of an event over time, is viewed as a physical, objective and well-defined set of values.
Bayesian approach: based on Bayes conditional probability, one identifies the prior (subjective) probability of an hypothesis, then, adjusts the prior probability (down or up) as new results come in. The adjusted probability is known as posterior probability and it is equal to the likelihood function for the problem. The posterior probability is related to the prior probability and this function can be summarized by the Bayes factor as evidence the evidence against the null hypothesis. And that’s what we want, a metric of our evidence for or against the null hypothesis.
Note 2: A probability distribution function (PDF) is a function of the sample data and returns how likely that particular point will occur in the sample. The distribution is given. The likelihood function approaches this from a different direction. The likelihood function takes the data set as a given and represents how likely are the different parameters for your distribution.
We can calibrate the Bayesian probability to the frequentist p-value (Selke et al 2001; Goodman 2008; Held 2010; Greenland and Poole 2012). Methods to achieve this calibration vary, but the Fagan nomogram Held (2010) proposed is a good tool for us as we go forward. We can calculate our NHST p-value, but then convert the p-value to a Bayes factor by looking at the nomogram. I mention this here not as part of your to do list, but rather as a way past the controversy: the NHST p-value can be interpreted as a Bayesian conditional probability, but they do not test the same hypothesis.
Likelihood
Before we move on there is one more concept to introduce, that of likelihood. We describe a model (an equation) we believe can generate the data we observe. By constructing different models with different parameters (hypotheses), you generate a statistic that yields a likelihood value. If the model fits the data, then the likelihood function has a small value. The basic idea then is to compare related, but different models to see which fits the data better. We will use this approach when comparing linear models when we introduce multiple regression models in Chapter 18.
What’s wrong with the p-value from NHST?
Well, really nothing is “wrong” with the p-value.
Where we tend to get into trouble with the p-value concept is when we try and interpret it. See below, Why is this important to me as a beginning student? The p-value is not evidence for a position, it is a statement about error rates. The p-value from NHST can be viewed as the culmination of a process that is intended to minimize the chance that the statistician makes an error.
In Bayesian terms, the p-value from NHST is the probability that we observe the data (eg, the differences between two sample means), assuming the null hypothesis is true. If we want to interpret the p-value in terms of evidence for a proposition, then we want the conditional error probability.
Sellke et al (2001) provided a calibration of p-values and, assuming that the prior probabilities of the null hypothesis and the alternative hypothesis are equal (that is, that each have a prior probability of 0.5), by using a formula provided by them (equation 3), we can correct our NHST p-value into a probability that can be interpreted as evidence in favor of the interpretation that the null hypothesis is true. In Bayesian terms this is called the posterior probability of the null hypothesis. The formula is

where e is Euler’s number, the base of the natural logarithm (ln), and p is the p-value from the NHST. This calibration works as long as  (Sellke et al 2001).
By convention we set the Type I error at 5% (cf Cohen 1994). How strong of evidence is a p-value near 5% against the null hypothesis being true, again, under the assumption that the prior probability of the null hypothesis being true is 50%? Using the above formula I constructed a plot of the calculated conditional error probability values against p-values (Fig 4).
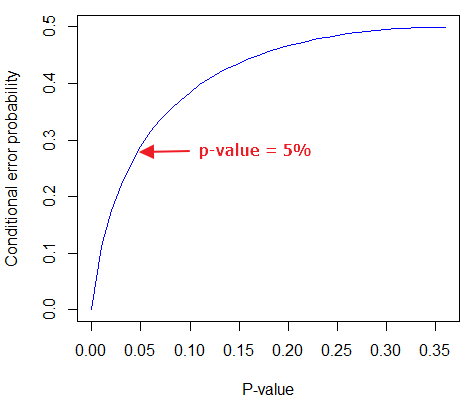
Figure 4. Conditional error probability values plotted against p-values.
As you can see, a p-value of 5% is not strong evidence at just 0.289. Not until p-values are smaller than 0.004 does the conditional error probability value dip below 0.05, suggesting strong evidence against the null hypothesis being true.
R note: For those of you keeping up with the R work, here’s the code for generating this plot. Text after “#” are comments and are not interpreted by R.
At the R prompt type each line
NHSTp = seq(0.00001,0.37,by=0.01)      #create a sequence of numbers between 0.0001 and 0.37 with a step of 0.01
CEP = (1+(-1*exp(1)*NHSTp*log(NHSTp))^-1)^-1    #equation 3 from Sellke et al 2001
plot(NHSTp,CEP,xlab="P-value", ylab="Conditional error probability",type="l",col="blue")
Why is this important to me as a beginning student?
As we go forward I will be making statements about p-values and Type I error rates and null hypotheses and even such things as false positives and false negative. We need to start to grapple with what exactly can be said by p-values in the context of statistical inference, and to recognize that we will sometimes state conclusions that cut some corners when it comes to interpreting p-values. And yet, you (and all consumers of statistics!) are expected to recognize what p-values mean. Always.
The real meaning and interpretation of P-values
This is as good of a time as any to make some clarification about the meaning of p-value and the whole inference concept. Fisher indeed came up with the concept of the p-value, but its use as a decision criterion owes to others and Fisher disagreed strongly with use of the p-value in this way (Fisher 1955; Lehmann 1993).
Here are some common p-value corner-cutting statements to avoid using (after Goodman 2008; Held 2010). P-values are sometimes interpreted, incorrectly, as
Table. Incorrect interpretations of NHST p-values
- the probability of obtaining the observed data under the assumption of no real effect
- an observed type-I error rate
- the false discovery rate, ie, the probability that a significant finding is a “false positive”
- the (posterior) probability of the null hypothesis.
So, if p-values don’t mean any of these things, what does a p-value mean? It means that we begin by assuming that there is no effect of our treatments — the p-value is then the chance we will get as large of a result (our test statistic) and the null hypothesis is true. Note that this definition does not include a statement about evidence of the null hypothesis being true. To get evidence of “truth” we need additional tools, like the Bayes Factor and the correction of the p-value to the conditional error probability (see above). Why not dump all of the NHST and go directly to a Bayesian perspective, as some advise? The single best explanation was embedded in the assumption we made about the prior probability in order to calculate the conditional error probability. We assumed the prior probability was 50%. For many, many experiments, that is simply a guess. The truth is we generally don’t know what the prior probability is. Thus, if this assumption is incorrect, then the justification for the formula by Sellke et al (2001) is weakened, and we are no closer to establishing evidence than before.
The take home message is that it is unlikely that a single experiment will provide strong evidence for the truth. Thus the message is repeat your experiments — and you already knew that! And the Bayesians can tell us that with the addition of more and more data reduces the effect of the particular value of the prior probability on our calculation of the conditional error probability. So, that’s the key to this controversy over the p-value.
Reporting p-values
Estimated p-values can never be zero. Students may come to use software that may return p-values like “0” — I’m looking at you Google Sheets re: default results from CHISQ.TEST() — but again, this does not mean the probability of the result is zero. The software simply reports values to two significant figures and failed to round. Some journals may recommend that 0 should be replaced by p < 0.01 or even < 0.05 inequalities, but the former lacks precision and the latter over-emphasizes the 5% Type I error rate threshold, the “statistical significance” of the result. In general, report p-value to three significant figures and four digits. If a p-value is small, use scientific notation and maintain significant digits. Thus, a p-value of 0.004955794 should be reported as 0.00496 and a p-value of 0.0679 should be reported as 0.0679. Use R’s signif() function, for example p-value reported as 6.334e-05, then
signif(6.334e-05,3)
[1] 6.33e-05
Rounding and significant figures were discussed in Chapter 3.5. See Land and Altman (2015) for guidelines on reporting p-values and other statistical results.
Questions
- Revisit Figure 1 again and consider the following hypothesis — the sun will rise tomorrow.
- If we take the Frequentist position, what would the null hypothesis be?
- If we take the Bayesian approach, identify the prior probability.
- Which approach, Bayesian or Frequentist, is a better approach for testing this hypothesis?
- Consider the pediatrician who, upon receiving a chest X-ray for a child notes the left lung has a large irregular opaque area in the lower quadrant. Based on the X-ray and other patient symptoms, the doctor diagnoses pneumonia and prescribes a broad-spectrum antibiotic. Is the doctor behaving as a Frequentist or a Bayesian?
- With the p-value interpretations listed in the table above in hand, select an article from PLoS Biology, or any of your other favorite research journals, and read how the authors report results of significance testing. Compare the precise wording in the results section against the interpretative phrasing in the discussion section. Do the authors fall into any of the p-value corner-cutting traps?
Quiz Chapter 8.2
The controversy over proper hypothesis testing
Chapter 8 contents
- Introduction
- The null and alternative hypotheses
- The controversy over proper hypothesis testing<.span>
- Sampling distribution and hypothesis testing
- Tails of a test
- One sample t-test
- Confidence limits for the estimate of population mean
- References and suggested readings
6 – Probability, Distributions
Introduction
Probability is how likely something, an event, is likely to occur, ie, a prediction of the future. Related, we can ask of the likelihood of an event, which is like working backwards. The event has already occurred and we ask how well a model (parameters) explain the observed data.
Working with probability allows us to contextualize the inherent uncertainty in any measure, which in turn allows us to interpret results from hypothesis tests of observational or experimental data sets. Thus, an important concept to appreciate is that in many cases, like R.A. Fisher’s Lady tasting tea analogy, we can count in advance all possible outcomes of an experiment.
For many more experiments, we cannot count all possible outcomes of the sample space, either because they are too numerous or simply unknowable. In such cases, applying theoretical probability distributions allow us to circumvent the countability problem. Whereas empirical probability distributions are frequency counts of observations, theoretical probabilities are based on mathematical formulas.
At this stage of your training in statistics, you would spend time with the foundations of probability. Scenarios of likelihood of single events regardless of other events are called marginal probability, whereas the union refers to at least one event occuring. The likelihood of two or more events occuring at the same time is called joint probability. Worked examples are presented in the chapter, although the bulk of this chapter concerns conditonal probability, the likelihood of one event occuring given another event already happened. Working with conditional probability is essential for risk analysis, which we introduce in Chapter 7 – Probability, Risk Analysis and expand in Chapter 7.3 – Conditional Probability and Evidence Based Medicine and Chapter 7.4 – Epidemiology: Relative risk and absolute risk, explained.
Probability distributions are key to the null hypothesis significance testing framework for statistical inference. Given assumptions about the data, probability distributions are used to evaluate the likelihood of observing data under the null hypothesis, eg, no difference between means of a control group compared to a treatment group. Much of classical inferential statistics, especially the kind one finds in introductory courses like ours, are built on probability distributions. ANOVA, t-tests, linear regression, etc., are parametric tests and assume errors are distributed according to a particular type of distribution, the normal or Gaussian distribution.
A probability distribution is a list of probabilities for each possible outcome of a discrete random variable in an entire population. Depending on the data type, there are many classes of probability distributions. In contrast, probability density functions are used to for continuous random variables. This chapter begins with basics of probability then gently introduces discrete and continuous probability distributions. In the other sections of this chapter we describe several probability density functions. Emphasis is placed on the normal distribution, which underlies most parametric statistics.
Homework to go with this topic
Homework 3: Distributions & Probability in Mike’s Workbook for Biostatistics.
Quizzes in this chapter
A total of 88 questions among the several subchapters, a mix of true or false and multiple choice question format.
Chapter 6 contents
- Introduction
- Some preliminaries
- Ratios and proportions
- Combinations and permutations
- Types of probability
- Discrete probability distributions
- Continuous distributions
- Normal distribution and the normal deviate (Z)
- Moments
- Chi-square distribution
- t distribution
- The F distribution
- References and suggested readings