11 – Power analysis
Introduction
The power of a statistical test is the probability that the test will reject the null hypothesis when the alternative hypothesis is true. Most of us are used to thinking that a hypothesis is either right or it is wrong: a Doctor’s diagnosis is correct, the patient has the disease, or the patient does not; an experimental result is objectively true — ie, true independent of the observer’s subjectivity — or it is false. As we work through a typical science curriculum, we may even take to heart that, unlike mathematicians, scientists don’t prove scientific ideas no matter how well supported by evidence. Our acceptance of scientific theories is provisional; if new evidence comes along, we revise and if warranted, we abandon the theory in favor of new explanation. However, even this point does not completely reflect the point we are making from statistical thinking. One of the more challenging concepts for new statistics students to understand is that outcomes of a Doctor’s diagnosis or that of an experiment are associated with probability.
The concept of statistical power helps to relate how our ability to confidently conclude one outcome over an another. Statistical power depends on
- What Type I error rate we set
- The effect size or difference between affected and unaffected groups
- The sample size
- The variability of the subjects
These concepts have all been introduced before, but the idea that even a well designed experiment may lack the capability of detecting “truth” is a new and important topic to add to your growing statistical thinking tool kit.
Quizzes in this chapter
A total of 28 questions among the several subchapters, a mix of true or false and multiple choice question format.
Chapter 11 contents
- Introduction
- What is Statistical Power?
- Prospective and retrospective power
- Factors influencing statistical power
- Two sample effect size
- Power analysis in R
- References and suggested readings
5.3 – Replication, Bias, and Nuisance Variables
Introduction
This page describes additional elements of experimental design, replication and bias, which can impact the validity of a study.
Replication in science refers to repeating an experiment under identical conditions multiple times. To the extent the same conclusions are achieved, we can say the outcome is reproducible (Simmons 2014) and, therefore, likely to be objectively true (Earp 2011). Replication of experimental and sampling units is an essential component of good experimental design. Confusing technical replicates for biological replicates is called pseudoreplication.
Bias refers to any of a number of sociological and cognitive errors which may influence conclusions in science (Ionnidis 2005). In a meta-analysis, Fanelli et al (2017) reported that while the size of effect from identifiable biases were small, some disciplines were more prone to these sources of error. That researchers testing similar hypotheses reach different conclusions may result from bias. One such bias is positive outcome bias, where reports of null hypotheses are more often rejected than they should be based on sample size and other concerns of statistical power (see Chapter 11 – Power analysis).
The page concludes with a discussion of nuisance variables, variables that may be causally associated with the outcome of interest, but themselves are either of no interest in the study, or may not be known in advance (Meehl 1970; see also discussion of spurious correlations in Chapter 16.3 – Data aggregation and correlation).
Technical vs. biological replicates.
A laboratory technician retrieves a vial of an immortalized cell line from cryostorage and initiate propagation of the cells for the week’s work. After a couple of days of subculturing, the technician has grown millions of cells and is ready to set up an assay. After washing the cells in PBS (phosphate buffered saline), the technician adjusts the concentration of cells to 10,000 per mL media, places the tube on ice, and proceeds to set up a 48 well microplate. To each well, the technician adds media, one or more agents (Table 1), plus cells, total volume each well at one mL, three replicates per treatment.
Table 1. In our example there were four treatments plus a control (media only)
- DMSO only (D)
- DMSO + Cytokine (DC)
- DMSO + Small molecule Inhibitor (DS)
- DMSO + Cytokine + Small molecule Inhibitor (DCS)
- Media only (M)
The plate table might look something like Figure 1.

Figure 1. Schematics of a set up for a hypothetical 48 well microplate (plate_plot() from ggplate package).
The technician has done a lot of work; but, from a statistician’s point of view, effectively the technician has but one sampling unit to show for his efforts; one biological sampling unit because as far as we can tell, the cells were all related. Biological replication refers to repeat measures (eg, same conditions) on biologically distinct entities (Blainey et al 2014). Technical replication, in contrast, refers to repeat measures on the same entity, eg, the same individual (Blainey et al 2014).
However, there were more than one technical samples in the experimental design, twelve in all because there were twelve wells. Many of you will recognize this as the distinction between technical and biological replicates. In thinking about experimental design replicates pertain to the number of sampling units that are treated the same way. In our example cells may be “treated the same way” in at least two distinct ways. Biologically, the cells may be the same: derived from the same clonal cell, all at the same passage (generation) number, each cell genetically, morphologically, physiologically (etc.,) identical to the next cell. Technical replication on the other hand pertains to the levels of the treatments.
Within each of these treatments we had three wells, and that’s at the level of the technical replication.
A final note on this experiment. We as molecular biologists call each of these treatment groups, but statisticians thinking of this design would recognize only one treatment (called in statistics a factor), with four levels of the treatment. We will discuss this beginning in chapter 12 when we introduce analysis of variance.
Types of bias.
When we make decisions, we like to think we are rational; that we make decisions based on an evaluation of evidence. And yet, an increasing body of literature suggests that our decisions often made in a manner that falls short of rational processing. We outlined some sources of bias in Chapter 2.6. Deviance from rational decision making is due to any number of cognitive biases we may have. Researchers and medical doctors make many decisions and, unfortunately, are just as susceptible to cognitive biases as the rest of us. One kind of bias that is bedeviling to research is confirmatory bias. Confirmatory bias refers to a researcher in effect seeking evidence in a way that confirms a prior conclusion (Kaptchuck 2003). Confirmatory bias would be exhibited if we report positive effects of aspirin to relieve migraines in subjects, but exclude cases where the subjects report no improvement. Medical doctors may be risk averse and therefore tend to over-prescribe, or they may be risk-takers (eg, rise and fall of high-dose chemotherapy, cf, discussion in Howard et al. 2011).
The concept of bias was first introduced in Chapter 3 and will be returned to in subsequent chapters. In general, bias refers to the objectivity of measurement and inferences about such measurements. Bias implies that a series of measurements consistently fail to return the true value of the variable. Bias is systematic error and may be associated with a poorly calibrated instrument or even the use of improper sets of rules for measurement given the nature of the characteristic. Bias can be captured by the concept of accuracy.
Bias is challenging to eliminate; the best way is to design the experiment so that the observer, the researcher, is unaware of the specific questions to be tested. The research is conducted “blind.” Clinical research provides the easiest examples. A trial can be blind in a couple of ways:
- The subjects do not know which treatment they receive, but the researcher does know
- The researcher does not know which treatment subjects receive, but the subjects know
- Neither the researcher nor the subjects know which treatment they receive.
- The other possibility is that both the researcher and the subjects know treatments received — this would be a poor design.
Bias can enter a research project at multiple levels. A partial list of sources of bias in research includes (modified after Pannucci and Wikins 2010):
Bias that occurs before the experiment
- Inadequate planning of the experiment, flawed design
- Bias in selection of subjects from the reference population
- Surveillance bias, where one group is studied more closely than another group.
Surveillance bias, also called detection bias or ascertainment bias, a type of information bias. Characterized as “the more you look, the more you find (Sackett 1979),” differences in outcome counts varies with differences in effort to detect. Recently, cases of myocarditis in young people were reported following Covid-19 mRNA vaccination (eg, Bozkurt et al 2021. Marshall et al 2021). However, myocarditis reports following vaccination occur at the rates expected in the population, and the reports lack important context (eg, other respiratory viruses known to cause myocarditis not ruled out), suggesting the putative link between Covid-19 vaccines and this heart condition may be result of us looking hard for signs of adverse effects of the vaccine (cf, discussion in O’Leary and Maldonado 2021).
Bias during the experiment
- Interviewer bias
- Chronology bias
- Recall bias
- Transfer bias
- Misclassification of exposure or outcome
- Performance bias
Performance bias refers to conditions of an experiment that introduce unintended differences between groups. For example, subjects enrolled in a weight-loss study randomly assigned to the control group may react poorly when they realize they are not receiving the experimental intervention. This leads to potential for a systematic bias — participants in the control group may behave differently, counteracting the point of randomization (McCambridge et al 2014).
Another well-known performance bias is associated with eliciting maximal performance from animals, such as running stamina or maximum sprint running speed (Losos et al 2002). For example, spring running speed of lizards may be measured by placing lizards onto a high-speed treadmill, then increasing belt speed to match the individual’s burst performance (eg, Dohm et al 1998). Clearly, not all individuals will perform to maximum physiological capabilities under these conditions.
Bias after the experiment
- Citation bias
- Confounding
Another way to view sources of bias is that, at least from the perspective of the researcher, the bias is likely to be unconscious bias. After all, if we knew about the sources of bias we would work our experiments in such a way to minimize known error producing sources (Holman et al 2015). Selecting subjects at random and keeping record keeping blind with respect to treatments are among the best tools we have to avoid this kind of bias.
Nuisance variables
A key quality of experimental design is the opportunity afforded the researcher to apply control. In a classic view of the experiment, one allows only one aspect to vary, the treatment applied, all else is controlled. Thus, any difference in outcome may be attributed to the treatment. However, it is likely impossible to control for all possible variables that may affect our outcome; confounding clear interpretation of results (see Chapter 16.2 and 16.3). Consider, for example, the effects of age on running performance (Fig. 2).
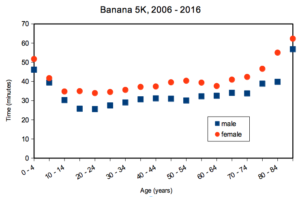
Figure 2. Mean 5K running times (minutes) by age and gender (2006 – 2016, Jamba Juice Banana 5K race, Honolulu, HI).
If we are interested in gender differences, we must also deal with the change in performance with age: older runners regardless of gender tend to run slower than younger runners. Thus, in the comparison of genders, age is a nuisance variable. In the literature, you may see “lurking variable,” or other such names. The concept is that these variables may be causal, but are either of no interest in the study, or may not be known in advance. Therefore, age must be accounted for before we can address gender differences, if any. Age, in this case, is considered a nuisance variable because we are not primarily interested in age effects, but age clearly covaries (is associated) with running performance. How best to handle nuisance variables? One approach is to match by age (blocking effect, see Chapter 14.4); another approach would be to randomly select with respect to age when compiling female and male times.
Another example of confounding. Results from ecological experiments intended to test for presence of competition for resources by plant species by removing plants may alter herbivory levels; thus, survivorship not the result of reduced plant-plant competition but because of changes in herbivore behavior (Reader 1992).
Questions
- I cite a number of articles in Mike’s Biostatistics Book. If you’re paying attention, you’ll have noticed that all of my citations, at least for articles, link to a source that you can either download or read online. What kind of error am I committing by following this approach?
- In large part because of the tendency for overuse of antibiotics, doctors are less likely today to prescribe antibiotics for patients with upper respiratory tract infections than in the past (Zoorob et al 2012). URTI are mostly caused by rhinovirus infections (Calderaro et al 2022) and, therefore, the course of infection in a patient should be unaffected by addition of antibiotic. However, although rare compared to URTI, life-threatening illness like acute epiglottitis caused by bacteria infection can sometimes develop or accompany URTI. Thus, not prescribing antibiotics at a diagnosis of URTI may risk a worsening condition for the patients. This sets the doctor up for a potential cognitive bias – to prescribe or not to prescribe antibiotics prophylactically? Discuss this decision in the context of potential sources of cognitive biases and possible outcomes of the decision.
Quiz Chapter 5.3
Replication, bias, and nuisance variables
Chapter 5 contents
- The basics explained
- Experiments
- Experimental and Sampling units
- Replication, Bias, and Nuisance Variables
- Clinical trials
- Importance of randomization in experimental design
- Sampling from Populations
- References and suggested readings
2.6 – Statistical reasoning
How statistical reasoning helps us spot and reduce bias.
.
So far in the course we have talked about statistical reasoning. Statistical reasoning as part of the critical thinking tool kit. What this should mean for you in practice is that we will be developing and enhancing your critical thinking skill set. Here, we’ll define our terms and place statistical reasoning in context.
Critical thinking.
.
What do I mean by critical thinking? You’ll find various definitions and discussions, but the Wikipedia entry on the subject seems as good a start as anything else I have heard or read:
“Critical thinking is a way of deciding whether a claim is always true, sometimes true, partly true, or false” (5 August 2013, http://en.wikipedia.org/wiki/Critical_thinking).
Which raises the question, what is truth (false)? And what about the frequency qualifiers “always,” “sometimes,” “partly”? This hints at one of the strengths of science; “Truth in science … is never final, and what is accepted as fact today may be modified or even discarded tomorrow” (p. 2, National Academy of Science 1999). Scientists extend and even correct the work of their predecessors.
Critical thinking has many definitions, but they coalesce broadly as the search for rational justification — arguments and decisions based on reason not emotion — given sets of facts. We’ll define facts as assertions about the world that are verifiably true. Related to facts, we define evidence as collection of facts used to infer an assertion or belief is objectively true. Objectivity holds independently of the observer. In practice, critical thinking can be improved by identifying and developing certain skill sets, from deductive reasoning to use of a statistical toolkit, although skills alone do not necessarily lead to sound critical thinking (Bailin 2002). Emphasis on the importance of statistical reasoning, for example in the Evidence-Based Medicine (EBM) approach, is now well established. EBM is an expansive concept, but includes the philosophy that decisions in medicine and health care should be based on evidence (results) from well designed and executed research. More generally, much has been written on the subject. My purpose here is to sell you just a bit that you will learn more than formulas and statistical tests in this course; if we do this right you will improve your critical thinking skills.
And the tool kit for critical thinking? Science has the scientific method to offer. In turn, by adopting statistical reasoning approaches you will be more cognizant of whether or not you are indeed engaged in critical thinking about your work.
A working checklist for critical evaluation of a project
- “All sides” of the problem are fairly represented
- Authority is not synonymous with empirical truth: trust, but verify
- Correlation (association) may or may not infer causation
- Do conflicts of interest compromise conclusions?
In other words, identify and rigorously consider assumptions made to reach conclusions, evidence given in support of conclusions, and considerations of bias held by the researcher. The “all sides” part requires judgement — not all sides of a research question are equally valid; the point about “fair” representation requires that opposing arguments are actually held by others and not simply a “”straw man” characterization of of a position held by no one.
Rigid adherence to “how to do science checklist” is likely to be wanting and thus practicing and successful scientists show more flexibility. And, the list is certainly incomplete because it presumes observations and data collection are from a reliable, unbiased source. Before proceeding with how statistics informs our critical thinking in science, let’s illustrate bias.
Bias everywhere.
.
Bias is defined as any tendency that may hamper our ability to answer a question without prejudice (Pannucci and Wilkins 2010). Although we tend to think of ourselves as highly rational (Note 1), psychologists have documented, named numerous, and in some cases, highly specific kinds of cognitive biases we may have about “real world data” that may impair our judgment about results of experiments.
Note 1. A handful of Nobel prizes were awarded over evidence and theory on just how unrational we are, see Simon (1978), Kahneman (2002), and Thaler (2017, whose views were immortalized in the movie The Big Short).
At its best, application of the scientific method is our best tool kit to help protect our conclusions against bias (Nuzzo 2015), by proper experimental design and possible study biases. A couple of comics from xkcd illustrate.
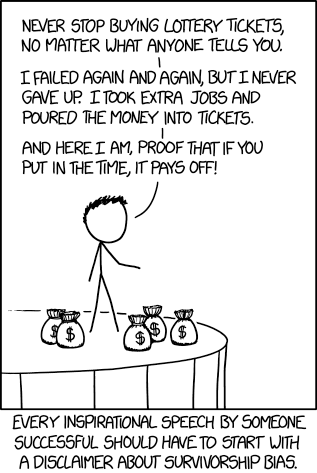
Figure 1. “Survivorship bias,” https://www.xkcd.com/1827/ .
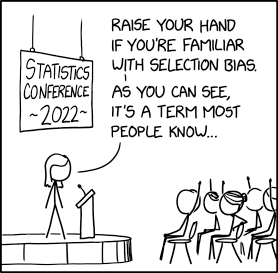
Figure 2. “Selection bias,” https://xkcd.com/2618/ .
Wikipedia lists dozens of named biases which may influence our ability to interpret science:
- confirmation bias, eg, given extraneous information about ancestry or sex, forensic investigators were more likely to assign ancestry or sex of skeletal evidence to group that confirmed the contextual information (Nakhaeizadeh et al 2014).
- congruence bias, a type of confirmation bias, the tendency to test only a favorite or initial hypothesis over consideration of alternative hypotheses.
- observer-expectancy bias, eg, randomized controlled trials of acupuncture often find equivalent responses to real and placebo acupuncture despite both appearing superior to no treatment (Colagiuri and Smith 2012).
- selection bias, the selection of individuals, groups, or data for analysis in such a way that proper randomization is not achieved, eg, mitotic counts (Cree et al 2021) and cell differentials and Figure 2. Selection bias, where the study population is not well-defined or if is, the method by which subjects are recruited favors one kind of subject over another.
- surveillance bias, eg, association between myocarditis and COVID-19 vaccines may be due to increased focus to identify myocarditis (Husby et al 2021).
- survivorship bias, focusing on subjects that passed a selection process as if they represent an entire group, eg, from ecology: rare species more likely to go extinct than abundant species (Lockwood 2003) and Figure 1.
Bias in research may occur at any level, from study design to analysis and publication of results. Bias leads to systematic errors that may favor one outcome over others. Clearly then, bias is something one wants to avoid in science, and most scientists would probably agree strongly that bias is unacceptable. However, bias can creep into projects in many forms.
Particularly pernicious causes of bias are conflicts of interest, with the notable case of a 1990’s set of trials in gene therapy (Wilson 2010). Biased research may be more harmful to science than deliberate misconduct, at least in part because there are, or should be, mechanisms to detect fraud (eg, Marusic et al 2007). If errors in data analysis or management are rare, we can trust the results; if errors are common, systematic, or deliberate falsification, then any conclusions drawn from such work deserves retraction at the very least (cf. discussion in Baggerly and Coombs 2009; see StatCheck project, Nuijten et al 12016).
Bias in research.
.
Bias is not limited to obvious profit seeking or even defense of one’s ideas or reputation. Bias can enter research in subtle ways. Prior to 2000, many post-menopausal women could expect to be placed on hormone replacement therapy (HRT) to manage post-menopausal symptoms and to reduce likelihood of osteoporosis later in life. Moreover, HRT was believed based on research to show protective benefits against heart disease (eg, Nabulsi et al 1993; Grodstein et al 2000). However, other prospective studies that were designed to reduce many sources of bias in patient recruitment (Women’s Health Initiative Study Group 1998), found the opposite: HRT may increase risk of heart disease as well as other diseases (Rossouw et al 2002). Since the 2002 Women’s Health Initiative study report, the costs and benefits of HRT have been furiously debated (Lukes 2008).
The purpose of this chapter, however, is not to exhaustively review sources of bias. Instead, we leave you with a partial list of kinds of bias in clinical trials (from a review by Pannucci and Wilkins 2010).
- Bias during study design, eg, use of subjective measures or poorly designed questionnaires.
- Interviewer bias, for example, if the interviewer is aware of the subject’s condition
- Chronology bias, where the control subjects may not be observed in the same time frame as the treatment subjects
- Citation (reporting) bias, where negative results are not reported
- Confounding, where results may be due to factors not properly controlled that also affect the outcome. An example provided was link between income and health status, which would be confounded by access to health care.
These are but a few of the kinds of bias that even proper research may be influenced by. Solutions are to randomize, to double-blind, and to avoid reporting bias. Controls of sources of bias increase the validity of the research. How experimental design may control for bias is discussed further in Chapter 5.3.
A case study.
.
Stories we hear from the news or from our friends about health or the environment are anecdotal. A basic rule in critical thinking is to distinguish between argument that is built on anecdotal evidence and argument based on scientific evidence. Let’s evaluate the following real-world example.
Airborne® is a leading dietary supplement. Here’s what their website has to say about the product.
“Scientific research confirms that Airborne proprietary formulation with 13 vitamins and minerals plus a blend of health-promoting herbs, does indeed enhance immunity (5 August 2013, http://www.airbornehealth.com/our-story).
This next statement appears in smaller text near the bottom of the page.
“These statements have not been evaluated by the Food and Drug Administration. These products are not intended to diagnose, treat, cure or prevent disease” (5 August 2013, http://www.airbornehealth.com/our-story).
So, in short, how do you evaluate Airborne? The claim is that “scientific research confirms that Airborne … enhance immunity,” and yet, there is a statement that follows that suggests that the claim has not been evaluated by the agency legally responsible in the USA for determining the efficacy of medicine and treatments.
Note 2. “enhance” immunity is a vacuous phrase. Immunity is not a single object. If by immunity we mean resistant to a particular pathogen, this cannot be what the makers literally mean because that would be in violation of the FDA. Yes, deficiencies of vitamin C and other nutrients impair immune function (Carr and Maggini 2017), but there is no evidence to support the claim that Vitamin C supplementation above RDA, recommended dietary allowances, improves resistance. See 2013 Cochrane Review.
Are not these in contradiction? In the USA, supplement manufactures’ need not seek FDA approval. In fact, the U.S. Congress, in it’s passing of the The Dietary Supplement Health and Education Act of 1994 (DSHEA), specified what needs to be reported to the FDA; statements of “enhancing immunity” are lawful, but do not require the supplement manufacture to show evidence that their product provides this support, only that ingredients in the supplement may do so.
Returning to the statements from Airborne Health, how may these statements be interpreted?
- peer-reviewed articles testing Airborne are available
- that experiments were conducted without bias
- and that to “enhance immunity” is something one could measure
Let’s look at #3 first. A search of PubMed (December 2013) for the phrase “enhance immunity” returned 9171 hits. I didn’t look through the more than 9000 articles, but a quick look shows that the term is indeed used in research, but carries a wide range of interpretations. For one paper “enhance immune” response was the result of genetic modifications to T-cells and how they responded to a virus (PMID:24324159).
Adding “vitamin” to the search resulted in just 158 hits in PubMed; none of these are about Airborne (see claim #1 and #2). However, to be fair, go back and look at their statement — notice they are not saying exactly that anyone has studied Airborne (otherwise they’d probably list the papers), just that vitamins and minerals and herbs that are in Airborne have been studied.
Indeed, vitamins A, C, E and minerals like zinc and selenium that are in Airborne are among the 158 papers. To be additionally fair to Airborne, there are indeed many papers investigating benefits (harm) of supplemental vitamins and minerals — and again, being charitable here, what we can say is that results are at best inconsistent (Bjelakovic et al 2014; Comerford 2013).
The manufacturer of Airborne ran into some trouble with the FTC and ended up paying over $20 million US dollars to settle the lawsuit. The one study, not peer-reviewed, of Airborne’s effectiveness cited during these proceedings apparently was sponsored by Airborne’s manufacturer. Airborne was acquired by Schiff Vitamins March 2012 (Bloomberg News). Click here for additional reading about Airborne.
About peer-review.
.
Evaluation of claims made, research reported, and ideas in science are generally expected to be subject to peer-review by knowledgeable persons in the field. Effective peer-review is an important “gatekeeper” in science (Siler et al 2015, Tennant 2018). Proper peer review gives legitimacy to research (Siler et al 2015). The traditional peer review system is a closed system, which includes elements controlled by journal editors and is based on reviewer identify remaining anonymous. The closed peer-review system is not the only option: many have argued for an open review process (eg, Pöschl 2012, Ho et al 2013).
Does the Airborne story meet your definition of bias?
.
Airborne made health claims I about their product; these claims were found by the federal government to be misleading but does not fit into our discussion of bias. Instead, Airborne story fits more with critical thinking: I think it is rather a casual position to say that we should, and do, think critically of news source or the stories our friends tell us about health.
But bias in science occurs too, and can be very difficult to control or completely eliminate.
Learning statistical reasoning will help develop critical thinking skills.
.
In addition to considering sources of bias, ie, can you trust the messenger, thinking about the sets of facts offered to bolster a claim, it helps to evaluate each fact to see if
- The author is really talking about correlation and has not in fact provided evidence of causation
- vs. experiment, which tests “cause” manipulate
X, doesYchange?
- vs. experiment, which tests “cause” manipulate
- Measurement appropriate?
- Direct or indirect
- Unmeasured important (co)variable
Questions.
.
- Write up three learning outcomes for this page. Hint: Point your favorite generative AI to this page and ask for help.
- The xkcd comic in Figure 1 titles calls it survivorship bias. Provide a definition for this kind of bias and describe the effects on conclusions if it is not accounted for.
- Doctors are encouraged to engage in “evidence based medicine,” that is, decisions about care should be based on data. How may confirmatory bias (from the patient’s point of view, from the doctor’s point of view) influence a discussion of “facts” when deciding on a course of medication therapy — between a well-established medication with many known side-effects and a new, recently approved medicine reported to be as effective as the standard treatment.
Quiz Chapter 2.6
Statistical reasoning
Chapter 2 contents
.