12.2 – One way ANOVA
Introduction
In ANalysis Of VAriance, or ANOVA for short, we likewise have tools to test the null hypothesis of no difference between between categorical independent variables — often called factors when there’s just a few levels to keep track of — and a single, dependent response variable. But now, the response variable is quantitative, not qualitative like the  tests.
Analysis of variance, ANOVA, is such an important statistical test in biology that we will take the time to “build it” from scratch. We begin by reminding you of where you’ve been with the material.
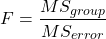
We already saw an example of this null hypothesis. When there’s only one factor (but with two or more levels), we call the analysis of means and “one-way ANOVA.” In the independent sample t-test, we tested whether two groups had the same mean. We made the connection between the confidence interval of the difference between the sample means and whether or not it includes zero (ie, no difference between the means). In ANOVA, we extend this idea to a test of whether two or more groups have the same mean. In fact, if you perform an ANOVA on only two groups, you will get the exact same answer as the independent two-sample t-test, although they use different distributions of critical values (t for the t-test, F for the ANOVA — a nice little fact for you square the t-test statistic, you’ll get the F-test statistic:  ).
Let’s say we have an experiment where we’ve looked at the effect of different three different calorie levels on weight change in middle-aged men.
I’ve created a simulated dataset which we will use in our ANOVA discussions. The data set is available at the end of this page (scroll down or click here).
We might graph the mean weight changes ( SEM); Below are two possible outcomes of our experiment (Fig 1).
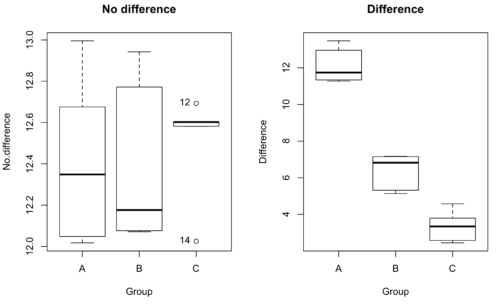
Figure 1. Hypothetical results of an experiment, box plots. Left, no difference among groups; Right, large differences among groups.
As statisticians and scientists, we would first calculate an overall or grand mean for the entire sample of observations; we know this as the sample mean whose symbol is  . But this overall mean is made up of the average of the sample means. If the null hypothesis is true, then the all of the sample means all estimate the overall mean. Put another way, being a member of a treatment group doesn’t matter, ie, there is no systematic effect, all differences among subjects are due to random chance.

The hypotheses among are three groups or treatment levels then are:

Null that there are no differences among the group means. And the alternative hypotheses include any (or all) of the following possibilities

or maybe

or… have we covered all possible alternate outcomes among three groups?
In either case, we could use one-way ANOVA to test for “statistically significant differences.”
Three important terms you’ll need for one-way ANOVA
FACTOR: We have one factor of interest. For example, a factor of interest might be
- Diet fed to hypertensive subjects (men and women)
- Distribution of coral reef sea cucumber species in archipelagos
- Antibiotic drug therapy for adolescents with Acne vulgaris (click see Webster 2002 for review).
Note 1: Character vs factor. In R programming, while it is true that a treatment variable can be a character vector like Gender*, such vectors are handled by R as string. In contrast, by claiming Gender as a factor, R handles the variable as a nominal data type. Hence, ANOVA and other GLM functions expect any treatment variable to be declared as a factor:
Gender <- c("Gender non-conforming", "Men", "Non-binary", "Transgender", "Women", "Declined"); Gender
[1] "Gender non-conforming" "Men" "Non-binary" "Transgender"
[5] "Women" "Declined"
# it’s a string vector, not a factor
is.factor(Gender)
[1] FALSE
Change string vector to a factor.
Gender <- as.factor(Gender); is.factor(Gender) [1] TRUE
* For discussions of ethics of language inclusivity and whether or not such information should be gathered, see Henrickson et al 2020.
LEVELS: We can have multiple levels (2 or more) within the single factor. Some examples of levels for the Factors listed:
- Three diets (DASH), diet rich in fruits & vegetables, control diet)
- Five archipelagos (Hawaiian Islands, Line Islands, Marshal Islands, Bonin Islands, and Ryukyu Islands)
- Five antibiotics (ciprofloxacin, cotrimoxazole, erythromycin, doxycycline, minocycline).
RESPONSE: There is one outcome or measurement variable. This variable must be quantitative (ie, on the ratio or interval scale). Continuing our examples then
- Reduction in systolic pressure
- Numbers of individual sea cucumbers in a plot
- number of microcomedo.
Note 2: A comedo is a clogged pore in the skin; a microcomedo refers to the small plug. Yes, I had to look that up, too.
The response variable can be just about anything we can measure, but because ANOVA is a parametric test, the response variable must be normally distributed!
Note on experimental design
As we discuss ANOVA, keep in mind we are talking about analyzing results from an experiment. Understanding statistics, and in particular ANOVA, informs how to plan an experiment. The basic experimental design is called a completely randomized experimental design, or CDR, where treatments are assigned to experimental units at random.
In this experimental design, subjects (experimental units) must be randomly assigned to each of these levels of the factor. That is, each individual should have had the same probability of being found in any one of the levels of the factor. The design is complete because randomization is conducted for all levels, all factors.
Thinking about how you would describe an experiment with three levels of some treatment, we would have
Table 1. Summary statistics of three levels for some ratio scale response variable.
| Level 1 |
sample mean1 |
sample standard deviation1 |
| Level 2 |
sample mean2 |
sample standard deviation2 |
| Level 3 |
sample mean3 |
sample standard deviation3 |


Note 3: Table 1 is the basis for creating the box plots in Figure 1.
ANOVA sources of variation
ANOVA works by partitioning total variability about the means (the grand mean, the group means). We will discuss the multiple samples and how the ANOVA works in terms of the sources of variation. There are two “sources” of variation that can occur:
- Within Group Variation
- Among Groups Variation
So let’s look first at the variability within groups, also called the Within Group Variation.
Consider and experiment to see if DASH diet reduces systolic blood pressure in USA middle-aged men and women with hypertension (Moore et al 2001). After eight weeks we have
We get the corrected sum of squares, SS, for within group

and the degrees of freedom, DF, for within groups

where i is the identity of the groups,  is the individual observations within group i,
 is the group i mean, ni is the sample size within each group, N is the total sample size of all subjects for all groups, and k is the number of groups.
Importantly, this value is also referred to as “error sums of squares” in ANOVA. It’s importance is as follows — In our example, the within group variability would be zero if and only if all subjects within the same diet lost exactly the same amount of weight. This is hardly ever the case of course in a real experiment. Because there are almost always some other unknown factors or measurement error that affect the response variable, there will be some unknown variation among individuals who received the same treatment (within the same group). Thus, the error variance will generally be larger than zero.
The first point to consider: your ANOVA will never result in statistical differences among the groups if the error variance is greater than the second type of variability, the variability between groups.
The second type of variability in ANOVA is that due to the groups or treatments. Individuals given a calorie-restricted diet will lose some weight; individuals allowed to eat a calorie-rich diet likely will gain weight, therefore there will be variability (a difference) due to the treatment. So we can calculate the variability among groups. We get the corrected sum of squares for among groups

and the degrees of freedom for among groups

where i is the identity of the groups, is the grand mean as defined in Measures of Central Tendency (Chapter 3.1), is the group i mean, ni is the sample size within each group, N is the total sample size of all subjects for all groups, and k is the number of groups.
The sums of squares here is simply subtracting the mean of each population from the overall mean.
- If the Factor is not important in explaining the variation among individuals then all the population means will be similar and the sums of squares among populations would be small.
- If the Factor is important in explaining some of the variation among the individuals then all the population means will NOT be the same and the sums of squares among populations would be large.
Finally, we can identify the total variation in the entire experiment. We have the total sum of squares.

Thus, the insight of ANOVA is that variation in the dataset may be attributed to a portion explained by differences among the groups and differences among individual observations within each group. The inference comes from recognizing that if the among group effect is greater than the within group effect, then there will be a difference due to the treatment levels.
Mean squares
To decide whether the variation associated with the among group differences are greater than the within group variation, we calculate ratios of the sums of squares. These are called Mean Squares or MS for short. The ratio of the Mean Squares is called F, the test statistic for ANOVA.
For the one-way ANOVA we will have two Mean Squares and one F, tested with degrees of freedom for both the numerator  , and denominator
 ).
The Mean Square for (among) groups is

The Mean Square for error is

And finally, the value for F, the test statistic for ANOVA, is
Worked example with R
A factor with three levels, A, B, and C
group <- c("A", "A", "A", "B", "B", "B", "C", "C", "C")
and their responses, simulated
response <- c(10.8, 11.8, 12.8, 6.5, 7, 8, 3.8, 2.8, 3)
We create a data frame
all <- data.frame(group, response)
Of course, you could place the data into a worksheet and then import the worksheet into R. Regardless, we now have our dataset.
Now, call the ANOVA function, aov, and assign the results to an object (eg, Model.1)
Model.1 <- aov(response ~ group, data=all)
Now, visualize the ANOVA table
summary(Model.1)
and the output from R, the ANOVA table, is shown below
Note 4: Rcmdr: Statistics → Means → One-way ANOVA… see figures 2 and 3 below
Table 2. Output from aov() command, the ANOVA table, for the “Difference” outcome variable.
           Df   Sum Sq    Mean Sq   F value       Pr(>F)
group       2   111.16      55.58     89.49    0.0000341 ***
Residuals   6     3.73       0.62
---
Signif. codes: 0 '***' 0.001 '**' 0.01 '*' 0.05 '.' 0.1 ' ' 1
Let’s take the ANOVA table one row at a time
- The first row has subject headers defining the columns.
- The second row of the table “groups” contains statistics due to group, and provides the comparisons among groups.
- The third row, “Residuals” is the error, or the differences within groups.
Moving across the columns, then, for each row, we have in turn,
- the degrees of freedom (there were 3 groups, therefore 2 DF for group),
- the Sums of Squares, the Mean Squares,
- the value of F, and finally,
- the P-value.
R provides a helpful guide on the last line of the ANOVA summary table, the “Signif[icance] codes,” which highlights the magnitude of the P-value.
Note 5: On the use of “error” and “residuals.” Error refers to the difference between an observed value and the true population value. Residual is the difference between an observed value and a value predicted by a model. In ANOVA, the “error variance” or “residual variance” is the variation within groups unexplained by the tested factor. It is what remains after the effects of the model are accounted for.
What to report? ANOVA problems can be much more complicated than the simple one-way ANOVA introduced here. For complex ANOVA problems, report the ANOVA table itself! But for the one-way ANOVA it would be sufficient to report the test statistic, the degrees of freedom, and the p-value, as we have in previous chapters (eg, t-test, chi-square, etc.). Thus, we would report:
F = 89.49, df = 2 and 6, p = 0.0000341
where F = 89.49 is the test statistic, df = 2 (degrees of freedom for the among group mean square) and 6 (degrees of freedom for the within group mean square), and p = 0.0000341 is the p-value.
In Rcmdr, the appropriate command for the one-way ANOVA is simply
Rcmdr: Statistics → Means
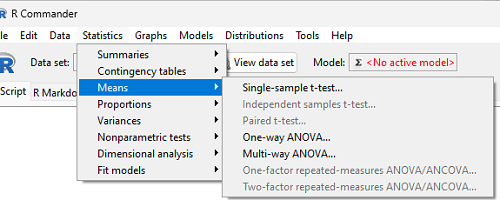
Figure 2. Screenshot Rcmdr select one-way ANOVA.
which brings up a simple dialog. R Commander anticipates factor (Groups) and Response variable. Optional, choose Pairwise comparisons of means for post-hoc test (Tukey’s) and, if you do not want to assume equal variances (see Chapter 13), select Welch F-test.
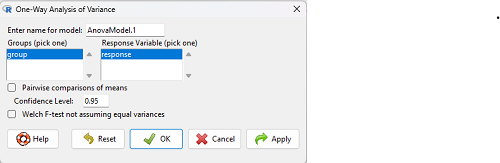
Figure 3. Screenshot Rcmdr select one-way ANOVA options.
Questions
1. Review the example ANOVA Table and confirm the following
- How many levels of the treatment were there?
- How many sampling units were there?
- Confirm the calculation of
 and using the formulas contained in the text.
- Confirm the calculation of F using the formula contained in the text.
- The degrees of freedom for the F statistic in this example were 2 and 6 (F2,6). Assuming a two-tailed test with Type I error rate of 5%, What is the critical value of the F distribution (see Appendix 20.4)
2. Repeat the one-way ANOVA using the simulated data, but this time, calculate the ANOVA problem for the “No.difference” response variable.
3. Leaf lengths from three strains of Arabidopsis thaliana plants grown in common garden are shown in Fig 2. Data are provided for you in the following R script.
arabid <- c("wt","wt","wt","AS1","AS1","AS1","AS2","AS2","AS2")
leaf <- c(4.909,5.736,5.108,6.956,5.809,6.888,4.768,4.209,4.065)
leaves <- data.frame(arabid,leaf)
- Write out a null and alternative hypotheses
- Conduct a test of the null hypothesis by one-way ANOVA
- Report the value of the test statistic, the degrees of freedom, and the P-value
- Do you accept or reject the null hypothesis? Explain your choice.
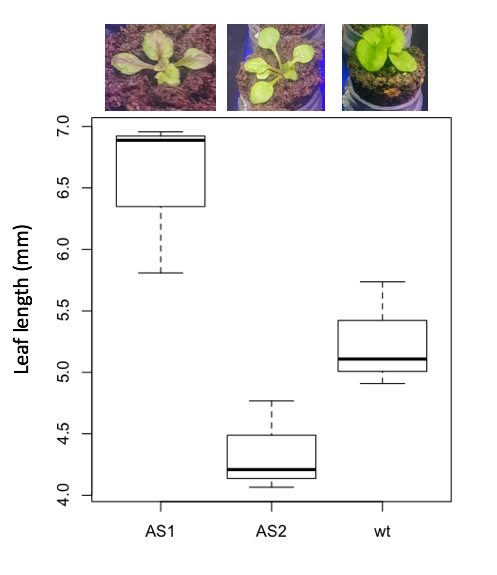
Figure 4. Box plot of lengths of leaves of a 10-day old plant from on of three strains of Arabidopsis thaliana.
4. Return to your answer to question 7 from Chapter 12.1 and review your answer and modify as appropriate to correct your language to that presented here about factors and levels.
5. Conduct the one-way ANOVA test on the Comet assay data presented question 7 from Chapter 12.1. Data are copied for your convenience to end of this page. Obtain the ANOVA table and report the value of the test statistics, degrees of freedom, and p-value.
a. Based on the ANOVA results, do you accept or reject the null hypothesis? Explain your choice.
Quiz Chapter 12.2
One-way ANOVA
Data used in this page
Difference, no difference
Table 12.2 Difference or No Difference
| Group | No.difference | Difference |
|---|---|---|
| A | 12.04822 | 11.336161 |
| A | 12.67584 | 13.476142 |
| A | 12.99568 | 12.96121 |
| A | 12.01745 | 11.746712 |
| A | 12.34854 | 11.275492 |
| B | 12.17643 | 7.167262 |
| B | 12.77201 | 5.136788 |
| B | 12.07137 | 6.820242 |
| B | 12.94258 | 5.318743 |
| B | 12.0767 | 7.153992 |
| C | 12.58212 | 3.344218 |
| C | 12.69263 | 3.792337 |
| C | 12.60226 | 2.444438 |
| C | 12.02534 | 2.576014 |
| C | 12.6042 | 4.575672 |
Comet assay, antioxidant properties of tea
Data presented in Chapter 12.1
Chapter 12 contents
11.1 – What is Statistical Power?
Introduction
Simply put, the power of a statistical test asks the question: do we have enough data to warrant a scientific conclusion, not just a statistical inference. From the NHST approach to statistics, we define two conditions in our analyses, a null hypothesis, HO, and the alternative hypothesis, HA. By now you should have a working definition of HO and HA (Chapter 8.1). For the two-sided case (Chapter 8.4), HO would be no statistical difference between two sample means, whereas for HA, there was a difference between two sample means. Similarly, for one-sided cases, HO would be one sample mean greater (less) than or equal to the second sample mean, whereas for HA, one sample mean is less (greater) than the second mean. Together, these two hypotheses cover all possible outcomes of our experiment!
However, when conducting an experiment to test the null hypothesis four, not two outcomes are possible with respect to “truth” (Table 1), which we introduced first in our Risk analysis chapter and again when we introduced statistical inference.
Table 1. Possible outcomes of an experiment
| In the population, Ho was really… | |||
| True | False | ||
| Inference: | Fail to reject Ho | Correct decision
p = 1 – α |
Type II error
p = β |
| Reject Ho | Type I error
p = α |
Correct decision
p = 1 – β |
|
We introduced false positives and false negatives in our discussion of risk analysis, and now generalize these concepts to outcomes of any experiment.
(1) We do not reject the null hypothesis, we state that we are 95% (P = 1 – α) confident that we’ve made the correct decision, and in fact, that is the true situation (“correct decision”). As before this is a true positive.
For example, mean acetylsalicylic acid concentration in a sample of 200 mg, brand-name aspirin tablets really is the same as generic aspirin.
(2) We reject the null hypothesis, we state there is a 5% chance that we could be wrong (P = 1 – β), and in fact, that is the true situation (“correct decision”). As before this is a true negative.
For example, ephedrine really does raise heart rates in people who have taken the stimulant compared to those who have taken a placebo.
Two additional possible outcomes to an experiment
The other two possible outcomes are not desirable but may occur because we are making inferences about populations from limited information (we conduct tests on samples) and because of random chance influencing our measure.
(3) We do not reject the null hypothesis, but in fact, there was a true difference between the two groups and we have therefore committed a Type II error. As before this is a false negative.
(4) We reject the null hypothesis, but in fact, there was no actual difference between the two groups and we have therefore committed a Type I error. As before this is a false positive.
What can we do about these two possible undesirable outcomes?
We set our Type I error rate α, and, therefore our Type II error rate β before we conduct any tests, and these error rates cover the possibility that we may incorrectly conclude that the null hypothesis is false (α), or we may incorrectly conclude that the null hypothesis is true (β). When might these events happen?
The power of a statistical test is the probability that the test will reject the null hypothesis when the alternative hypothesis is true.
A type I error is committed, by chance alone, when our sample is accidentally obtained from the tail of the distribution, thus our sample appears to be different from the population… Below, we have a possible case that, by chance alone, we could be getting all of our subjects from one end of the distribution (Fig 1).
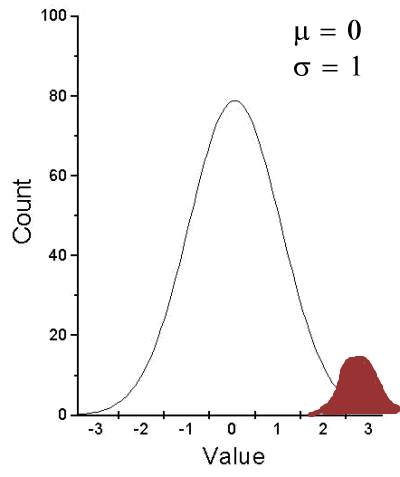
Figure 1. Population sampling from tail of distribution.
We would likely conclude that our sample mean is different (greater) than the population mean.
A type II error is committed, by chance alone, when our sample is between two different population distributions. The implication for our study is drawn in Figure 2. Instead of our sampling drawn from one population, we may have drawn between two very different populations.
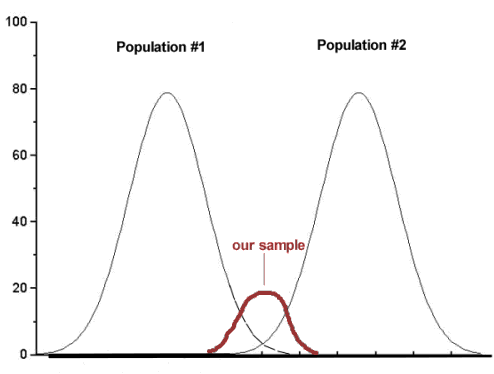
Figure 2. Without us knowing, our sample may come from the extremes of two separate populations.
How did we end up with “the wrong” sample? Recall from our first discussions about Experimental Design how we distinguished between random and haphazard sampling. The key concept was that a program of recruitment of subjects (eg, how to get a sample) must be conducted in such a way that each member of the population has an equal chance of being included in the study. Only then can we be sure that extrinsic factors (things that influence our outcome but are not under our control nor do we study them) are spread over all groups, thus canceling out.
Why do we say we are 95% confident in our estimate (or conclusions)?
(1) Because we can never be 100% certain that by chance alone we haven’t gotten a biased sample (all it takes is a few subjects in some cases to “throw off” our results).
(2) For parametric tests, at least, we assume that we are sampling from a normal population.
Thus, in statistics, we need an additional concept. Not only do we need to know the probability of when we will be wrong (α, β), but we also want to know the probability of when we will be correct when we use a particular statistical test. This latter concept is defined as the power of a test as the probability of correctly rejecting Ho when it is false. Conducting a power analysis before starting the experiment can help answer basic experimental design questions like, how many subjects (experimental units) should my project include? What approximate differences, if any might I expect among the subjects? (Eng 2003; Cohen 1992)
Put another way, power is the likelihood of identifying a significant (important) effect (difference) when one exists. Formally, statistical power is defined as the probability, p = 1 – β, and it is the subject of this chapter.
Questions
- Be able to define and distinguish statistical power and statistical inference.
Quiz Chapter 11.1
What is statistical power
Chapter 11 contents
10.2 – Digging deeper into t-test Plus the Welch test
Introduction
We need to spend some more time with the independent sample t-test; by tearing it apart, we can learn about how parametric tests work in general.
Our assumptions for the independent sample t-test are like the one-sample t-test the data must be continuous and normally distributed (one of our standard assumptions for parametric tests, see Chapter 13). The formula is very similar to the one-sample t-test, except that now we have two sample means and the formula for the standard error (SE) has also changed.

We see that the test statistic t is large if the numerator is large compared to the denominator. Large values of t will be evidence in favor of rejecting the null hypothesis.
The numerator is straightforward: we subtract one sample mean from the other — if there is no difference between the samples, then this difference will be close to zero.
The denominator requires additional discussion. What is it called? It is the pooled standard error of the mean (pooled SEM). Provided the assumption of equal variances holds — an additional standard assumptions for parametric tests, see Chapter 13 — then sample variances estimate the population variance and we can use this information to our advantage to best test the hypothesis about the sample means. In other words, we don’t have to lose a degree of freedom to account for differences in variability for the two groups (see Welch test). More degrees of freedom means more statistical power to test the null hypothesis and at the same time, more confidence that the test is performing to its best.
Lets break down the pooled standard error of the mean in order to see how the assumption of equal variances affects the t-test. We assume that 
Recall that

Now we want a “pooled SE” that is the pooled standard error for both samples. The variance of the difference between the means can be written as
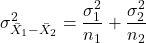
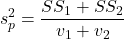
First we need to calculate the pooled variance. where v1 and v2 are degrees of freedom for sample one and sample two, respectively.
Note 1This is just simply a combined formula of the sample variance.
What is SS? The sum of squares , where SS1 and SS2 refer to sum of squares for each of the two groups.
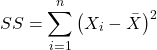
You should recognize SS from your definition of the sample variance, Chapter 3.3.
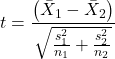
And the standard error for the difference between two means can now be written as So the 2-sample t-test can be written to reflect the pooled sample standard error of the difference between two sample means. We can see how unequal sample size is accommodated by the t-test.
Conducting the test by hand follows the same form as the one-sample t-test. Find the degrees of freedom (DF), but now for each sample.
Finally we evaluate with the critical value in Table (Appendix, Table of Student’s t distribution) and compare the t test statistic against the critical value with the appropriate degrees of freedom.
Because this is the t-test, again, we are assuming that the variances are the same between the two populations (homoscedasticity) and this allows us to pool the variance. As it turns out, the T-test is not overly sensitive to other deviations from the assumptions, but if the variances are in fact different, then the standard formula may yield incorrect Type I error rates compared to stated probability level (α).
However, it would be poor statistical choice to use a test where there are alternatives. This is why in part that R (Rcmdr) sets as the default for the t-test that variances are unequal! In fact, R does not do a t-test unless you change the default to assume equal variances, which, as we now know, is the t-test.
Welch test
What to do when assumptions to t-test are not met? Many options have been proposed, and Welch’s approximate t is a good alternative to the two-sample t-test — it would be appropriate if the normal assumption still held.
The degrees of freedom for the Welch’s test are now
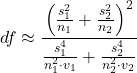
Note 2: The Welch test removes the pooled estimate of the standard error, replaces with both variance estimates directly.
As a default option, R and Rcmdr uses a variation of Welch’s test when you select to do the t-test without making the assumption of equal variance (Fig 1).
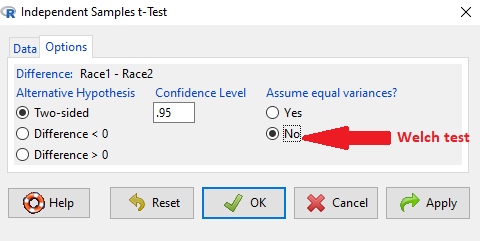
Figure 1. Screenshot Rcmdr t-test options. Default is “No” for Assume equal variances, ie, the Welch test.
The Welch test is not a nonparametric test, it is a different formulation of the t-test.
Justification for beginning with t-test
It’s unlikely that you will need the t-test in today’s research climate. Data sets are large, experiments are complex with multiple variables and samples. Why do we have to consider the t-test, and then a separate test in the case for unequal sample size? I view it as a teaching moment. It makes the general point that ALL statistical tests make assumptions about how the calculations are done and as to the nature of the data set.
This is our first experience with what to do if there is a violation of an assumption of parametric tests (see Chapter 13). Here, the assumption is that the two groups have equal sample size. When they do not, the standard t-test tends to biased estimates. On the other hand, if the assumptions are met, the standard test is the best test because it has more power to do what we intended — that is, it is best at the actual test of the null hypothesis! Take heart — this point is not always appreciated even by scientists (cf. Fagerland 2012).
Note 3: Expert advice will differ here, but you can always calculate the test statistic, even if the assumptions do not hold. The problem, the concern is with the interpretation.
Let’s us approach the problem of violation of assumptions in a couple of ways as an introduction to how, in general, to approach choice of statistical tests.
- Power of a test. Much current statistical research focuses on learning about how a particular statistical test works when assumptions are violated. Thus, in addition to learning what tests are designed to do, we need to consider the effects of violations of assumptions on the performance of the test (namely, is the Type I error at the stated alpha level?). This is a matter of statistical power; power of a test reflects how able the test is to get you the correct result even if assumptions are violated. Often tests perform well if sample sizes are large despite violation of assumptions. We mention without proving that the 2-sample T-test is robust to violations of normality assumption, to requirement for equal sample size, and even to unequal variances. But good experimental design attempts to meet the assumptions because the test does better!
- Alternate forms of some tests are available to handle some aspects of test violations. For example, the simple 2-sample T-test can be modified to accommodate different variances (Welch’s formula). Or you must find a different test (eg, nonparametric tests).
In conclusion, all tests begin with consideration of the assumptions. In some cases we can test our assumptions. For example, we learned about testing the assumption of normal distributions of sample data. We can also test the assumption of equal variances.
Questions
- Consider a clinical trial in which resting blood pressure is recorded on hypertensive subjects at the start of the trial, then 6 weeks after subjects have received daily supplements of flaxseed. Thus, for each subject there are two measures of blood pressure, BEFORE and AFTER.
- Write the null hypothesis
- Write the alternative hypothesis
- Justify why or why not the hypothesis should be two tailed. Explain why or why not an independent sample t-test may be used to compare groups.
Quiz Chapter 10.2
Digging deeper into t-test Plus the Welch test
Chapter 10 contents
- Introduction
- Compare two independent sample means
- Digging deeper into t-test Plus the Welch test
- Paired t-test
- References and suggested reading
9.2 – Chi-square contingency tables
 from a, b, c, and d 2X2 table format formula
 effect size
Introduction
This page covers a lot of ground to extend our discussion of implementations of the chi-square test to experimental data and introduces several related statistics, including a correlation coefficient for categorical data and an introduction to agreement and reliability measurement statistics.
We begin with contingency tables.
We just completed a discussion about goodness of fit tests, inferences on categorical traits for which a theoretical distribution or expectation is available. We offered Mendelian ratios as an example in which theory provides clear-cut expectations for the distribution of phenotypes in the F2 offspring generation. This is an extrinsic model — theory external to the study guides in the calculation of expected values — and it reflects a common analytical task in epidemiology.
But for many other kinds of categorical outcomes, no theory is available. Today, most of us accept the link between tobacco cigarette smoking and lung cancer. The evidence for this link was reported in many studies, some better designed than others.
Consider the famous Doll and Hill (1950) report on smoking and lung cancer. They reported (Table IV Doll and Hill 1950), for men with lung cancer, only two out of 649 were non-smokers. In comparison, 27 case-control patients (ie, patients in the hospital but with other ailments, not lung cancer) were nonsmokers, but 622 were smokers (Table 1).
Table 1. Doll and Hill (1950).
| Smokers | Non-smokers | |
| Lung cancer | 647 | 2 |
| Case controls, no lung cancer | 622 | 27 |
A more recent example from the study of the efficacy of St John’s Wort (Hypericum perforatum) as a treatment for major depression (Shelton et al 2001, Apaydin et al. 2016). Of patients who received St. John’s Wort over 8 weeks, 14 were deemed improved while 98 did not improve. In contrast 5 patients who received the placebo were deemed improved while 102 did not improve (Table 2).
Table 2. St. John’s Wort and depression
| Improved | Not improved | |
| St. John’s Wort | 14 | 98 |
| Placebo | 5 | 102 |
Note 1: The St. John’s Wort problem is precisely a the time to remind any reader of Mike’s Biostatistics Book: under no circumstances is medical advice implied from my presentation. From the National Center for Complementary and Integrative Medicine: “It has been clearly shown that St. John’s wort can interact in dangerous, sometimes life-threatening ways with a variety of medicines.”
These kinds of problems are direct extensions of our risk analysis work in Chapter 7. Now, instead of simply describing the differences between case and control groups by Relative Risk Reduction or odds ratios, we instruct how to do inference on the risk analysis problems.
Thus, faced with absence of coherent theory as guide, the data themselves can be used (intrinsic model), and at least for now, we can employ the test.
Note 2: The preferred analysis is to use a logistic regression approach, Chapter 18.3, because additional covariates can be included in the model.
In this lesson we will learn how to extend the analyses of categorical data to cases where we do not have a prior expectation — we use the data to generate the tests of hypotheses. This would be an intrinsic model. One of the most common two-variable categorical analysis involves 2X2 contingency tables. We may have one variable that is the treatment variable and the second variable is the outcome variable. Some examples provided in Table 3.
Table 3. Some examples of treatment and outcome variables suitable for contingency table analysis.
| Treatment Variable and Levels | Outcome Variable(s) | Reference |
| Lead exposure
Levels: Low, Medium, High |
Intelligence and development | Bellinger et al 1987 |
| Wood preservatives
Levels: Borates vs. Chromated Copper Arsenate |
Effectiveness as fungicide | Hrastnik et al 2013 |
| Antidepressants
Levels: St. John’s Wort, conventional antidepressants, placebo |
Depression relief | Linde et al 2008 |
| Coral reefs
Levels: Protected vs Unprotected |
Fish community structure | Guidetti 2006 |
| Aspirin therapy
Levels: low dose vs none |
Cancer incidence in women | Cook et al 2013 |
| Aspirin therapy
Levels: low dose vs none |
Cancer mortality in women | Cook et al 2013 |
Table 4 were examples of published studies returned from a quick PubMed search; there are many examples (meta-analysis opportunities!). However, while they all can be analyzed by contingency tables analysis, they are not exactly the same. In some cases, the treatments are fixed effects, where the researcher selects the levels of the treatments (see Ch12.3 and Ch14.3 for discussion about fixed vs random effects in experimental design).
In other cases, each of these treatment variables need not be actual treatments (in the sense that an experiment was conducted), but it may be easier to think about these as types of experiments. These types of experiments can be distinguished by how the sampling from the reference population were conducted. Before we move on to our main purpose, to discuss how to calculate contingency tables, I wanted to provide some experimental design context by introducing two kinds of sampling (Chapter 5.5).
Our first kind of sampling scheme is called unrestricted sampling. In unrestricted sampling, you collect as many subjects (observations) as possible, then assign subjects to groups. A common approach would be to sample with a grand total in mind; for example, your grant is limited and so you only have enough money to make 1000 copies of your survey and you therefore approach 1000 people. If you categorize the subjects into just two categories (eg, Liberal, Conservative), then you have a binomial sample. If instead you classify the subjects a number of variables, eg, Liberal or Conservative, Education levels, income levels, homeowners or renters, etc., then this approach is called multinomial sampling. The point in either case is that you have just utilized a multinomial sampling approach. The aim is to classify your subjects to their appropriate groups after you have collected the sample.
Logically what must follow unrestricted sampling would be restricted sampling. Sampling would be conducted with one set of “marginal totals” fixed. Margins refers to either the row totals or to the column totals. The sampling scheme is referred to as compound multinomial. The important distinction from the other two types is that the number of individuals in one of the categories is fixed ahead of time. For example, in order to determine if smoking influences respiratory health, you approach as many people as possible to obtain 100 smokers.
The contingency table analysis
We introduced the 2×2 contingency table (Table 4) in Chapter 7.
Table 4. 2X2 contingency table
| Outcome |
|||
| Exposure or Treatment group | Yes | No | Marginal total |
| Exposure (Treatment) | a | b | Row1 = a + b |
| Nonexposure (Control) | c | d | Row2 = c + d |
| Marginal total | Column1 = a + c |
Column2 = a + c |
N |
Contingency tables are all of the form (Table 5)
Table 5. Basic format of a 2X2 table
| Outcome 1 | Outcome 2 | |
| Treatment 1 | Yes | No |
| Treatment 2 | Yes | No |
Regardless of how the sampling occurred, the analysis of the contingency table is the same; mechanically, we have a chi-square type of problem. In both contingency table and the “goodness of fit” Chi-Square analyses the data types are discrete categories. The difference between GOF and contingency table problems is that we have no theory or external model to tell us about what to expect. Thus, we calculate expected values and the degrees of freedom differently in contingency table problems. To learn about how to perform contingency tables we will work through an example, first the long way, and then using a formula and the a, b, c, and d 2X2 table format. Of course, R can easily do contingency tables calculations for us.
Doctors noticed that a new form of Hepatitis (HG, now referred to as GB virus C), was common in some HIV+ populations (Xiang et al 2001). Accompanying the co-infection, doctors also observed an inverse relationship between HG loads and HIV viral loads: patients with high HG titers often had low HIV levels. Thus, the question was whether co-infection alters the outcome of patients with HIV — do HIV patients co-infected with this HG progress to AIDS and mortality at rates different from non-infected HIV patients? I’ve represented the Xiang et al (2001) data in Table 6.
Table 6. Progression of AIDS for patients co-infected with HG [GB virus C], Xiang et al data (2001)
| Lived | Died | Row totals | |
| HG+ | 103 | 41 | 144 |
| HG- | 95 | 123 | 218 |
| Column totals | 198 | 164 | 362 |
Note 3: HG virus is no longer called a hepatitis virus, but instead is referred to as GB virus C, which, like hepatitis viruses, is in the Flaviviridae virus family. For more about the GB virus C, see review article by Bhattarai and Stapleton (2012).
Our question was: Do HIV patients co-infected with this HG progress to AIDS and mortality at rates different from non-infected HIV patients? A typical approach to analyze such data sets is to view the data as discrete categories and analyze with a contingency table. So we proceed.
Setup the table for analysis
Rules of contingency tables (see Kroonenberg and Verbeek 2018). What follows is a detailed walk through setting up and interpreting a 2X2 table. Note that I maintain our a, b, c, d cell order, with row 1 referencing subjects exposed or part of treatment group and row 2 referencing subjects not exposed (or part of the control group), as introduced in Chapter 7.
The Hepatitis G data from Xiang et al 2001 data, arranged in 2X2 format (Table 7).
Table 7. Format of 2X2 table Xiang et al (2001) dataset.
| Lived | Died | Row totals | |
| HG+ | a | b | a + b |
| HG- | c | d | c + d |
| Column totals | a + c | b + d | N |
The data are placed into the cells labeled a, b, c, and d.
Cell a : The number of HIV+ individuals infected with HG that lived beyond the end of the study.
Cell b : The number of HIV+ individuals infected with HG that died during the study.
Cell c : The number of HIV+ individuals not infected with HG that lived.
Cell d : The number of HIV+ individuals not infected with HG that died.
This is a contingency table because the probability of living or dying for these patients may have been contingent on coinfection with hepatitis G.
State the examined hypotheses
HO: There is NO association between the probability of living and coinfection with hepatitis G.
For a contingency table this means that there should be the same proportion of individuals with and without hepatitis G that either lived or died (1:1:1:1).
Now, compute the Expected Values in the Four cells (a, b, c, d)
- Calculate the Expected Proportion of Individuals that lived in Entire Sample:
Column 1 Total / Total = Expected Proportion of those that lived beyond the study. - Calculate Expected Proportion of Individuals that died in Entire Sample:
Column 2 Total / Total = Expected Proportion that died during the study. - Calculate the Expected Proportion of Individuals that lived and were HG+
Expected Proportion of living (step 1 above) x Row 1 Total = Expected For Cell A. - Calculate the Expected Proportion of Individuals that died and were HG+
Expected Proportion died x Row 1 Total = Expected For Cell B - Calculate the Expected Proportion of surviving individuals that were HG-
Expected Proportion lived x Row 2 Total = Expected For Cell C - Calculate the Expected Proportion of individuals that died that were HG-
Expected Proportion that died x Row 2 Total = Expected For Cell D
Yes, this can get a bit repetitive! But, we are now done — remember, we’re working through this to review how the intrinsic model is applied to obtain expected values.
To summarize what we’ve done so far, we now have
Observations arranged in a 2X2 table
Calculated the expected proportions, ie, the Expected values under the Null Hypothesis.
Now, we proceed to conduct the chi-square test of the null hypothesis — The observed values may differ from these expected values, meaning that the Null Hypothesis is False.
Table 8. Copy Table 6 data set
| Lived | Died | Row totals | |
| HG+ | 103 | 41 | 144 |
| HG- | 95 | 123 | 218 |
| Column totals | 198 | 164 | 362 |
Get the Expected Values
- Calculate the Expected Proportion of Individuals that lived in Entire Sample:
Column 1 Total (198) / Total (362) = 0.5470 - Calculate Expected Proportion of Individuals that died in Entire Sample:
Column 2 Total (164) / Total (362) = 0.4530 - Calculate the Expected Proportion of Individuals that lived and were HG+
Expected Proportion of living (0.547) x Row 1 Total (218) = Cell A = 119.25 - Calculate the Expected Proportion of Individuals that died and were HG+
Expected Proportion died (0.453) x Row 1 Total (218) = Cell B = 98.75. - Calculate the Expected Proportion of surviving individuals that were HG-
Expected Proportion lived (0.547) x Row 2 Total (144) = Cell C = 78.768 - Calculate the Expected Proportion of individuals that died that were HG-
Expected Proportion that died 0(.453) X Row 2 Total = Cell D = 65.232
Thus, we have (Table 9)
Table 9. Expected values for Xiang et al (2001) data set (Table 6 and Table 8)
| Lived | Died | Row totals | |
| HG+ | 78.768 | 65.232 | 144 |
| HG- | 119.25 | 98.75 | 218 |
| Column totals | 198 | 164 | 362 |
Now we are ready to calculate the Chi-Square Value
Recall the formula for the chi-square test
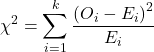
Table 10. Worked contingency table for Xiang et al (2001) data set (Table 6 and Table 8)
| Cell |  |
|
| a | (103 – 87.768)2 = 78.768 | 7.4547 |
| b | (41 – 65.232)2 = 65.232 | 9.002 |
| c | (95 – 119.25)2 = 119.25 | 4.93134 |
| d | (123 – 98.75)2 = 98.75 | 5.95506 |
 |
27.3452 |
Adding all the parts we have the chi-square test statistic  . To proceed with the inference, we test using the chi-square distribution.
Determine the Critical Value of  test and evaluate the null hypothesis
Now recall that we can get the critical value of this test in one of two (related!) ways. One, we could run this through our statistical software and get the p-value, the probability of our result and the null hypothesis is true. Second, we look up the critical value from an appropriate statistical table. Here, we present option 2.
We need the Type I error rate α and calculate the degrees of freedom for the problem. By convention, we set α = 0.05. Degrees of freedom for contingency table is calculated as
Degrees of Freedom = (# rows – 1) x (# columns – 1)
and for our example → DF = (2 – 1) x (2 – 1) = 1.
Note. How did we get the 1 degree of freedom? Aren’t there 4 categories and shouldn’t we therefore have k – 1 = 3 df? We do have four categories, yes, but the categories are not independent. We need to take this into account when we evaluate the test and this lack of independence is accounted for by the loss of degrees of freedom.
What exactly is not independent about our study?
-
- The total number of observations is set in advance from the data collection.
- We also have the column and row totals set in advance. The number of HIV individuals with or without Hepatitis G infection was determined at the beginning of the experiment. The number of individuals that lived or died was also determined before we we conducted the test.
- Then the first cell (let us make that cell A) can still vary anywhere from 0 to N i (sample size of the first drug).
- Once the first cell (A) is determined then the next cell in that row (B) will have to add up to N i.
- Also the other cell in the same column as the first cell (C) must add up to the Column 1 Total.
- Lastly, the last cell (D) must have the Row 1 Total add up to the correct number.
All this translates into there being only one cell that is FREE TO VARY, hence, only one degree of freedom.
Get the Critical Value from a chi-square distribution table: For our example, look up the critical value for DF = 1, α = 0.05, you should get 3.841. The 3.841 is the value of the chi-square we would expect at 5% and the null hypothesis is in fact true condition in the population.
Once we obtain the critical value we simply use the previous statement regarding the probability of the Null Hypothesis being TRUE. We Reject the Null Hypothesis when the calculated test statistic is greater than the Critical Value. We Accept the Null Hypothesis when the calculated is less than the Critical Value. In our example we got 27.3452 for our calculated test statistic, thus we reject the null hypothesis and conclude, that, at least for the sample in this study, there was an association between the probability of patients living past the study period and the presence of hepatitis G.
from a, b, c, and d 2X2 table format formula
If a hand calculation is required, a simpler formula to use is
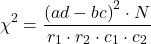
where N is the sum of all observations in the table, r1 and r2 are the marginal row totals, and c1 and c2 are the marginal column totals from the 2×2 contingency table (eg, Table 4). If you are tempted to try this in a spreadsheet, and assuming your entries for a, b, c, d, and N look like Table 11, then a straightforward interpretation requires referencing five spreadsheet cells no less than 13 times! Not to mention a separate call to the distribution to calculate the p-value (one tailed test).
Note 4: This formulation was provided as equation 1 in Yates 1984 (referred to in Serra 2018), but is likely found in the earlier papers on dating back to Pearson.
Table 11. Example spreadsheet with formulas for odds ratio (OR), Pearson’s , and p-value from distribution.
| A | B | C | D | E | F | G | |
| 1 | |||||||
| 2 | a | 103 | OR | =( 2*5)/(3*4) |
|||
| 3 | b | 41 | |||||
| 4 | c | 95 | |||||
| 5 | d | 123 | chisq, p | =(((2*5-3*4)^2)*6)/ (SUM( 2:3)*SUM(4:5)*SUM( 2,4)*SUM(3,5)) |
=CHIDIST(F5,1) | ||
| 6 | N | 632 |
Now, let’s see how easy this is to do in R.
effect size
Inference on hypotheses about association, there’s statistical significance — evaluate p-value compared to Type I error, eg, 5% — and then there’s biological importance, the strength of the association. The concept of effect size is an attempt to communicate the likely importance of a result. Several statistics are available to communicate effect size: for that’s φ, phi for the φ (phi) coefficient.

where N is the total. Phi for our example is
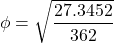
R code
sqrt(27.3452/362)
and R returns
[1] 0.274844
Effect size statistics typically range from 0 to 1; Cohen (1992) suggested the following interpretation
Table 12. Cohen’s interpretation of d values.
| Effect size | Interpretation |
| < 0.2 | Small, weak effect |
| 0.5 | Moderate effect |
| > 0.8 | Large effect |
For our example,  effect size of the association between co-infection with GB virus C and mortality was weak in the patients with HIV infection. The function
phi() in psych package will calculate phi coefficient from a 2X2 table.
Agreement, kappa, and inter-rater reliability
I imagine by now you have made the leap — can we use the contingency table to assess agreement between (inter-) two judges (raters) who evaluate the same object? A naive approach would be to calculate simple agreement, the percent of objects in the list of items evaluated for which both judges agree (concur). For a binomial Yes or No, then agreement (concordance) occurs when both judges report “Yes,” or both report “No,” displayed on the main diagonal of the 2X2 table. The other possible combinations (Yes vs No and No vs Yes) are disagreement (discordance) and would be displayed on the off-diagonal of the 2X2 matrix.
Unfortunately, simple agreement, while intuitive, cannot discriminate between true agreement and agreement by chance. Cohen’s kappa (Cohen 1960, McHugh 2012) is used to assess agreement, aka inter-rater reliability, for binomial and nominal data types for two judges (raters). Cohen’s 1960 paper has been enormously impactful, with more than 53K citations (Google Scholar, Fall 2024), and spawned a number of additional measures of agreement, eg, weighted kappa for more than binomial levels, Fleiss kappa for three or more raters, ICC for ratio scale, discussed in Ch12.3). It’s beyond the scope of this text to review the context of such terms as agreement, and reliability, for just two terms used to evaluate results from two independent observers of the “same” event or object, and leave that to the reader to confirm how to report such endeavors.
Off we go. Cohen’s kappa is defined as

where po is the proportion in agreement and pc is proportion of agreement expected by chance. Essentially, then, interpretable kappa values fall between 0 and 1 (0% to 100%); negative kappa estimates are possible. Cohen (1960) noted that for kappa to equal 1, the off diagonal elements would all have to be zero.
Cohen provided an estimate of the standard error for kappa as
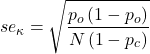
and 95% confidence intervals are then  .
Here, we review calculation of simple agreement and Cohen’s kappa, with just the two levels. Both simple agreement and Cohen’s kappa (κ), are available in R via the icc package. Cohen’s kappa is also available in the psych package, with the cohen.kappa() function providing a confidence interval estimate directly.
Note 5: Base R includes the function kappa(), but that returns an estimate for the condition number of the matrix, or how close to singular the matrix solution may be, ie, determinant is zero and its inverse is unavailable.
Use of both is illustrated here with a simulated coin toss example modified from a nice 2018 summary of Cohen’s kappa at r-bloggers. The R code
library(irr)
# simulate some data
N = 24
flips1 <- rbinom(n = N, size = 1, prob = 0.5)
flips2 <- rbinom(n = N, size = 1, prob = 0.5)
coins<-cbind(flips1, flips2)
Confirm the data set.
head(coins)
flips1 flips2
[1,] 0 1
[2,] 1 0
[3,] 1 0
[4,] 1 1
[5,] 0 0
[6,] 1 0
and create a 2X2 table.
I stacked the data
head(StackedCoin)
Side Coins    HT
1 0 flips1 tails
2 1 flips1 heads
3 1 flips1 heads
4 1 flips1 heads
5 0 flips1 tails
6 1 flips1 heads
then created a simple 2×2 table (see Note 6 below for a simple explanation for why “.Table” as a named object).
.Table <- xtabs(~Coins+HT, data=StackedCoin)
Table 13. coins as 2X2 table.
| tails | heads | |
| flips1 | 10 | 14 |
| flips2 | 14 | 10 |
We can calculate the phi coefficient for Table 13.
phi(.Table, digits = 3)
[1] -0.167
and would conclude no correlation between the two sets of coin tosses.
Now, agreement statistics. Both agree() and kappa2() expect an unstacked (wide) data format. It’s not necessary, but we’ll call a value of 1 as “heads up” and a value of 0 as “tails up” of the tossed coin.
Next, simple agreement.
agree(coins, tolerance=0)
R returns
Subjects = 24
Raters = 2
%-agree = 41.7
Now, a proper agreement statistic.
kappa2(coins)
and R returns
Subjects = 24
Kappa = -0.135
z = -0.7
p-value = 0.484
Results with psych:cohen.kappa, which provides the 95% confidence interval as default output.
Cohen Kappa and Weighted Kappa correlation coefficients and confidence boundaries
                 lower estimate upper
unweighted kappa -0.51    -0.14  0.24
weighted kappa   -0.51    -0.14  0.24
Number of subjects = 24
By chance, the two independent toss of 24 coins had 10 rows of “agreement” (H:H or T:T), simply due to chance. However, results of kappa find no agreement between the two sets of coin tosses.
In summary, we see that simple agreement and the kappa statistic don’t return similar results. Percent agreement reported 41%, whereas kappa was zero. We know percent agreement can’t reflect anything in the coin toss case because each toss is independent from the next. We’ll have you explore repeated trials of coin tosses to help convince you that simple agreement is not a reliable measure of agreement (see question 6 below).
Interpreting agreement values is not straightforward, and some argue agreement statistics should be avoided in favor of disagreement measures (for example, see discussion in Pontius and Millones 2011). Cohen suggested (Table 14)
Table 14. Landis and Koch’s (1977) interpretation of Cohen’s kappa.
| Cohen’s kappa | Agreement? |
| < 0 | none |
| 0.01 — 0.20 | slight |
| 0.21 — 0.40 | fair |
| 0.41 — 0.60 | moderate |
| 0.61 — 0.80 | substantial |
| 0.81 — 1 | nearly perfect |
Note 6: Wikipedia page for Cohen’s kappa suggests that this interpretation began with the Landis and Koch 1997 paper in the journal Biometrics. I haven’t confirmed this — regardless, this paper is also highly influential, with more than 89K citations (Fall 2024).
Even a cursory look at Table 14 should lead to questions about scenarios in which a range of agreement “substantial” would provide little comfort about the agreement between the judges or the reliability of the instrument used, for example forensic cases or histology of tissue biopsies.
Contingency table analyses in Rcmdr
Assuming you have already summarized the data, you can enter the data directly in the Rcmdr contingency table form. If your data are not summarized, then you would use Rcmdr's Two-way table… for this. We will proceed under the assumption that you have already obtained the frequencies for each cell in the table.
Rcmdr: Statistics → Contingency tables → Enter and analyze two-way table…
Here you can tell R how many rows and how many columns (Fig 1).
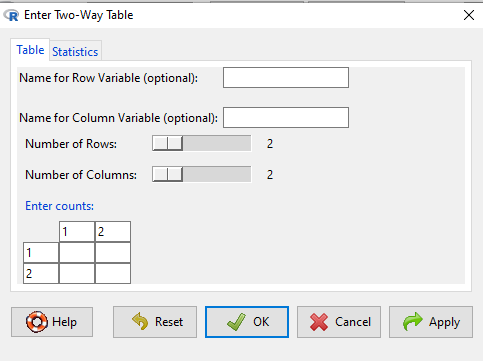
Figure 1. Screenshot R Commander menu for 2X2 data entry with counts.
The default is a 2X2 table. For larger tables, use the sliders to increase the number of rows, columns, or both.
Next, enter the counts. You can edit every cell in this table, including the headers. In the next panel, I will show you the data entry and options. The actual calculation of the test statistic is done when you select the “Chi-square test of independence” check-box (Fig 2).
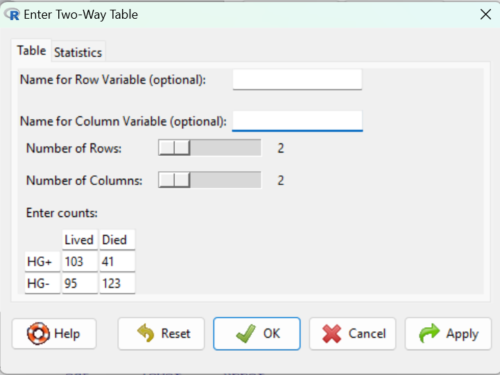
Figure 2. Display of Xiang et al data entered into R Commander menu.
After entering the data, click on the Statistics tab (Fig 3).
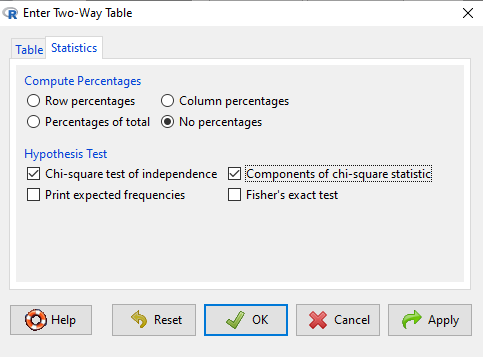
Figure 3. Screenshot Statistics options for contingency table.
If you also select “Components of chi-square statistic” option, then R will show you the contributions of each cell (O-E) towards the chi-square test statistic value. This is helpful to determine if rejection of the null is due to a subset of the categories, and it also forms the basis of the heterogeneity tests, a subject we will pick up in the next section.
Here’s the R output from R Commander. Note the “2, 2, byrow=TRUE” instructions (check out R help to confirm what
.Table <- matrix(c(103,41,95,123), 2, 2, byrow=TRUE)
dimnames(.Table) <- list("rows"=c("HG+", "HG-"), "columns"=c("Lived", "Died"))

.Table # Counts
     columns
rows Lived Died
 HG+   103   41
 HG-   95   123

.Test <- chisq.test(.Table, correct=FALSE)
.Test

Pearson's Chi-squared test

data: .Table
X-squared = 27.339, df = 1, p-value = 0.0000001708

round(.Test$residuals^2, 2) # Chi-square Components
    columns
rows Lived Died
HG+   7.46 9.00
HG-   4.93 5.95

remove(.Test)
remove(.Table)
end R output.
Note 7: R Commander often cleans up after itself by removing objects like .Test and .Table. This is not necessary for the code to work, but does make it easier for you to go back and modify the code without worrying about confusing objects.
Lots of output, take a deep breath and remember… The minimum output we need to look at is… (Table 15)?
Table 15. Minimally expected outcome for report from a statistical test.
| Value of the test statistic | 27.339 |
| Degrees of freedom | 1 |
| p-value | 0.0000001708 |
We can see that the p-value 1.7-7 is much less than Type 1 α = 0.05, thus, by our decision criterion we reject the null hypothesis (provisionally of course, as science goes).
Note 7: Simple enough to get R to report numbers as you need. For example, R code
myNumber = 0.0000001708
format(myNumber, scientific = TRUE, digits=2)
returns
[1] "1.7e-07"
Questions
- Instead of R Commander, try the contingency table problem in R directly.
myData <- matrix(c(103,41,95,123))
chisq.test(myData)
Is this the correct
contingency table analysis? Why or why not? - For many years National Football League games that ended in ties went to “sudden death,” where the winner was determined by the first score in the extra period of play, regardless of whether or not the other team got an opportunity to possess the ball on offense. Thus, in more than 100 games (140), the team that won the coin toss and therefore got the ball first in overtime, won the game following either a kicked field goal or after a touchdown was scored. In 337 other games under this system, the outcome was not determined by who got the ball first. Many complained that the “sudden death” format was unfair and in 2013 the NFL changed its overtime rules. Beginning 2014 season, both teams got a chance to possess the ball in overtime, unless the team that won the coin toss also went on to score a touchdown at which time that team would be declared the winner. In this new era of over-time rules ten teams that won the coin toss went on to score a touchdown in their first possession and therefore win the game, whereas in 54 other overtime games, the outcome was decided after both teams had a chance on offense (data as of 1 December 2015). These data may be summarized in the table
First possession win? Yes No Coin flip years 140 337 New era 10 54 A. What is the null hypothesis?
B. Which is more appropriate: to calculate an odds ratio or to calculate an RRR?
C. This is a contingency table problem. Explain why
D. Conduct the test of the null hypothesis.
E. What is the value of the test statistic? Degrees of freedom? P-value?
F. Evaluate the results of your analysis — do you accept or reject the null hypothesis? - Return to the Doll and Hill (1950) data: 2 men with lung cancer were nonsmokers, 647 men with lung cancer were cigarette smokers. In comparison, 27 case-control patients (ie, patients in the hospital but with other ailments, not lung cancer) were nonsmokers, but 622 were cigarette smokers.
A. What is the null hypothesis?
B. Which is more appropriate: to calculate an odds ratio or to calculate an RRR?
C. This is a contingency table problem. Explain why
D. Conduct the test of the null hypothesis.
E. What is the value of the test statistic? Degrees of freedom? P-value?
F. Evaluate the results of your analysis — do you accept or reject the null hypothesis? - A more recent example from the study of the efficacy of St John’s Wort as a treatment for major depression (Shelton et al 2001). Of patients who received St. John’s Wort over 8 weeks, 14 were deemed improved while 98 did not improve. In contrast 5 patients who received the placebo were deemed improved while 102 did not improve.
A. What is the null hypothesis?
B. Which is more appropriate: to calculate an odds ratio or to calculate an RRR?
C. This is a contingency table problem. Explain why
D. Conduct the test of the null hypothesis.
E. What is the value of the test statistic? Degrees of freedom? P-value?
F. Evaluate the results of your analysis — do you accept or reject the null hypothesis? - Return to the coin toss simulation and repeat comparisons between simple agreement and Cohen’s kappa for different values of N. Do you see any trend(s) for the two measures as sample size increases or decreases?
- Repeat the coin toss simulation for N = 24 up to five times, each time calculate simple agreement and Cohen’s kappa. Provide a table of your five results plus the example, and generalize simple agreement vs Cohen’s kappa as a reliable measure of agreement. Hint: you may want to use Descriptive statistics to help make your case.
Quiz Chapter 9.2
Chi-square contingency tables
Chapter 9 contents
9.1 – Chi-square test: Goodness of fit
Introduction
We ask about the “fit” of our data against predictions from theory, or from rules that set our expectations for the frequency of particular outcomes drawn from outside the experiment. Three examples to illustrate goodness of fit, GOF,  , A, B, and C follow.
A. For example, for a toss of a coin, we expect heads to show up 50% of the time. Out of 120 tosses of a fair coin, we expect 60 heads, 60 tails. Thus, our null hypothesis would be that heads would appear 50% of the time. If we observe 70 heads in an experiment of coin tossing, is this a significantly large enough discrepancy to reject the null hypothesis?
B. For example, simple Mendelian genetics makes predictions about how often we should expect particular combinations of phenotypes in the offspring when the phenotype is controlled by one gene, with 2 alleles and a particular kind of dominance.
For example, for a one locus, two allele system (one gene, two different copies like R and r) with complete dominance, we expect the phenotypic (what you see) ratio will be 3:1 (or  round,
 wrinkle). Our null hypothesis would be that pea shape will obey Mendelian ratios (3:1). Mendel’s round versus wrinkled peas (RR or Rr genotypes give round peas, only rr results in wrinkled peas).
Thus, out of 100 individuals, we would expect 75 round and 25 wrinkled. If we observe 84 round and 16 wrinkled, is this a significantly large enough discrepancy to reject the null hypothesis?
C. For yet another example, in population genetics, we can ask whether genotypic frequencies (how often a particular copy of a gene appears in a population) follow expectations from Hardy-Weinberg model (the null hypothesis would be that they do).
This is a common test one might perform on DNA or protein data from electrophoresis analysis. Hardy-Weinberg is a simple quadratic expansion:
If p = allele frequency of the first copy, and q = allele frequency of the second copy, then p + q = 1,
Given the allele frequencies, then genotypic frequencies would be given by 1 = p2 + 2pq + q2.
Deviations from Hardy-Weinberg expectations may indicate a number of possible causes of allele change (including natural selection, genetic drift, migration).
Thus, if a gene has two alleles,  and
 , with the frequency for ,
 and for ,
 (equivalently q = 1 – p) in the population, then we would expect 36
 , 16
 , and 48
 individuals. (Nothing changes if we represent the alleles as A and a, or some other system, eg, dominance/recessive.)
Question. If we observe the following genotypes: 45 individuals, 34 individuals, and 21 individuals, is this a significantly large enough discrepancy to reject the null hypothesis?
Table 1. Summary of our Hardy Weinberg question
| Genotype | Expected | Observed | O – E |
| aa | 70 | 45 | -25 |
| aa’ | 27 | 34 | 7 |
| a’a’ | 3 | 21 | 18 |
| sum | 100 | 100 | 0 |
Recall from your genetics class that we can get the allele frequency values from the genotype values, eg,
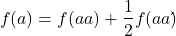
We call these chi-square tests, tests of goodness of fit. Because we have some theory, in this case Mendelian genetics, or guidance, separate from the study itself, to help us calculate expected values in a chi-square test.
Note 1: The idea of fit in statistics can be reframed as how well does a particular statistical model fit the observed data. A good fit can be summarized by accounting for the differences between the observed values and the comparable values predicted by the model.
Note also for our coin toss example, goodness of fit isn’t exactly proper terminology — afterall the test is equal probability of the two outcomes, not whether we have match between an observed distribution and an expected distribution (true statement if we add “follows a binomial distribution”).
goodness of fit
For k groups, the equation for the chi-square test may be written as
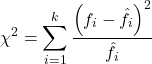
where fi is the frequency (count) observed (in class i) and fi<hat> is the frequency (count) expected if the null hypothesis is true, sum over all k groups. Alternatively, here is a format for the same equation that may be more familiar to you… ?
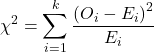
where Oi is the frequency (count) observed (in class i) and Ei is the frequency (count) expected if the null hypothesis is true.
The degrees of freedom, df, for the GOF are simply the number of categories minus one, k – 1.
Explaining GOF
Why am I using the phrase “goodness of fit?” This concept has broad use in statistics, but in general it applies when we ask how well a statistical model fits the observed data.
At least for the chi-square test it is simple to see how the test statistic increases from zero as the agreement between observed data and expected data depart, where zero would be the case in which all observed values for the categories exactly match the expected values.
The goodness of fit test is designed to evaluate whether or not your data agree with a theoretical expectation (there are additional ways to think about this test, but this is a good place to start). Let’s take our time here and work with an example. The other type of chi-square problem or experiment is one for the many types of experiments in which the response variable is discrete, just like in the GOF case, but we have no theory to guide us in deciding how to obtain the expected values. We can use the data themselves to calculate expected values, and we say that the test is “contingent” upon the data, hence these types of chi-square tests are called contingency tables.
You may be a little concerned at this point that there are two kinds of chi-square problems, goodness of fit and contingency tables. We’ll deal directly with contingency tables in the next section, but for now, I wanted to make a few generalizations.
- Both goodness of fit and contingency tables use the same chi-square equation and analysis. They differ in how the degrees of freedom are calculated.
- Thus, what all chi-square problems have in common, whether goodness of fit or contingency table problems
- You must identify what types of data are appropriate for this statistical procedure? Categorical (nominal data type).
- As always, a clear description of the hypotheses being examined.
For goodness of fit chi-square test, the most important type of hypothesis is called a Null Hypothesis: In most cases the Null Hypothesis (HO) is “no difference” “no effect”…. If HO is concluded to be false (rejected), then an alternative hypothesis (HA) will be assumed to be true. Both are specified before tests are conducted. All possible outcomes are accounted for by the two hypotheses.
From above, we have
- A. HO: Fifty out of 100 tosses will result in heads.
- HA: Heads will not appear 50 times out of 100.
- B. HO: Pea shape will equal Mendelian ratios (3:1).
- HA: Pea shape will not equal Mendelian ratios (3:1).
- C. HO: Genotypic frequencies will equal Hardy-Weinberg expectations.
- HA: Genotypic frequencies will not equal Hardy-Weinberg expectations
Assumptions: In order to use the chi-square, there must be two or more categories. Each observation must be in one and only one category. If some of the observations are truly halfway between two categories then you must make a new category (eg, low, middle, high) or use another statistical procedure. Additionally, your expected values are required to be integers, not ratio. The number of observed and the number of expected must sum to the same total.
The chi-square test is a good example of such tests, and we will encounter other examples too. Another common goodness of fit is the coefficient of determination, which will be introduced in linear regression sections (see Chapter 17.7 – Regression model fit). Still other examples are the likelihood ratio test (LRT), Akaike Information Criterion (AIC), and Bayesian Information Criterion (BIC), which are all used to assess fit of models to data. (See Graffelman and Weir [2018] for how to use AIC in the context of testing for Hardy Weinberg equilibrium.)
The likelihood ratio test is used to compare the goodness of fit of two hierarchically nested models to determine if a more complex model provides a significantly better fit to the data. It does this by forming a ratio of the likelihood of the data under the two models (the simpler “null” model and the more complex “alternative” model). A small ratio suggests the simpler model is a poor fit, while a value close to one indicates the added complexity is not statistically significant. AIC (and BIC) is a measure of relative fit — it balances goodness of fit and model complexity: A lower AIC suggests a better model by finding the optimal trade-off between fitting the data well and keeping the model simple. A model that is too complex will have a higher AIC than a simpler model with a nearly as good fit.
We use LRT, AIC and BIC when we talk about selecting best regression models (see Chapter 17.7 – Regression model fit). However, as we discuss the concept of comparing models, we need to distinguish between the concept of model choice — methods used to select a best model from competing options and estimating the “goodness of fit” of a single model.
How well does data fit the prediction?
Frequentist approach interprets the test as, how well does the data fit the null hypothesis,  ? When you compare data against a theoretical distribution (eg, Mendel’s hypothesis predicts the distribution of progeny phenotypes for a particular genetic system), you test the fit of the data against the model’s predictions (expectations). Recall that the Bayesian approach asks how well does the model fit the data?
Table 2. A. 120 tosses of a coin, we count heads 70/120 tosses.
| Expected | Observed | |
| Heads | 60 | 70 |
| Tails | 60 | 50 |
| n | 120 | 120 |

Table 3. B. A possible Mendelian system of inheritance for a one gene, two allele system with complete dominance, observe the phenotypes.
| Expected | Observed | |
| Round | 75 | 84 |
| Wrinkled | 25 | 16 |
| n | 100 | 100 |

Table 4. C. A possible Mendelian system of inheritance for a one gene, two allele system with complete dominance, observe the phenotypes.
| Expected | Observed | |
| p2 | 70 | 45 |
| 2pq | 27 | 34 |
| q2 | 3 | 21 |
| n | 100 | 100 |

For completeness, instead of a goodness of fit test we can treat this problem as a test of independence, a contingency table problem. We’ll discuss contingency tables more in the next section, but or now, we can rearrange our table of observed genotypes for problem C, as a 2X2 table
Table 5. Problem C reported in 2X2 table format.
| Maternal a’ | Paternal a’ | |
| Maternal a | 45 | 17 |
| Paternal a | 17 | 21 |
The contingency table is calculated the same way as the GOF version, but the degrees of freedom are calculated differently: df = number of rows – 1 multiplied by the number of columns – 1.

Thus, for a 2X2 table the df are always equal to 1.
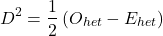
Note that the chi-square value itself says nothing about how any discrepancy between expectation and observed genotype frequencies come about. Therefore, one can rearrange the equation to make clear where deviance from equilibrium, D, occur for the heterozygote (het). We have

where D2 is equal to
φ coefficient
The chi-square test statistic and its inference tells you about the significance of the association, but not the strength or effect size of the association. Not surprisingly, Pearson (1904) came up with a statistic to quantify the strength of association between two binary variables, now called the φ (phi) coefficient. Like the Pearson product moment correlation, the φ (phi) coefficient takes values from -1 to +1.
Note 2: Pearson termed this statistic the mean square contingency coefficient. Yule (1912) termed it the phi coefficient. The correlation between two binary variables is also called the Mathews Correlation Coefficient or MCC (Mathews 1975), which is a common classification tool in machine learning.
The formula for the absolute value of φ coefficient is

Thus, for A, B, and C examples, φ coefficient was 0.167, 0.190, and 0.771. Thus, only weak associations in examples A and B, but strong association in C. We’ll provide a formula to directly calculate φ coefficient from the cells of the table in 9.2 – Chi-square contingency tables.
Carry out the test and interpret results
What was just calculated? The chi-square, , test statistic.
Just like t-tests, we now want to compare our test statistic against a critical value — calculate degrees of freedom (df = k – 1, k equals the numbers of categories), and set a rejection level, Type I error rate. We typically set the Type I error rate at 5%. A table of critical values for the chi-square test is available in Appendix Table Chi-square critical values.
Obtaining Probability Values for the goodness-of-fit test of the null hypothesis:
As you can see from the equation of the chi-square, a perfect fit between the observed and the expected would be a chi-square of zero. Thus, asking about statistical significance in the chi-square test is the same as asking if your test statistic is significantly greater than zero.
The chi-square distribution is used and the critical values depend on the degrees of freedom. Fortunately for and other statistical procedures we have Tables that will tell us what the probability is of obtaining our results when the null hypothesis is true (in the population).
Here is a portion of the chi-square critical values for probability that your chi-square test statistic is less than the critical value (Fig 1).
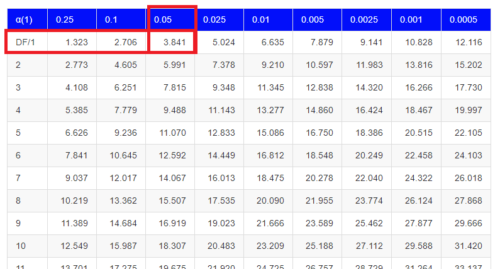
Figure 1. A portion of critical values of the chi-square at alpha 5% for degrees of freedom between 1 and 10. A more inclusive table is provided in the Appendix, Table of Chi-square critical values.
For the first example (A), we have df = 2 – 1 = 1 and we look up the critical value corresponding to the probability in which Type I = 5% are likely to be smaller iff (“if and only if”) the null hypothesis is true. That value is 3.841; our test statistic was 3.330, and therefore smaller than the critical value: so we do not reject the null hypothesis.
Interpolating p-values
How likely is our test statistic value of 3.333 and the null hypothesis was true? (Remember, “true” in this case is a shorthand for our data was sampled from a population in which the HW expectations hold). When I check the table of critical values of the chi-square test for the “exact” p-value, I find that our test statistic value falls between a p-value 0.10 and 0.05 (represented in the table below). We can interpolate
Note 3: Interpolation refers to any method used to estimate a new value from a set of known values. Thus, interpolated values fall between known values. Extrapolation on the other hand refers to methods to estimate new values by extending from a known sequence of values.
Table 6. Interpolated p-value for critical value not reported in chi-square table.
| statistic | p-value |
| 3.841 | 0.05 |
| 3.333 | x |
| 2.706 | 0.10 |
If we assume the change in probability between 2.706 and 3.841 for the chi-square distribution is linear (it’s not, but it’s close), then we can do so simple interpolation.
We set up what we know on the right hand side equal to what we don’t know on the left hand side of the equation,

and solve for x. Then, x is equal to 0.0724
R function pchisq() gives a value of p = 0.0679. Close, but not the same. Of course, you should go with the result from R over interpolation; we mention how to get the approximate p-value by interpolation for completeness, and, in some rare instances, you might need to make the calculation. Interpolating is also a skill used to provide estimates where the researcher needs to estimate (impute) a missing value.
Interpreting p-values
This is a pretty important topic, so much so that we devote an entire section to this very problem — see 8.2 – The controversy over proper hypothesis testing. If you skipped the chapter, but find yourself unsure how to interpret the p-value, then please go back to Ch 8.2. OK, that commercial message, what does it mean to “reject the chi-square null hypothesis?” These types of tests are called goodness of fit in the following sense — if your data agree with the theoretical distribution, then the difference between observed and expected should be very close to zero. If it is exactly zero, then you have a perfect fit. In our coin toss case, if we say that the ratio of heads:tails do not differ significantly from the 50:50 expectation, then we accept the null hypothesis.
You should try the other examples yourself! A hint, the degrees of freedom are one (1) for example B and two (2) for example C.
R code
Printed tables of the critical values from the chi-square distribution, or for any statistical test for that matter are fine, but with your statistical package R and Rcmdr, you have access to the critical value and the p-value of your test statistic simply by asking. Here’s how to get both.
First, let’s get the critical value.
Rcmdr: Distributions → Continuous distributions → Chi-squared distribution → Chi-squared quantiles (Fig 2).
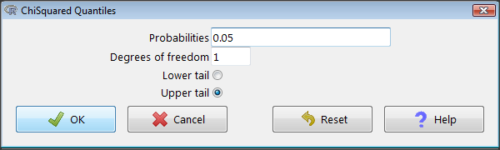
Figure 2. R Commander menu for Chi-squared quantiles.
I entered “0.05” for the probability because that’s my Type I error rate α. Enter “1” for Degrees of freedom, then click “upper tail” because we are interested in obtaining the critical value for α. Here’s R’s response when I clicked “OK.”
qchisq(c(0.05), df=1, lower.tail=FALSE)
[1] 3.841459
Next, let’s get the exact P-value of our test statistic. We had three from three different tests:  for the coin-tossing example,
 for the pea example, and
 for the Hardy-Weinberg example.
Rcmdr: Distributions → Continuous distributions → Chi-squared distribution → Chi-squared probabilities… (Fig 3).
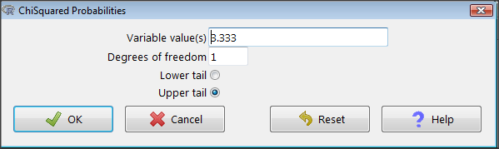
Figure 3. R Commander menu for Chi-squared probabilities.
I entered “3.333” because that is one of the test statistics I want to calculate for probability and “1” for Degrees of freedom because I had k – 1 = 1 df for this problem. Here’s R’s response when I clicked “OK.”
pchisq(c(3.333), df=1, lower.tail=FALSE)
[1] 0.06790291
I repeated this exercise for I got  ; for I got
 .
Nice, right? Saves you from having to interpolate probability values from the chi-square table.
3. How to get the goodness of fit in Rcmdr.
R provides the goodness of fit (the command is chisq.text()), but Rcmdr thus far does not provide a menu option to link to the function. Instead, R Commander provides a menu for contingency tables, which also is a chi-square test, but is used where no theory is available to calculate the expected values (see Chapter 9.2). Thus, for the goodness of fit chi-square, we will need to bypass Rcmdr in favor of the script window. Honestly, other options are as quick or quicker: calculate by hand, use a different software (eg, Microsoft Excel), or many online sites provide JavaScript tools.
So how to get the goodness of fit chi-square while in R? Here’s one way. At the command line, type
chisq.test (c(O1, O2, ... On), p = c(E1, E2, ... En))
where O1, O2, … On are observed counts for category 1, category 2, up to category n, and E1, E2, … En are the expected proportions for each category. For example, consider our Heads/Tails example above (problem A).
In R, we write and submit
chisq.test(c(70,30),p=c(1/2,1/2))
R returns
Chi-squared test for given probabilities.
data: c(70, 30)
X-squared = 16, df = 1, p-value = 0.00006334
Easy enough. But not much detail — details are available with some additions to the R script. I’ll just link you to a nice website that shows how to add to the output so that it looks like the one below.
mike.chi <- chisq.test(c(70,30),p=c(1/2,1/2))
Let’s explore one at time the contents of the results from the chi square function.
names(mike.chi)   #The names function
[1] "statistic" "parameter" "p.value" "method" "data.name" "observed"
[7] "expected" "residuals" "stdres"
Now, call each name in turn.
mike.chi$residuals
[1] 2.828427 -2.828427
mike.chi$obs
[1] 70 30
mike.chi$exp
[1] 50 50
Note 4: “residuals” here simply refers to the difference between observed and expected values. Residuals are an important concept in regression, see Ch17.5
And finally, let’s get the summary output of our statistical test.
mike.chi
Chi-squared test for given probabilities.
data: c(70, 30)
X-squared = 16, df = 1, p-value = 6.334e-05
GOF and spreadsheet apps
Easy enough with R, but it may even easier with other tools. I’ll show you how to do this with spreadsheet apps and with and online at graphpad.com.
Let’s take the pea example above. We had 16 wrinkled, 84 round. We expect 25% wrinkled, 75% round.
Now, with R, we would enter
chisq.test(c(16,80),p=c(1/4,3/4))
and the R output
Chi-squared test for given probabilities
data: c(16, 80)
X-squared = 3.5556, df = 1, p-value = 0.05935
Microsoft Excel and the other spreadsheet programs (Apple Numbers, Google Sheets, LibreOffice Calc) can calculate the goodness of fit directly; they return a P-value only. If the observed data are in cells A1 and A2, and the expected values are in B1 and B2, then use the procedure =CHITEST(A1:A2,B1:B2).
Table 7. A spreadsheet with formula visible.
| A | B | C | D | |
| 1 | 80 | 75 | ||
| 2 | 16 | 25 | =CHITEST(A1:A2,B1:B2) |
The P-value (but not the Chi-square test statistic) is returned. Here’s the output from Calc.
Table 8. Spreadsheet example from Table 7 with calculated P-value.
| A | B | C | D | |
| 1 | 80 | 75 | ||
| 2 | 16 | 25 | 0.058714340077662 |
You can get the critical value from MS Excel (=CHIINV(alpha, df), returns the critical value), and the exact probability for the test statistic =CHIDIST(x,df), where x is your test statistic. Putting it all together, a general spreadsheet template for goodness of fit calculations calculations of test statistic and p-value might look like
Table 9. Spreadsheet template with formula to calculate chi-square goodness of fit on two groups.
| A | B | C | D | E | |
| 1 | f1 | 0.75 | |||
| 2 | f2 | 0.25 | |||
| 3 | N | =SUM(A5,A6) |
|||
| 4 | Obs | Exp | Chi.value | Chi.sqr | |
| 5 | 80 | =B1* |
=((A5-B5)^2)/B5 |
=SUM(C5,C6) |
|
| 6 | 16 | =B2* |
=((A6-B6)^2)/B6 |
=CHIDIST(D5, COUNT(A5:A6-1) |
|
| 7 | |||||
| 8 |
Microsoft Excel can be improved by writing macros, or by including available add-in programs, such as the free PopTools, which is available for Microsoft Windows 32-bit operating systems only.
Another option is to take advantage of the internet — again, many folks have provided java or JavaScript-based statistical routines for educational purposes. Here’s an easy one to use www.graphpad.com.
In most cases, I find the chi-square goodness-of-fit is so simple to calculate by hand that the computer is redundant.
Questions
1. A variety of p-values were reported on this page with no attempt to reflect significant figures or numbers of digits (see Chapter 8.2). Provide proper significant figures and numbers of digits as if these p-values were reported in a science journal.
- 0.0724
- 0.0679
- 0.03766692
- 0.004955794
- 0.00006334
- 6.334e-05
- 0.05935
- 0.058714340077662
2. For a mini bag of M&M candies, you count 4 blue, 2 brown, 1 green, 3 orange, 4 red, and 2 yellow candies.
- What are the expected values for each color?
- Calculate using your favorite spreadsheet app (eg, Numbers, Excel, Google Sheets, LibreOffice Calc)
- Calculate using R (note R will reply with a warning message that the “Chi-squared approximation may be incorrect”; see 9.2 Yates continuity correction)
- Calculate using Quickcalcs at graphpad.com
- Construct a table and compare p-values obtained from the different applications
3. CYP1A2 enzyme involved with metabolism of caffeine. Folks with C at SNP rs762551 have higher enzyme activity than folks with A. Populations differ for the frequency of C. Using R or your favorite spreadsheet application, compare the following populations against global frequency of C is 33% (frequency of A is 67%).
- 286 persons from Northern Sweden: f(C) = 26%, f(A) = 73%
- 4532 Native Hawaiian persons: f(C) = 22%, f(A) = 78%
- 1260 Native American persons: f(C) = 30%, f(A) = 70%
- 8316 Native American persons: f(C) = 36%, f(A) = 64%
- Construct a table and compare p-values obtained for the four populations.
Quiz Chapter 9.1
Chi-square test: Goodness of fit
Chapter 9 contents
8.5 – One sample t-test
Introduction.
We’re now talking about the traditional, classical two group comparison involving continuous data types. Thus begins your introduction to parametric statistics. One sample tests involve questions like, how many — what proportion of — people would we expect are shorter or taller than two standard deviations from the mean? This type of question assumes a population and we use properties of the normal distribution and, hence, these are called parametric tests because the assumption is that the data has been sampled from a particular probability distribution.
However, when we start asking questions about a sample statistic (eg, the sample mean), we cannot use the normal distribution directly, ie, we cannot use Z and the normal table as we did before (Chapter 6.7). This is because we do not know the population standard deviation and therefore must use an estimate of the variation (s) to calculate the standard error of the mean.
With the introduction of the t-statistic, we’re now into full inferential statistics-mode. What we do have are estimates of these parameters. The t-test — aka Student’s t-test — was developed for the purpose of testing sample means when the true population parameters are not known.
Note 1: It’s called Student’s t-test after the pseudonym used by William Gosset.
The equation of the one sample t-test. Note the resemblance in form with the Z-score!

where  is the sample standard error of the sample mean (SEM).
For example, weight change of mice given a hormone (leptin) or placebo. The  , but under the null hypothesis, the mean change is “really” zero (
 ). How unlikely is our value of 5 g?
Note 2: Did you catch how I snuck in “placebo” and mice? Do you think the concept of placebo is appropriate for research with mice, or should we simply refer to it as a control treatment? See Ch5.4 – Clinical trials for review.
Speaking of null hypotheses, can you say (or write) the null and alternative hypotheses in this example? How about in symbolic form?
We want to know if our sample mean could have been obtained by chance alone from a population where the true change in weight was zero.
and
and we take these values and plug them into our equation of the t-test
Then recall that Degrees of Freedom are DF = n – 1 so we have DF = 20 – 1 = 19 for the one sample t-test. And the Critical Value is found in the appropriate table of critical values for the t distribution (Fig 1)
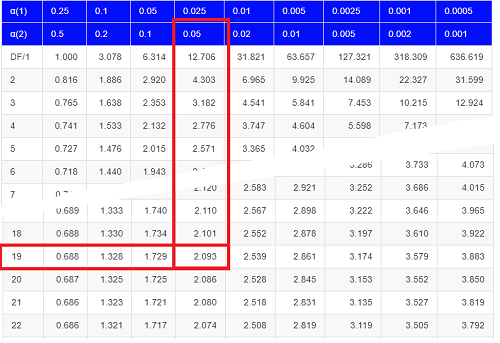
Figure 1. Table of a portion of the Critical values of the t distribution. Red selections highlight critical value for t-test at α = 5% and df = 19.
Note 3: See our table of critical values of t distribution.
Or, and better, use R
qt(c(0.025), df=19, lower.tail=FALSE)
where qt() is function call to find t-score of the pth percentile (cf 3.3 – Measures of dispersion) of the Student t distribution. For a two tailed test, we recall that 0.025 is lower tail and 0.025 is upper tail.
In this example we would be willing to reject the Null Hypothesis if there was a positive OR a negative change in weight.
This was an example of a “two-tailed test” which is “2-tail” or α(2) in Table of critical values of the t distribution.
Critical Value for α(2) = 0.05, df = 19, = 2.093
Do we accept or reject the Null Hypothesis?
A typical inference workflow.
Note the general form of how the statistical test is processed, a form which actually applies to any statistical inference test.
- Identify the type of data
- State the null hypothesis (2 tailed? 1 tailed?)
- Select the test statistic (t-test) and determine its properties
- Calculate the test statistic (the value of the result of the t-test)
- Find degrees of freedom
- For the DF, get the critical value
- Compare critical value to test statistic
- Do we accept or reject the null hypothesis?
And then we ask, given the results of the test of inference, What is the biological interpretation? Statistical significance is not necessarily evidence of biological importance. In addition to statistical significance, the magnitude of the difference — the effect size — is important as part of interpreting results from an experiment. Statistical significance is at least in part because of sample size — the large the sample size, the smaller the standard error of the mean, therefore even small differences may be statistically significant, yet biologically unimportant. Effect size is discussed in Ch9.1 – Chi-square test: Goodness of fit, Ch11.4 – Two sample effect size and Ch12.5 – Effect size for ANOVA.
R Code.
Let’s try a one-sample t-test. Consider the following data set: body mass of four geckos and four Anoles lizards (Dohm unpublished data).
For starters, let’s say that you have reason to believe that the true mean for all small lizards is 5 grams (g).
Geckos: 3.186, 2.427, 4.031, 1.995
Anoles: 5.515, 5.659, 6.739, 3.184
Get the data into R (Rcmdr)
By now you should be able to load this data in one of several ways. If you haven’t already entered the data, check out Part 07. Working with your own data in Mike’s Workbook for Biostatistics.
Once we have our data.frame, proceed to carry out the statistical test.
To get the one-sample t-test in Rcmdr, click on Statistics → Means → Single-sample t-test… Because there is only one numerical variable, Body.mass, that is the only one that shows up in the Variable (pick one) window (Fig 2).
Figure 2. Screenshot Rcmdr single-sample t-test menu.
Type in the value 5.0 in the Null hypothesis: m = u box.
Question 1: Quick! Can you write, in plain old English, the statistical null hypothesis???
Answer 1: For example: No difference between gecko and Anolis lizard mean body mass.
Click OK
The results go to the Output Window.
t.test(lizards$Body.mass, alternative='two.sided', mu=5.0, conf.level=.95)
One Sample t-test
data: lizards$Body.mass
t = -1.5079, df = 7, p-value = 0.1753
alternative hypothesis: true mean is not equal to 5
95 percent confidence interval:
2.668108 5.515892
sample estimates:
mean of x 4.092
end of R output
Let’s identify the parts of the R output from the one sample t-test. R reports the name of the test and identifies
- The
dataset$variableused (lizards$Body.mass). The data set was called “lizards” and the variable was “Body.mass”. R uses the dollar sign ($) to denote the dataset and variable within the data set. - The value of the t test statistic was (t = -1.5079). It is negative because the sample mean was less than the population mean — you should be able to verify this!
- The degrees of freedom, df = 7
- The p-value = 0.1753
- 95% confidence interval of the population mean; lower limit = 2.668108, upper limit = 5.515892
- The sample mean = 4.092
Take a step back and review.
Let’s make sure we “get” the logic of the hypothesis testing we have just completed.
Consider the one-sample t-test.
Step 1. Define HO and HA. The null hypothesis might be that a sample mean, , is equal to μ = 5.
The alternate is that the sample mean is not equal to 20.
Where did the value 5 come from? It could be a value from the literature (does the new sample differ from values obtained in another lab?). The point is that the value is known in advance, before the experiment is conducted, and that makes it a one-sample t-test.
One tailed hypothesis or two?
We introduced you to the idea of “tails of a test” (Ch08.4). As you should recall, a null/alternative hypothesis for a two-tailed test may be written as
Null hypothesis

versus the alternative hypothesis

where is the sample mean and  is the population mean.
Alternatively, we can write one-tailed tests of null/alternative hypothesis

for the null hypothesis versus the alternative hypothesis

Question 2: Are all possible outcomes of the one-tailed test covered by these two hypotheses?
Answer 2: Yes
Question 3: What was the SEM for this problem?
Answer 3: It would be the sample standard deviation divided by the square root of the sample size.
Step 2. Decide how certain you wish to be (with what probability) that the sample mean is different from μ. As stated previously, in biology, we say that we are willing to be incorrect 5% of the time (Cowles and Davis 1982; Cohen 1994). This means we are likely to correctly reject the null hypothesis 100% – 5% = 95% of the time, which is the definition of statistical power. We do this by setting the Type I error to be 5% (alpha, α = 0.05). The Type I error is the chance that we will reject a null hypothesis, but the true condition in the population we sampled was actually “no difference.”
Step 3. Carry out the calculation of the test statistic. In other words, get the value of t from the equation above by hand, or, if using R (yes!) simply identify the test statistic value from the R output after conducting the one sample t test.
Step 4. Evaluate the result of the test. If the value of the test statistic is greater than the critical value for the test, then you conclude that the chance (the P-value) that the result could be from that population is not likely and you therefore reject the null hypothesis.
Question 4: What is the critical value for a one-sample t-test with df = 7?
Answer 4: From R, we get + 2.365 for the two-tailed test. R code was qt(c(.025), df=7, lower.tail=FALSE)
Hint; you need the table or better, use R
Rcmdr: Distributions → Continuous distributions → t distributions → t quantiles
You also need to know three additional things to answer this question.
- You need to know alpha (α), which we have said generally is set at 5%.
- You also need to know the degrees of freedom (DF) for the test. For a one sample t-test, DF = n – 1, where n is the sample size.
- You also must know whether your test is one or two-tailed.
- You then use the t-distribution (the tables of the t-distribution at the back of your book) to obtain the critical value. Note that if you use R, the actual p-value is returned.
Why learn the equations when I can just do this in R?
Rcmdr does this for you as soon as you click OK. Rcmdr returns the value of the test statistic and the p-value. R does not show you the critical value, but instead returns the probability that your test statistic is as large as it is AND the null hypothesis is true. From our one-sample t-test example, the Rcmdr output. The simple answer is that in order to understand the R output properly you need to know where each item of the output for a particual test comes from and how to interpret it. Thus, the best way is to have the equations available and to understand the algorithmic approach to statistical inference.
And, this is as good of time as any to show you how to skip the RCmdr GUI and go straight to R.
First, create your variables. At the R prompt enter the first variable
liz <- c("G","G","G","G","A","A","A","A")
and then create the second variable
bm <- c(3.186,2.427,4.031,1.995,5.515,5.659,6.739,3.184)
Next, create a data frame. Think of a data frame as another word for worksheet.
lizz <- data.frame(liz,bm)
Verify that entries are correct. At the R prompt type “lizz” wthout the quotes and you should see
lizz
 liz bm
1 G 3.186
2 G 2.427
3 G 4.031
4 G 1.995
5 A 5.515
6 A 5.659
7 A 6.739
8 A 3.184
End of R output
Carry out the t-test by typing at the R prompt the following
t.test(lizz$bm, alternative='two.sided', mu=5, conf.level=.95)
And, like the Rcmdr output we have for the one-sample t-test the following R output
One Sample t-test
data: lizards$Body.mass
t = -1.5079, df = 7, p-value = 0.1753 alternative hypothesis: true mean is not equal to 5
95 percent confidence interval:
2.668108 5.515892
sample estimates:
mean of x
4.092
End of R output
which, as you probably guessed, is the same as what we got from RCmdr.
Question 5: From the R output of the one sample t-test, what was the value of the test statistic?
- -1.5079
- 7
- 0.1753
- 2.668108
- 5.515892
- 4.092
Answer 5: -1.5079
Note 4: BI311 students — On an exam you will be given portions of statistical tables and output from R. Thus you should be able to evaluate statistical inference questions by completing the missing information. For example, if I give you a test statistic value, whether the test is one- or two-tailed, degrees of freedom, and the Type I error rate alpha, you should know that you would need to find the critical value from the appropriate statistical table. On the other hand, if I give you R output, you should know that the p-value and whether it is less than the Type I error rate of alpha would be all that you need to answer the question.
Why fall back on statistical tables? Think of this as a basic skill. In statistics and for some statistical tests, Rcmdr and other software may not provide the information needed to decide that your test statistic is large, and a table in a statistics book is the best way to evaluate the test.
For now, double check Rcmdr by looking up the critical value from the t-table.
Check critical value against our test statistic
Df = 8 – 1 = 7
The test is two-tailed, therefore α(2)
α = 0.05 (note that two-tailed critical value is 2.365. T was equal to 1.51 (since t-distribution is symmetrical, we can ignore the negative sign), which is smaller than 2.365 and so we would agree with Rcmdr — we cannot reject the null hypothesis.
Question 6: From the R output of the one sample t-test, what was the P-value?
- -1.5079
- 7
- 0.1753
- 2.668108
- 5.515892
Answer 6: 0.1753
Question 7: We would reject the null hypothesis
- False
- True
Answer 7: False — p-value, 17.5%, is greater than Type I error of 5%.
Questions
Seven questions, with answers, were provided for you within the text in this chapter. Here’s one more, but without answers.
8. Here’s a small data set for you to try your hand at the one-sample t-test and Rcmdr. The dataset contains cell counts, five counts of the numbers of beads in a liquid with an automated cell counter (Scepter, Millipore USA). The true value is 200,000 beads per milliliter fluid; the manufacturer claims that the Scepter is accurate within 15%. Does the data conform to the expectations of the manufacturer? Write a hypothesis then test your hypothesis with the one-sample t-test. Here’s the data.
| scepter |
| 258900 |
| 230300 |
| 107700 |
| 152000 |
| 136400 |
Quiz Chapter 8.5
One sample t-test
Chapter 8 contents
8.4 – Tails of a test
Introduction
The basics of statistical inference is to establish the null and alternative hypotheses. Starting with the simplest cases, where there is one sample of observations and the comparison is against a population (theory) mean, how many possible comparisons can be made? The next simplest is the two-sample case, where we have two sets of observations and the comparison is against the two groups. Again, how many total comparisons may be made?
Let , “X bar”, equal the sample mean and , “mu”, represent the population mean. For sample means, designate groups by a subscript, 1 or 2. We then have Table 1.
Table 1. Possible hypothesis involving two groups
| Comparison | One-same | Two-sample |
| 1. |  |
 |
| 2. |  |
 |
| 3. |  |
 |
| 4. |  |
 |
| 5. |  |
 |
| 6. |  |
 |
Classical statistics classifies inference into null hypothesis, HO, vs. alternative hypotheses, HA, and specifies that we test null hypotheses based on the value of the estimated test statistic (see discussion about critical value and p-value, Chapter 8.2). From the list of six possible comparisons we can divide them into one-tailed and two-tailed differences (Table 1). By “tail” we are referring to the ends or tails of a distribution (Figure 1, Figure 2); where do our results fall on the distribution?
Two-tailed hypotheses: Comparison 1 and comparison 2 in the table above are two-tailed hypotheses. We don’t ask about the direction of any difference (less than or greater than).
Figure 1 shows the “two-tailed” distribution — if our results fall to the left ,  , or to the right
 we reject the null hypothesis (blue regions in the curve). We divide the type I error into two equal halves.
Note 1: It’s a nice trick to shade in regions of the curve. A package tigerstats includes the function pnormGC that simplifies this task.
Figure 1. Two-tailed distribution.
RcmdrMisc::plotDistr(x = seq(-4, 4, length.out = 100),
  p = dnorm(seq(-4, 4, length.out = 100)),
  regions = list(c(-Inf, -1.96), c(1.96, Inf)),
  xlab="X", ylab="Density",
  col=c("blue"),
  legend=FALSE)
Figure 2 shows the “one-tailed” distribution — if our alternative hypothesis was that the sample mean was less than the population mean, then our fall to the left,  , for the “lower tail” of the distribution. If, however, our alternative hypothesis was that the sample mean was greater than the population mean, then our region of interest falls to the right,
 . Again, we reject the null hypothesis (blue regions in the curve). Note for one-tailed hypothesis, all Type I error occurs in the one area, not both, so
 (alpha) remains 0.05 over the entire rejection region (Fig 2).
Figure 2. One-tailed distribution, lower tail (left) and upper tail (right).
library(tigerstats)
pnormGC(1.645, region="above", mean=0, sd=1,graph=TRUE)
pnormGC(-1.645, region="below", mean=0, sd=1,graph=TRUE)
One-tailed hypotheses: Comparison 3 through comparison 6 in the table are one-tailed hypotheses. The direction of the difference matters.
Note a simple trick to writing one-tailed hypotheses: first write the alternative hypothesis because the null hypothesis includes all of the other possible outcomes of the test.
Examples
Let’s consider some examples. We learn best by working through cases.
Chemotherapy as an approach to treat cancers owes its origins to the work of Dr Sidney Farber among others in the 1930s and ’40s (DeVita and Chu 2008; Mukherjee 2011). Following up on the observations of others that folic acid (vitamin B9) improved anemia, Dr Farber believed that folic acid might reverse the course of leukemia (Mukherjee 2011). In 1946 he recruited several children with acute lymphoblastic leukemia and injected them with folic acid. Instead of ameliorating their symptoms (eg, white blood cell counts and percentage of abnormal immature white blood cells, called blast cells), treatments accelerated progression of the disease. That’s a scientific euphemism for the reality — the children died sooner in Dr. Faber’s trial than patients not enrolled in his study. He stopped the trials. Clearly, adding folic acid was not a treatment against this leukemia.
Question 1. Do you think these experiments are one sample or two sample? Hint: Is there mention of a control group?
Answer: There’s no mention of a control group, but instead, Dr. Faber would have had plenty of information about the progression of this disease in children. This was a one sample test.
Question 2. What would be a reasonable interpretation of Dr Faber’s alternative hypothesis with respect to percentage of blast cells in patients given folic acid treatment? Your options are
- Folic acid supplementation has an effect on blast counts.
- Folic acid supplementation reduces blast counts.
- Folic acid supplementation increases blast counts.
- Folic acid supplementation has no effect on blast counts.
Answer: At the start of the trials, it is pretty clear that the alternative hypothesis was intended to be a one-tailed test (option 2). Dr. Faber’s alternative hypothesis clearly was that he believed that addition of folic acid would reduce blast cell counts. However, that they stopped the trials shows that they recognized that the converse had occurred, that blast counts increased; this means that, from a statistician’s point of view, Dr Faber’s team was testing a two-sided hypothesis (option 1).
Another example.
Dr Farber reasoned that if folic acid accelerated leukemia progression, perhaps anti-folic compounds might inhibit leukemia progression. Dr Farber’s team recruited patients with acute lymphoblastic leukemia and injected them with a folic acid agonist called aminopterin. Again, he predicted that blast counts would reduce following administration of the chemical. This time, and for the first time in recorded medicine, blast counts of many patients drastically reduced to normal levels and the patients experienced remissions. The remissions were not long lasting and all patients eventually succumbed to leukemia. Nevertheless, these were landmark findings — for the first time a chemical treatment was shown to significantly reduce blast cell counts, even leading to remission, if however brief (Mukherjee 2011).
Try Question 3 and Question 4 yourself.
Question 3. Do you think these experiments are one sample or two sample? Hint: Is there mention of a control group?
Question 4. What would be a reasonable interpretation of Dr Faber’s alternative hypothesis with respect to percentage of blast cells in patients given aminopterin treatment? Your options are
- Aminopterin supplementation has an effect on blast counts.
- Aminopterin supplementation reduces blast counts.
- Aminopterin supplementation increases blast counts.
- Aminopterin supplementation has no effect on blast counts.
Pros and Cons to One-sided testing
Here’s something to consider: why not restrict yourself to one-tailed hypothesis?
Here’s the pro-argument for one-tailed tests. Strictly speaking you gain statistical power to test the null hypothesis. For example, look up the t-test distribution for degrees of freedom equal to 20 and compare  (one tail) vs.
 (two-tail). You will find that for the one-tailed test, the critical value of the t-distribution with 20 df is 1.725, whereas for the two-tailed test, the critical value of the t-distribution with the same numbers of df is 2.086. Thus, the difference between means can be much smaller in the one-tailed test and prove to be “statistically significant.” Put simply, with the same data, we will reject the Null Hypothesis more often with one-tailed tests.
Or better yet, if during exploratory data analysis you see a clear difference between the groups and it is in the direction your scientific intuition suggests it should be, shouldn’t you switch to a one-tailed hypothesis? That’s a hard no. You would be “guilty” of p-hacking — the inappropriate manipulation of data analysis to get a more favored, statistically significant result.
The con-argument. If you use a one-tailed test you MUST CLEARLY justify its use and be aware that a deviation in the opposite direction MUST be ignored! More specifically, you interpret a one-tailed result in the opposite direction as acceptance of the null — you cannot, after the fact, change your mind and start speaking about “statistically significant differences” if you had specified a one-tailed hypothesis and the results showed differences in the opposite direction.
Note 2: Recall also that, by itself, statistical significance judged by the p-value against a specified cut-off critical value is not enough to say there is evidence for or against the hypothesis. For that we need to consider effect size, see Power analysis in Chapter 11.
Questions
- For a Type I error rate of 5% and the following degrees of freedom, compare the critical values for one tail test and a two tailed test of the null hypothesis.
- 5 df
- 10 df
- 15 df
- 20 df
- 25 df
- 30 df
- Using your findings from Additional Question 1, make a scatterplot with degrees of freedom on the horizontal axis and critical values on the vertical axis. What trend do you see for the difference between one and two tailed tests as degrees of freedom increase?
- A clinical nutrition researcher wishes to test the hypothesis that a vegan diet lowers total serum cholesterol levels compared to an omnivorous diet. What kind of hypothesis should he use, one-tailed or two-tailed? Justify your choice.
- Spironolactone, introduced in 1953, is used to block aldosterone in hypertensive patients. A newer drug eplerenone, approved by the FDA in 2002, is reported to have the same benefits as spironolactone (reduced mortality, fewer hospitalization events), but with fewer side effects compared with spironolactone. Does this sentence suggest a one-tailed test or a two-tailed test?
- Write out the appropriate null and alternative hypothesis statements for the spironolactone and eplerenone scenario.
- You open up a bag of Original Skittles and count the number of green, orange, purple, red, and yellow candies in the bag. What kind of hypothesis should be used, one-tailed or two-tailed? Justify your choice.
- Verify the probability values from the table of standard normal distribution for Z equal to -1.96, -1.645, 1.645, and 1.96.
Quiz Chapter 8.4
Tails of a test
Chapter 8 contents
8.2 – The controversy over proper hypothesis testing
Introduction
Over the next several chapters we will introduce and develop an approach to statistical inference, which has been given the title “Null Hypothesis Significance Testing” or NHST.
In outline, NHST proceeds with
- statements of two hypotheses, a null hypothesis, HO, and an alternative hypothesis, HA
- calculate a test statistic comparison of the null hypothesis (assuming some characteristic of data).
- The value of the test statistic is to be compared to a critical value for the test, identified for the assumed probability distribution at associated degrees of freedom for the statistical function, and assigned Type I error rate.
We will expand on these statements later in this chapter, so stay with me here. Basically, the null hypothesis is often a statement like the responses of subjects from the treatment and control groups are the same, eg, no treatment effect. Note that the alternative hypothesis, eg, hypertensive patients receiving hydalazine for six weeks have lower systolic blood pressure than patients receiving a placebo (Campbell et al 2011), would be the scientific hypothesis we are most interested in. But in the Frequentist NHST approach we test the null hypothesis, not the alternative hypothesis. This framework over proper hypothesis testing is the basis of the Bayesian vs Frequentist controversy.
Consider the independent sample t-test (see Chapter 8.5 and 8.6), our first example of a parametric test.

After plugging in the sample means and the standard error for the difference between the means, we calculate t, the test statistic of the t-test. The critical value is treated as a cut-off value in the NHST approach. We have to set our Type I error rate before we start the experiment, and we have available the degrees of freedom for the test, which follows from the sample size. With these in hand, the critical value is found by looking in the t-table of probabilities (or better, use R).
For example, what is the critical value of t-test with 10 degrees of freedom and Type I error of 5%?
In Rcmdr, choose Distributions → Continuous distributions → t distribution → t quantiles… (Fig 1).
Figure 1. Screenshot t-quantiles Rcmdr menu.
Note we want Type I equal to 5%. Since there are two tails for our test, we divide 5% by two and enter 0.025 and select the Upper tail.
R output
> qt(c(.025), df=10, lower.tail=FALSE)
[1] 2.228139
which is the same thing we would get if we look up on the t-distribution table (Fig 2).
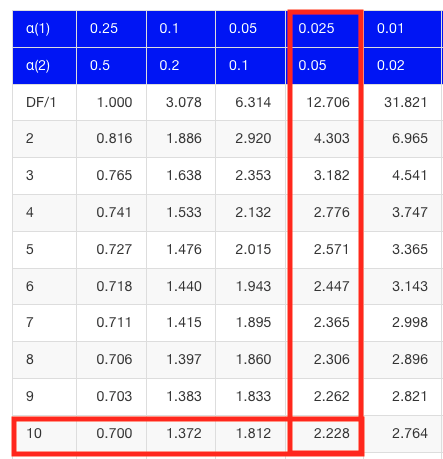
Figure 2. Screenshot of portion of t-table with highlighted (red) critical value for 10 degrees of freedom.
If the test statistic is greater than the critical value, then the conclusion is that the null hypothesis is to be provisionally rejected. We would like to conclude that the alternative hypothesis should favored as best description of the results. However, we cannot — the p-value simply tells us how likely our results would be obtained and if the null hypothesis was true. Confusingly, however, you cannot interpret the p-value as telling you the probability (how likely) that the null hypothesis is true. If however the test statistic is less than the critical value, then the conclusion is that the null hypothesis is to be provisionally accepted.
The test statistic can be assigned a probability or p-value. This p-value is judged to be large or small relative to an a priori error probability level cut off called the Type I error rate. Thus, NHST as presented in this way may be thought of as a decision path — if the test statistic is greater than the critical value, which will necessarily mean that the p value is less than the Type I error rate, then we make one type of conclusion (reject HO). In contrast, if the test statistic is less than the critical value, which will mean that the p-value associated with the test statistic will be greater than the Type I error rate, then we conclude something else about the null hypothesis. The various terms used in this description of NHST were defined in Chapter 8.3.
Sounds confusing, but, you say, OK, what exactly is the controversy? The controversy has to do whether the probability or p-value can be interpreted as evidence for a hypothesis. In one sense, the smaller the p-value, the stronger the case to reject the null hypothesis, right? However, just because the p-value is small — the event is rare — how much evidence do we have that the null hypothesis is true? Not necessarily, and so we can only conclude that the p-value is one part of what we may need for evidence for or against a hypothesis (hint: part of the solution is to consider effect size — introduced in Chapter 9.2 — and the statistical power of the test, see Ch 11). What follows was covered by Goodman (1988) and others. Here’s the problem. Consider tossing a fair coin ten times, with the resulting trial yielding nine out of ten heads (eg, a value of one, with tails equal to zero).
R code
set.seed(938291156)
rbinom(10,1,0.5)
[1] 1 1 1 1 1 1 0 1 1 1
Note 1: To get this result I repeated rbinom() a few times until I saw this rare result. I then used the command get_seed() from mlr3misc package to retrieve current seed of R’s random number generator. Initialize the random seed with the command set.seed().
While rare (binomial probability 0.0098), do we take this as evidence that the coin is not fair? By itself, the p-value provides no information about the alternative hypothesis. More about p-value follows below in sections What’s wrong with the p-value from NHST? and The real meaning and interpretation of P-values.
Statisticians have been aware of limitations of the NHST approach for years (see editorial by Wasserstein et al 2019), but only now is the message getting attention of researchers in the biosciences and other fields. In fact, the New York Times recently had a nice piece by F.D. Flam (“The Odds, Continually Updated,” 29 Sep 2014) on the controversy and the Bayesian alternative. Like most controversies there are strong voices on either side, and it can be difficult as an outsider to know which position to side with (Fig 3).
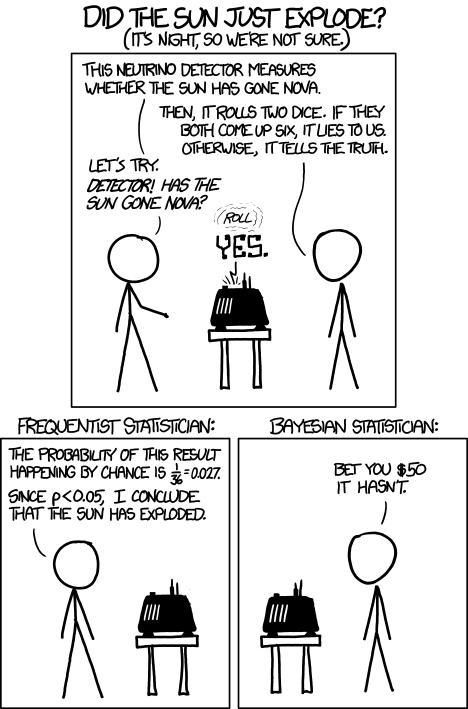
Figure 3. “Frequentists vs. Bayesians,” https://xkcd.com/1132/.
The short answer is — as you go forward do realize that there is a limitation to the frequentist approach and to be on the correct side of the controversy, you need to understand what you can conclude from statistical results. NHST is by far the most commonly used approached in biosciences (eg, out of 49 research articles I checked from four randomly selected issues of 2015 PLoS Biology, 43 used NHST, 2 used a likelihood approach, none used Bayesian statistics). The NHST is also the overwhelming manner in which we teach introductory statistics courses (eg, checking out the various MOOC courses at www.coursera.org, all of the courses related to Basic Statistics or Inferential Statistics are taught primarily from the NHST perspective). However, right from the start I want to emphasize the limits of the NHST approach.
If the purpose of science is to increase knowledge, then the NHST approach by itself is an inadequate framework at best, and in the eyes of some, worthless! Now, I think this latter sentiment is way over the top, but there is a need for us to stop before we begin, in effect, to set the ground rules for what can be interpreted from the NHST approach. The critics of NHST have a very important point, and that needs to be emphasized, but we will also defend use and teaching of this approach so that you are not left with the feeling that somehow this is a waste of time or that you are being cheated from learning the latest knowledge on the subject of statistical inference. The controversy hinges on what probability means.
P-values, statistical power, and replicability of research findings
Science, as a way of knowing how the world works, is the only approach that humans have developed that has been empirically demonstrated to work. Note how I narrowed what science is good for — if we are asking questions about the material world, then science should be your toolkit. Some (eg, Platt 1964), may further argue that there are disciplines in science that have been more successful (eg, molecular biology) than others (eg, evolutionary psychology, cf discussion in Ryle 2006) at advancing our knowledge about the material world. However, to the extent research findings are based solely on statistical results there is reason to believe that many studies in fact have not recovered truth (Ioannidis 2005).
In a review of genomics, it was reported that findings of gene expression differences by many microarray studies were not reproducible (Allison et al 2006). The consensus is that confidence in the findings should hold only for the most abundant gene transcripts of many microarray gene expression profiling studies, a conclusion that undercuts the perceived power of the technology to discover new causes of disease and the basis for individual differences for complex phenotypes. Note that when we write about failure of research reproducibility we are not including cases of alleged fraud (Carlson 2012 on Duke University oncogenomics case), we are instead highlighting that these kinds of studies often lack statistical power; hence, when repeated, the experiments yield different results.
Frequentist and Bayesian Probabilities
Turns out there is a lot of philosophical problems around the idea of “probability,” and three schools of thought. In the Fisherian approach to testing, the researcher devises a null hypothesis, HO, collects the data, then computes a probability (p-value) of the result or outcome of the experiment. If the p-value is small, then this is inferred as little evidence in support of the null hypothesis.
In the Frequentists’ approach, the one we are calling NHST, the researcher devises two hypotheses, the null hypothesis, HO, and an alternative hypothesis, HA. The results are collected from the experiment and, prior to testing, a Type I error rate (α, chance) is defined. The Type I error rate is set to some probability and refers to the chance of rejecting the null hypothesis purely due to random chance. The Frequentist then computes a p-value of result of the experiment and applies a decision criterion: If P-value greater than Type I error rate, then provisionally accept null hypothesis. In both the Fisherian and Frequentist approaches, the probability, again defined at the relative frequency of an event over time, is viewed as a physical, objective and well-defined set of values.
Bayesian approach: based on Bayes conditional probability, one identifies the prior (subjective) probability of an hypothesis, then, adjusts the prior probability (down or up) as new results come in. The adjusted probability is known as posterior probability and it is equal to the likelihood function for the problem. The posterior probability is related to the prior probability and this function can be summarized by the Bayes factor as evidence the evidence against the null hypothesis. And that’s what we want, a metric of our evidence for or against the null hypothesis.
Note 2: A probability distribution function (PDF) is a function of the sample data and returns how likely that particular point will occur in the sample. The distribution is given. The likelihood function approaches this from a different direction. The likelihood function takes the data set as a given and represents how likely are the different parameters for your distribution.
We can calibrate the Bayesian probability to the frequentist p-value (Selke et al 2001; Goodman 2008; Held 2010; Greenland and Poole 2012). Methods to achieve this calibration vary, but the Fagan nomogram Held (2010) proposed is a good tool for us as we go forward. We can calculate our NHST p-value, but then convert the p-value to a Bayes factor by looking at the nomogram. I mention this here not as part of your to do list, but rather as a way past the controversy: the NHST p-value can be interpreted as a Bayesian conditional probability, but they do not test the same hypothesis.
Likelihood
Before we move on there is one more concept to introduce, that of likelihood. We describe a model (an equation) we believe can generate the data we observe. By constructing different models with different parameters (hypotheses), you generate a statistic that yields a likelihood value. If the model fits the data, then the likelihood function has a small value. The basic idea then is to compare related, but different models to see which fits the data better. We will use this approach when comparing linear models when we introduce multiple regression models in Chapter 18.
What’s wrong with the p-value from NHST?
Well, really nothing is “wrong” with the p-value.
Where we tend to get into trouble with the p-value concept is when we try and interpret it. See below, Why is this important to me as a beginning student? The p-value is not evidence for a position, it is a statement about error rates. The p-value from NHST can be viewed as the culmination of a process that is intended to minimize the chance that the statistician makes an error.
In Bayesian terms, the p-value from NHST is the probability that we observe the data (eg, the differences between two sample means), assuming the null hypothesis is true. If we want to interpret the p-value in terms of evidence for a proposition, then we want the conditional error probability.
Sellke et al (2001) provided a calibration of p-values and, assuming that the prior probabilities of the null hypothesis and the alternative hypothesis are equal (that is, that each have a prior probability of 0.5), by using a formula provided by them (equation 3), we can correct our NHST p-value into a probability that can be interpreted as evidence in favor of the interpretation that the null hypothesis is true. In Bayesian terms this is called the posterior probability of the null hypothesis. The formula is

where e is Euler’s number, the base of the natural logarithm (ln), and p is the p-value from the NHST. This calibration works as long as  (Sellke et al 2001).
By convention we set the Type I error at 5% (cf Cohen 1994). How strong of evidence is a p-value near 5% against the null hypothesis being true, again, under the assumption that the prior probability of the null hypothesis being true is 50%? Using the above formula I constructed a plot of the calculated conditional error probability values against p-values (Fig 4).
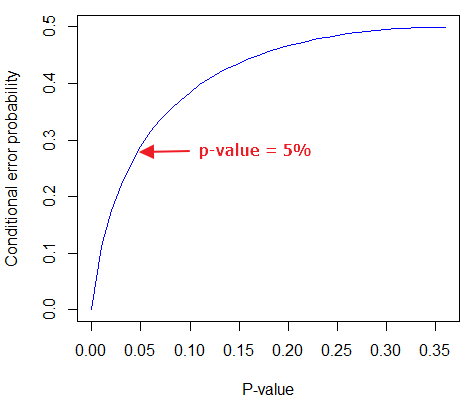
Figure 4. Conditional error probability values plotted against p-values.
As you can see, a p-value of 5% is not strong evidence at just 0.289. Not until p-values are smaller than 0.004 does the conditional error probability value dip below 0.05, suggesting strong evidence against the null hypothesis being true.
R note: For those of you keeping up with the R work, here’s the code for generating this plot. Text after “#” are comments and are not interpreted by R.
At the R prompt type each line
NHSTp = seq(0.00001,0.37,by=0.01)      #create a sequence of numbers between 0.0001 and 0.37 with a step of 0.01
CEP = (1+(-1*exp(1)*NHSTp*log(NHSTp))^-1)^-1    #equation 3 from Sellke et al 2001
plot(NHSTp,CEP,xlab="P-value", ylab="Conditional error probability",type="l",col="blue")
Why is this important to me as a beginning student?
As we go forward I will be making statements about p-values and Type I error rates and null hypotheses and even such things as false positives and false negative. We need to start to grapple with what exactly can be said by p-values in the context of statistical inference, and to recognize that we will sometimes state conclusions that cut some corners when it comes to interpreting p-values. And yet, you (and all consumers of statistics!) are expected to recognize what p-values mean. Always.
The real meaning and interpretation of P-values
This is as good of a time as any to make some clarification about the meaning of p-value and the whole inference concept. Fisher indeed came up with the concept of the p-value, but its use as a decision criterion owes to others and Fisher disagreed strongly with use of the p-value in this way (Fisher 1955; Lehmann 1993).
Here are some common p-value corner-cutting statements to avoid using (after Goodman 2008; Held 2010). P-values are sometimes interpreted, incorrectly, as
Table. Incorrect interpretations of NHST p-values
- the probability of obtaining the observed data under the assumption of no real effect
- an observed type-I error rate
- the false discovery rate, ie, the probability that a significant finding is a “false positive”
- the (posterior) probability of the null hypothesis.
So, if p-values don’t mean any of these things, what does a p-value mean? It means that we begin by assuming that there is no effect of our treatments — the p-value is then the chance we will get as large of a result (our test statistic) and the null hypothesis is true. Note that this definition does not include a statement about evidence of the null hypothesis being true. To get evidence of “truth” we need additional tools, like the Bayes Factor and the correction of the p-value to the conditional error probability (see above). Why not dump all of the NHST and go directly to a Bayesian perspective, as some advise? The single best explanation was embedded in the assumption we made about the prior probability in order to calculate the conditional error probability. We assumed the prior probability was 50%. For many, many experiments, that is simply a guess. The truth is we generally don’t know what the prior probability is. Thus, if this assumption is incorrect, then the justification for the formula by Sellke et al (2001) is weakened, and we are no closer to establishing evidence than before.
The take home message is that it is unlikely that a single experiment will provide strong evidence for the truth. Thus the message is repeat your experiments — and you already knew that! And the Bayesians can tell us that with the addition of more and more data reduces the effect of the particular value of the prior probability on our calculation of the conditional error probability. So, that’s the key to this controversy over the p-value.
Reporting p-values
Estimated p-values can never be zero. Students may come to use software that may return p-values like “0” — I’m looking at you Google Sheets re: default results from CHISQ.TEST() — but again, this does not mean the probability of the result is zero. The software simply reports values to two significant figures and failed to round. Some journals may recommend that 0 should be replaced by p < 0.01 or even < 0.05 inequalities, but the former lacks precision and the latter over-emphasizes the 5% Type I error rate threshold, the “statistical significance” of the result. In general, report p-value to three significant figures and four digits. If a p-value is small, use scientific notation and maintain significant digits. Thus, a p-value of 0.004955794 should be reported as 0.00496 and a p-value of 0.0679 should be reported as 0.0679. Use R’s signif() function, for example p-value reported as 6.334e-05, then
signif(6.334e-05,3)
[1] 6.33e-05
Rounding and significant figures were discussed in Chapter 3.5. See Land and Altman (2015) for guidelines on reporting p-values and other statistical results.
Questions
- Revisit Figure 1 again and consider the following hypothesis — the sun will rise tomorrow.
- If we take the Frequentist position, what would the null hypothesis be?
- If we take the Bayesian approach, identify the prior probability.
- Which approach, Bayesian or Frequentist, is a better approach for testing this hypothesis?
- Consider the pediatrician who, upon receiving a chest X-ray for a child notes the left lung has a large irregular opaque area in the lower quadrant. Based on the X-ray and other patient symptoms, the doctor diagnoses pneumonia and prescribes a broad-spectrum antibiotic. Is the doctor behaving as a Frequentist or a Bayesian?
- With the p-value interpretations listed in the table above in hand, select an article from PLoS Biology, or any of your other favorite research journals, and read how the authors report results of significance testing. Compare the precise wording in the results section against the interpretative phrasing in the discussion section. Do the authors fall into any of the p-value corner-cutting traps?
Quiz Chapter 8.2
The controversy over proper hypothesis testing
Chapter 8 contents
- Introduction
- The null and alternative hypotheses
- The controversy over proper hypothesis testing<.span>
- Sampling distribution and hypothesis testing
- Tails of a test
- One sample t-test
- Confidence limits for the estimate of population mean
- References and suggested readings
8 – Inferential statistics
Introduction
Statistical methods are important in biology because results of experiments are usually not clear-cut and therefore tests to support decisions between competing hypotheses are needed.
We will limit ourselves to a general discussion with examples, but beginning in this chapter, we start our introductions of specific types of statistical tests. As a reminder, our statistical philosophy is frequentist and follows the Null Hypothesis Significance Testing or NHST approach. Discussion of Bayesian statistical approaches are included as appropriate.
Thus, all statistical tests we will talk about share the following requirements or properties.
- The type of data we have dictates which test or tests are appropriate.
- We start with a clear description of the null hypotheses.
- (Fig 1, Test H0). See Chapter 8.1.
- Set the Type I error rate, alpha, α (Fig 1, Select Type I error rate).
- By convention, 5% is often used (Cowles and David 1982).
- See also our discussion in Chapter 8.1 and Chapter 8.2.
- We must be aware of the assumptions our statistical tests make and what, if any, modifications to them we can make.
- Assumptions of parametric tests are discussed in Chapter 13.
- Correct computation of the test statistic and degrees of freedom.
- Fig 1, Calculate test statistics and get df.
- Each statistical test results in a test statistic with associated degrees of freedom. These are described in chapters and chapter sections devoted to the different kinds of statistical tests.
- Comparison of the critical value and the test statistic value, with interpretation and significance testing (p-value, Bayesian Factor, cf. discussion in Goodman 2008).
- Fig 1, Test statistic greater than critical value?
- Report result: Fig 1, test statistic value, df, and p-value.
- Interpretation of p-value is done throughout the rest of this book, but in earnest, discussion is presented in Chapter 8.2.
We can provide a flow-chart of these steps (Fig 1).
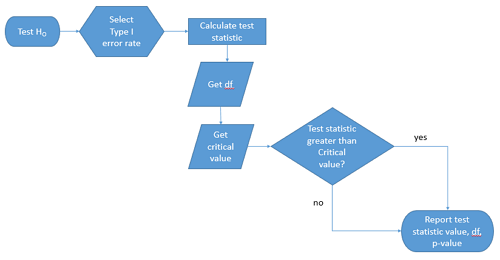
Figure 1. NHST decision flow chart.
While we want to avoid the impression that statistical analysis is simply a matter of following a step-by-step protocol (Fig 1), it nevertheless may be helpful to think of it as such, understanding all the while that there are caveats and assumptions that accompany the choices we make while following the protocol.
Suggested homework
Quizzes in this chapter
A total of 38 questions among the several subchapters, a mix of true or false and multiple choice question format.