15.1 – Kruskal-Wallis and ANOVA by ranks
Introduction
When the data are NOT normally distributed OR When the variances in the different samples are unequal, one option is to opt for a nonparametric alternative use the Kruskal-Wallis test. The test is the same as an ANOVA on ranks. The tests are used to test whether or not groups can be viewed as having come from the same sample distribution. This is a terse page with emphasis on examples.
It is known that the an ANOVA on ranks (in blue) of the original data (in black) will yield the same results.
Kruskal-Wallis
Rcmdr: Statistics → Nonparametric test → Kruskal-Wallis test…
Rcmdr Output of Kruskal-Wallis test
tapply(Pop_data$Stuff, Pop_data$Pop, median, na.rm=TRUE)

Pop1 Pop2 Pop3 Pop4
 146   90  122  347
kruskal.test(Stuff ~ Pop, data=Pop_data)
Kruskal-Wallis rank sum test
data: Stuff by Pop
Kruskal-Wallis chi-squared = 25.6048, df = 3, p-value = 1.154e-05
End of R output
So, we reject — “provisionally, of course! — the null hypothesis, right?
Compare parametric test and alternative non-parametric test
Let’s compare the nonparametric test results to those from an analysis of the ranks (ANOVA of ranks).
To get the ranks in R Commander (example.15.1 data set is available at bottom of this page; scroll down or click here).
Rcmdr: Data → Manage variables in active data set → Compute new variable …
The command for ranks is…. wait for it …. rank(). In the popup menu box, name the new variable (Ranks) and in the Expression to compute box enter rank(Values).
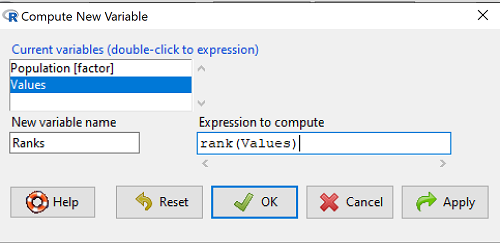
Figure 1. Screenshot Rcmdr menu create new variable.
Note 1: Not a good idea to name an object, Ranks, that’s similar to a function name in R, rank.
And the R code is simply
example.15.1$Ranks <- with(example.15.1, rank(Values))
Note 2: The object example.15.1$Ranks adds our new variable to our data frame.
That’s one option, rank across the entire data set. Another option would be to rank within groups.
R code
example.15.1$xRanks <- ave(Values, Population, FUN=rank)
Note 3: The ave() function averages within subsets of the data and applies whatever summary function (FUN) you choose. In this case we used rank. Alternative approaches could use split or lapply or variations of dplyr. ave() is in the base package and at least in this case is simply to use to solve our rank within groups problem. xRanks would then be added to the existing data frame.
Here are the results of ranking within groups (Table 1).
Table 1. Original and ranked data set.
| Population 1 | Rank1 | Population 2 | Rank2 | Population 3 | Rank3 | Population 4 | Rank4 |
| 105 | 11.5 | 100 | 9 | 130 | 17.5 | 310 | 33 |
| 132 | 19 | 65 | 4 | 95 | 7 | 302 | 32 |
| 156 | 22 | 60 | 2.5 | 100 | 9 | 406 | 38 |
| 198 | 29 | 125 | 16 | 124 | 15 | 325 | 34 |
| 120 | 13.5 | 80 | 5.5 | 120 | 13.5 | 298 | 31 |
| 196 | 28 | 140 | 21 | 180 | 26 | 412 | 39.5 |
| 175 | 24 | 50 | 1 | 80 | 5.5 | 385 | 39.5 |
| 180 | 26 | 180 | 26 | 210 | 30 | 329 | 35 |
| 136 | 20 | 60 | 2.5 | 100 | 9 | 375 | 37 |
| 105 | 115 | 130 | 17.5 | 170 | 23 | 365 | 36 |
Question 1. Which do you choose, rank across groups (Ranks) or rank within groups (xRanks)? Recall that this example began with a nonparametric alternative to the one-way ANOVA, and we were testing the null hypothesis that the group means were the same

Answer 1. Rank the entire data set, ignoring the groups. The null hypothesis here is that there is no difference in median ranks among the groups. Ranking within groups simply shuffles observations within the group. This is basically the same thing as running Kruskal-Wallis test.
Run the one-way ANOVA, now on the Ranked variable. The ANOVA table is summarized Table 2.
Table 2. ANOVA table on ranked variable.
| Source | DF | SS | MS | F | P† |
| Population | 3 | 3495.1 | 1165.0 | 22.94 | < 0.001 |
| Error | 36 | 1828.0 | 50.8 | ||
| Total | 39 | 5323.0 |
Note 4: † The exact p-value returned by R was 0.0000000178. This level of precision is a bit suspect given that calculations of p-values are subject to bias too, like any estimate. Thus, some advocate to report p-values to three significant figures and if less than 0.001, report as shown in this table. Occasionally, you may see P = 0.000 written in a journal article. This is a definite no-no; p-values are estimates of the probability of getting results more extreme then our results and the null hypothesis holds. It’s an estimate, not certainty; p-values cannot equal zero.
So, how do you choose between the parametric ANOVA and the non-parametric Kruskal-Wallis (ANOVA by Ranks) test? Think like a statistician — It is all about the type I error rate and potential bias of a statistical test. The purpose of statistics is to help us separate real effects from random chance differences. If we are employing the NHST approach, then we must consider our chance that we are committing either a Type I error or a Type II error, and conservative tests, eg, tests based on comparing medians and not means, implies an increased chance of committing Type II errors.
Questions
- Saying that nonparametric tests make fewer assumptions about the data should not be interpreted that they make no assumptions about the data. Thinking about our discussions about experimental design and our discussion about test assumptions, what assumptions must hold regardless of the statistical test used?
- Go ahead and carry out the one-way ANOVA on the within group ranks (
xRanks). What’s the p-value from the ANOVA? - One could take the position that only nonparametric alternative tests should be employed in place of parametric tests, in part because they make fewer assumptions about the data. Why is this position unwarranted?
Quiz Chapter 15.1
Kruskal-Wallis and ANOVA by ranks
Data used in this page
Dataset for Kruskal-Wallis test
| Population | Values |
|---|---|
| Pop1 | 105 |
| Pop1 | 132 |
| Pop1 | 156 |
| Pop1 | 198 |
| Pop1 | 120 |
| Pop1 | 196 |
| Pop1 | 175 |
| Pop1 | 180 |
| Pop1 | 136 |
| Pop1 | 105 |
| Pop2 | 100 |
| Pop2 | 65 |
| Pop2 | 60 |
| Pop2 | 125 |
| Pop2 | 80 |
| Pop2 | 140 |
| Pop2 | 50 |
| Pop2 | 180 |
| Pop2 | 60 |
| Pop2 | 130 |
| Pop3 | 130 |
| Pop3 | 95 |
| Pop3 | 100 |
| Pop3 | 124 |
| Pop3 | 120 |
| Pop3 | 180 |
| Pop3 | 80 |
| Pop3 | 210 |
| Pop3 | 100 |
| Pop3 | 170 |
| Pop4 | 310 |
| Pop4 | 302 |
| Pop4 | 406 |
| Pop4 | 325 |
| Pop4 | 298 |
| Pop4 | 412 |
| Pop4 | 385 |
| Pop4 | 329 |
| Pop4 | 375 |
| Pop4 | 365 |
Chapter 15 contents
- Introduction
- Kruskal-Wallis and ANOVA by ranks
- Wilcoxon Rank Sum Test
- Wilcoxon signed rank test
- References and suggested readings
19 – Distribution free statistical methods
Introduction
We introduced the concept of permutation tests in our chapter on parameter estimates and statistical error (Chapter 3.3). Jackknife and bootstrapping are permutation approaches to working with data when the Central Limit theorem is unlikely to apply or, rather, we don’t wish to make that assumption. The jackknife is a sampling method involving repeatedly sampling from the original data set, but each time leaving one value out. The estimator, for example, the sample mean, is calculated for each sample. The repeated estimates from the jackknife approach yield many estimates which, collected, are used to calculate the sample variance. Jackknife estimators tend to be less biased than those from classical asymptotic statistics. Bootstrapping, and not jackknife resampling, is now the preferred permutation approach (add citations).
Bootstrapping
Bootstrapping involves large numbers of permutations of the data, which, in short, means we repeatedly take many samples of our data and recalculate our statistics on these sets of sampled data. We obtain statistical significance by comparing our result from the original data against how often results from our permutations on the resampled data sets exceed the originally observed results. By permutation methods, the goal is to avoid the assumptions made by large-sample statistical inference. Since its introduction, “bootstrapping” has been shown to be superior in many cases for statistics of error compared to the standard, classical approach (add citations).
Permutation vs classical NHST approach
There are many advocates for this approach, and, because we have computers now instead of the hand calculators our statistics ancestors used, permutation methods may be the approach you will take in your own work. However, the classical approach has it’s strengths; when the conditions, that is, when the assumptions of asymptotic statistics are met by the data, then the classical approaches tend to be less conservative than the permutation methods. By conservative, statisticians mean that a test performs at the level we expect it to. Thus, if the assumptions of classical statistics are met they return the correct answer more often than do the permutation tests.
Questions
[pending]
Chapter 19 contents
11.1 – What is Statistical Power?
Introduction
Simply put, the power of a statistical test asks the question: do we have enough data to warrant a scientific conclusion, not just a statistical inference. From the NHST approach to statistics, we define two conditions in our analyses, a null hypothesis, HO, and the alternative hypothesis, HA. By now you should have a working definition of HO and HA (Chapter 8.1). For the two-sided case (Chapter 8.4), HO would be no statistical difference between two sample means, whereas for HA, there was a difference between two sample means. Similarly, for one-sided cases, HO would be one sample mean greater (less) than or equal to the second sample mean, whereas for HA, one sample mean is less (greater) than the second mean. Together, these two hypotheses cover all possible outcomes of our experiment!
However, when conducting an experiment to test the null hypothesis four, not two outcomes are possible with respect to “truth” (Table 1), which we introduced first in our Risk analysis chapter and again when we introduced statistical inference.
Table 1. Possible outcomes of an experiment
| In the population, Ho was really… | |||
| True | False | ||
| Inference: | Fail to reject Ho | Correct decision
p = 1 – α |
Type II error
p = β |
| Reject Ho | Type I error
p = α |
Correct decision
p = 1 – β |
|
We introduced false positives and false negatives in our discussion of risk analysis, and now generalize these concepts to outcomes of any experiment.
(1) We do not reject the null hypothesis, we state that we are 95% (P = 1 – α) confident that we’ve made the correct decision, and in fact, that is the true situation (“correct decision”). As before this is a true positive.
For example, mean acetylsalicylic acid concentration in a sample of 200 mg, brand-name aspirin tablets really is the same as generic aspirin.
(2) We reject the null hypothesis, we state there is a 5% chance that we could be wrong (P = 1 – β), and in fact, that is the true situation (“correct decision”). As before this is a true negative.
For example, ephedrine really does raise heart rates in people who have taken the stimulant compared to those who have taken a placebo.
Two additional possible outcomes to an experiment
The other two possible outcomes are not desirable but may occur because we are making inferences about populations from limited information (we conduct tests on samples) and because of random chance influencing our measure.
(3) We do not reject the null hypothesis, but in fact, there was a true difference between the two groups and we have therefore committed a Type II error. As before this is a false negative.
(4) We reject the null hypothesis, but in fact, there was no actual difference between the two groups and we have therefore committed a Type I error. As before this is a false positive.
What can we do about these two possible undesirable outcomes?
We set our Type I error rate α, and, therefore our Type II error rate β before we conduct any tests, and these error rates cover the possibility that we may incorrectly conclude that the null hypothesis is false (α), or we may incorrectly conclude that the null hypothesis is true (β). When might these events happen?
The power of a statistical test is the probability that the test will reject the null hypothesis when the alternative hypothesis is true.
A type I error is committed, by chance alone, when our sample is accidentally obtained from the tail of the distribution, thus our sample appears to be different from the population… Below, we have a possible case that, by chance alone, we could be getting all of our subjects from one end of the distribution (Fig 1).
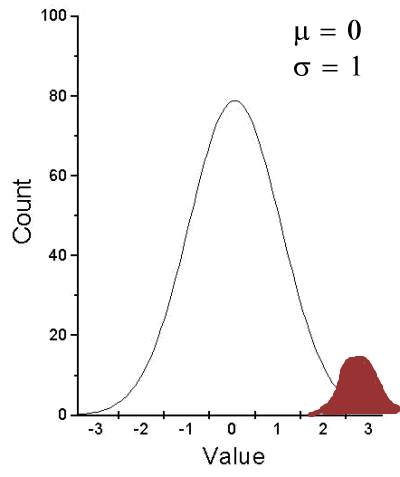
Figure 1. Population sampling from tail of distribution.
We would likely conclude that our sample mean is different (greater) than the population mean.
A type II error is committed, by chance alone, when our sample is between two different population distributions. The implication for our study is drawn in Figure 2. Instead of our sampling drawn from one population, we may have drawn between two very different populations.
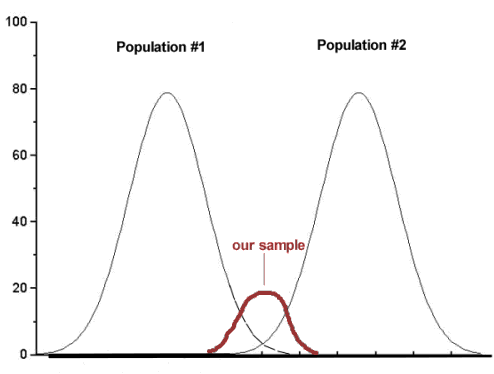
Figure 2. Without us knowing, our sample may come from the extremes of two separate populations.
How did we end up with “the wrong” sample? Recall from our first discussions about Experimental Design how we distinguished between random and haphazard sampling. The key concept was that a program of recruitment of subjects (eg, how to get a sample) must be conducted in such a way that each member of the population has an equal chance of being included in the study. Only then can we be sure that extrinsic factors (things that influence our outcome but are not under our control nor do we study them) are spread over all groups, thus canceling out.
Why do we say we are 95% confident in our estimate (or conclusions)?
(1) Because we can never be 100% certain that by chance alone we haven’t gotten a biased sample (all it takes is a few subjects in some cases to “throw off” our results).
(2) For parametric tests, at least, we assume that we are sampling from a normal population.
Thus, in statistics, we need an additional concept. Not only do we need to know the probability of when we will be wrong (α, β), but we also want to know the probability of when we will be correct when we use a particular statistical test. This latter concept is defined as the power of a test as the probability of correctly rejecting Ho when it is false. Conducting a power analysis before starting the experiment can help answer basic experimental design questions like, how many subjects (experimental units) should my project include? What approximate differences, if any might I expect among the subjects? (Eng 2003; Cohen 1992)
Put another way, power is the likelihood of identifying a significant (important) effect (difference) when one exists. Formally, statistical power is defined as the probability, p = 1 – β, and it is the subject of this chapter.
Questions
- Be able to define and distinguish statistical power and statistical inference.
Quiz Chapter 11.1
What is statistical power
Chapter 11 contents
8.3 – Sampling distribution and hypothesis testing
Introduction
Understanding the relationship between sampling distributions, probability distributions, and hypothesis testing is the crucial concept in the NHST — Null Hypothesis Significance Testing — approach to inferential statistics. is crucial, and many introductory text books are excellent here. I will add some here to their discussion, perhaps with a different approach, but the important points to take from the lecture and text are as follows.
Our motivation in conducting research often culminates in the ability (or inability) to make claims like:
- “Total cholesterol greater than 185 mg/dl increases risk of coronary artery disease.”
- “Average height of US men aged 20 is 70 inches (1.78 m).”
- “Species of amphibians are disappearing at unprecedented rates.”
Lurking beneath these statements of “fact” for populations (just what IS the population for #1, for #2, and for #3?) is the understanding that not ALL members of the population were recorded.
How do we go from our sample to the population we are interested in? Put another way — How good is our sample? We’ve talked about how “biostatistics” can be generalized as sets of procedures you use to make inferences about what’s happening in populations. These procedures include:
- Have an interesting question
- Experimental design (Observational study? Experimental study?)
- Sampling from populations (Random? Haphazard?)
- Hypotheses: HO and HA
- Estimate parameters (characterize the population)
- Tests of hypotheses (inferences)
We have control of each of these — we choose what to study, we design experiments to test our hypotheses…We have already introduced these topics (Chapters 6 – 8).
We also obtain estimates of parameters, and inferential statistics applies to how we report our descriptive statistics (Chapter 3). Estimates of parameters like the sample mean and sample standard deviation can be assessed for accuracy and precision (eg, confidence intervals).
Sampling distribution
Imagine drawing a sample of 30 from a population, calculating the sample mean for a variable (eg, systolic blood pressure), then calculating a second sample mean after drawing a new sample of 30 from the same population. Repeat, accumulating one estimate of the mean, over and over again. What will be the shape of this distribution of sample means? The Central Limit Theorem states that the shape will be a normal distribution, regardless of whether or not the population distribution was normal, as long as the sample size is large (ie, Law of Large Numbers). We alluded to this concept when we introduced discrete and continuous distributions (Chapter 6).
It’s this result from theoretical statistics that allows us to calculate the probability of an event from a sample without actually carrying out repeated sampling or measuring the entire population.
A worked example
To demonstrate the CLT we want R to help us generate many samples from a particular distribution and calculate the same statistic on each sample. We could make a for loop, but the replicate() function provides a simpler framework. We’ll sample from the chi-square distribution. You should extend this example to other distributions on your own, see Question 5 below.
Note 1: This example is much simpler to enter and run code in the script window, modifying code directly as needed. If you wish to try to run this through Rcmdr, you’ll need to take a number of steps, and likely need to modify the code and rerun anyway. Some of the steps in would be Rcmdr: Distributions → Continuous distributions → Chi-squared distribution → Sample from chi-square distribution…, then running Numerical summaries and saving the output to an object (eg, out), extracting the values from the object (eg, out$Table, confirm by running command str(out)— str() is an R utility to display the structure of an object), then testing the object for normality Rcmdr: Statistics → Test of normality, select Shapiro-Wilk, etc.. In other words, sometimes a GUI is a good idea, but in many cases, work with the script!
Generate x replicate samples (eg, x = 10, 100, 1000, one million) of 30 each from chi-square distribution with one degree of freedom, test the distribution against null hypothesis (assume normal distributed, eg, Shapiro-Wilk test, see Chapter 13.3), then make a histogram (Chapter 4.2), like Figure 1 or Figure 2.
x.10 <- replicate(10, {
my.mean <- rchisq(30, 1)
mean(my.mean)
})

normalityTest(~x.10, test="shapiro.test")
hist(x.10, col="orange")
Result from R
Shapiro-Wilk normality test

data: x.10
W = 0.87016, p-value = 0.1004
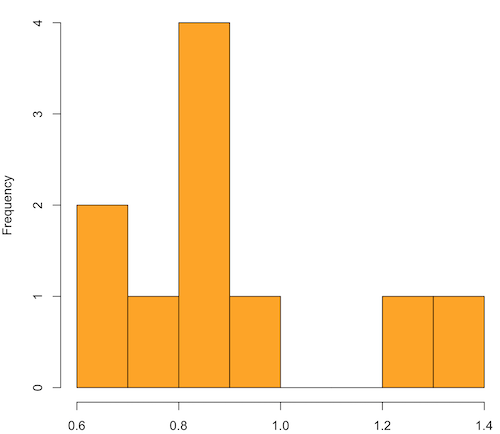
Figure 1. means of ten replicate samples drawn at random from chi-square distribution, df = 1.
Modify the code to draw 100 samples, we get Fig 2.
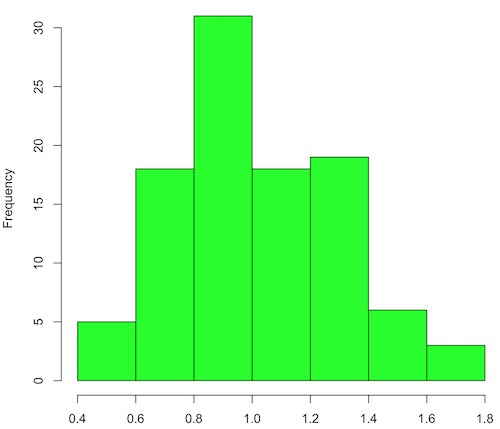
Figure 2. means of 100 replicate samples drawn at random from chi-square distribution, df = 1. Results from Shapiro-Wilks test: W = 0.97426, p-value = 0.04721.
And finally, modify the code to draw one million samples, we get Figure 3.
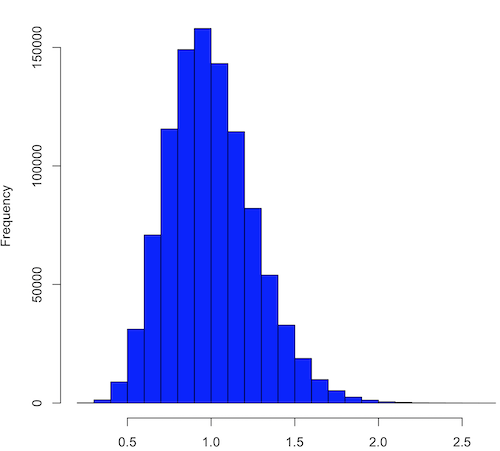
Figure 3. means of one million replicate samples drawn at random from chi-square distribution, df = 1. Normality test will fail to run, sample size of 5000 limit.
How to apply sampling distribution to hypothesis testing
First, a reminder of some definitions.
Estimate = we will always (almost) concern ourselves with how good our sample mean (such values are called estimates) is relative to the population mean, the thing we really want, but can only hope to get an estimate of.
Accuracy = how close to the true value is our measure?
Precision = how repeatable is our measure?
How can we tell if we have a good estimate? We want an estimate with an evaluation for accuracy and for precision. The sampling error provides an assessment of precision, whereas the confidence interval provides a statement of accuracy. We need an estimate of the sampling error for the statistic,
Sample standard error of the mean
We introduced sample error of the mean in section 3.4 of Chapter 3. Everything we measure can have a corresponding statement about how accurate (sampling error) is our estimate! First, we begin by asking, “how accurate is the mean that we estimate from a sample of a population?” How do we answer this? We could prove it in the mathematical sense of proof (and people have and do) OR we can use the computer to help. We’ll try this approach in a minute.
What we will show relates to the standard error of the population mean (SEM) or

, whose equation is shown below.

or equivalently, from the standard deviation we have
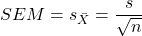
Note that the SEM takes the variance and divides through by the sample size. In general, then, the larger the sample size, the smaller the “error” around the mean. As we work through the different statistical tests, t-tests, analysis of variance, and related, you will notice that the test statistic is calculated as a ratio between a difference or comparison divided by some form of an error measurement. This is to remind you that “everything is variable.”
A note on standard deviation (SD) and standard error of the mean (SEM): SD estimates the variability of a sample of Xi‘s whereas SEM estimates the variability of a sample of means.
Let’s return to our thought problem and see how to demonstrate a solution. First, what is the population? Second, can we get the true population mean?
One way, a direct (but impossible?) approach would be to measure it — get all of the individuals in a population and measure them, then calculate the population mean. Then, we could compare our original sample mean against the true mean and see how close it was. This can be accomplished in some limited cases. For example, the USA conducts a census of her population every ten years, a procedure which costs billions of dollars. We can then compare samples from the different states or counties to the USA mean. And these statistics are indeed available via the census.gov website. But even the census uses sampling — individuals are randomly selected to answer more questions and from this sample trends in the population are inferred.
So, sampling from populations is the way to go for most questions we will encounter. The procedures we will use to show how a sample mean relates to the population mean are general and may be used to show how any estimate of a variable (sample mean and sample standard deviation, etc.), relates to properties of a parameter. We’ll get to the other issues, but for now, think about sample size.
Sampling from populations is necessary and inevitable, and, to a certain extent, under your control. But how many individuals do we need? The quick answer is for me to direct your attention to the equation for the SEM. Can you see in that ratio the secret to obtaining more precise estimates? There are many ways to approach this question, but let’s use the tools from last time, those based on properties of a normal distribution.
If we can view the sampling as having come from a population at least approximately normally distributed for our variable, then we can now examine empirically the effect of different sample sizes on the estimate of the mean.
A hint: variability is important!
From one population we obtain two samples, A and B. Sample sizes are
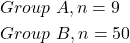
Assume for now that we know the true mean (μ) and standard deviation (σ) for the population. Note. This is one of the points of why we use computer simulation so much to teach statistics — it allows us to specify what the truth is, then see how our statistical tools work or how our assumptions affect our statistically based conclusions.
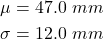
Confidence intervals
Reliability is another word for precision. We define a confidence interval as a statistic to report the reliability of our estimated statistic. We introduced confidence interval in Chapter 3.4. At least in principle, confidence intervals can be calculated for all statistics (mean, variance, etc.,) and for all data types. Confidence intervals define a lower limit, L, and an upper limit, U, and that you are making a statement that you are “95% certain that the true value (parameter value) is between these two limits.
We previously reported how to calculate an approximate confidence intervals for proportions and for NNT; simply multiple standard error estimate by 2. Here we introduce an improved approximate calculation of the 95% confidence interval for the sample mean

where Z is something you would look up from the table of the normal distribution. For a 95% confidence interval, 100% – 95% = 5% and divide 5% by two: the lower limit corresponds to 2.5% and the upper limit corresponds to 2.5% on our normal distribution. We look up the table and we find that Z for 0.025 is 1.96 and that is the value we would plug into our equation above. For large sample sizes, you can get a pretty decent estimate of the confidence interval by replacing 1.96 with “2.”
Questions
1. What is the probability of having a sample mean greater than 50 (mean > 50) for a sample of n = 9 ?
We’ll use a slight modification of the Z-score equation we introduced in Chapter 6.6 — the modification here is that previously we referred to the distribution of Xi‘s and how likely a particular observation would be. Instead, we can use the Z score with the standard normal distribution (aka Z-distribution), approach to solving how likely an estimated sample mean is given the population parameters μ and σ. Recall the Z score

We have everything we need except the SEM, which we can calculate by dividing the standard deviation by squared root of sample size.
For

, σ = 12.0 (given above), and μ = 47, n = 9, plug in the values:
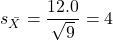
Therefore, after applying the equation for Z score,  . This corresponds to how far away from the standard mean of zero.
Look up from the table of normal distribution. The answer is  , which corresponds to that
 is EQUAL to or GREATER than 0.75, which is what we wanted. Translated, this implies that, given the level of variability in the sample, 22.66% of your sample means would be greater than 50! We write:
 .
Some care needs to be taken when reading these tables — make sure you understand how the direction (less than, greater than) away from the mean is tabulated.
2. Instead of greater, how would you get the probability less than 50?
Total area under the curve is 1 (100%), so subtract  .
I recommend that you do these by hand first, then check your answers. You’ll need to be able to do this for exams.
Here’s how to use Rcmdr to do these kind of problems.
Rcmdr: Distributions → Continuous distributions → Normal distribution → Normal probabilities …
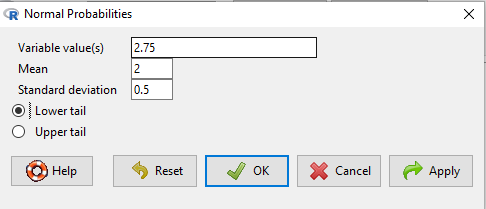
Figure 5. Screenshot Rcmdr menu to get normal probability.
Here’s the answer from Rcmdr
pnorm(c(50), mean=47, sd=12, lower.tail=TRUE)

[1] 0.5987063
3. Now, try a larger sample size. For  , what is the probability of having a sample mean greater than 50 (
 )?
, μ = 47, σ = 12, n = 50 and

Therefore, after applying the equation for Z score,  . Look up (Normal table, subtract answer from 1) and we get
 .
Or 3.84% of your sample means would be greater than 50! We write:  .
Said another way: If you have a sample size of 50 () and you obtain a mean greater than 50 then there is only a 3.84% chance that the TRUE MEAN IS 47.
4. What happens if the variability is smaller? Chance σ from 12 to 6 then repeat questions 1 and 4.
5. Repeat the demonstration of Central Limit Theorem and Law of Large Numbers for discrete distributions
- binomial distribution. Replace
rchisq()withrbinom(n, size, prob)in thereplicate()function example. See Chapter 6.5 - poisson distribution. Replace
rchisq()withrpois(n, lambda)in thereplicate()function example. See Chapter 6.5
Quiz Chapter 8.3
Sampling distribution and hypothesis testing
Chapter 8 contents
- Introduction
- The null and alternative hypotheses
- The controversy over proper hypothesis testing
- Sampling distribution and hypothesis testing
- Tails of a test
- One sample t-test
- Confidence limits for the estimate of population mean
- References and suggested readings
8.2 – The controversy over proper hypothesis testing
Introduction
Over the next several chapters we will introduce and develop an approach to statistical inference, which has been given the title “Null Hypothesis Significance Testing” or NHST.
In outline, NHST proceeds with
- statements of two hypotheses, a null hypothesis, HO, and an alternative hypothesis, HA
- calculate a test statistic comparison of the null hypothesis (assuming some characteristic of data).
- The value of the test statistic is to be compared to a critical value for the test, identified for the assumed probability distribution at associated degrees of freedom for the statistical function, and assigned Type I error rate.
We will expand on these statements later in this chapter, so stay with me here. Basically, the null hypothesis is often a statement like the responses of subjects from the treatment and control groups are the same, eg, no treatment effect. Note that the alternative hypothesis, eg, hypertensive patients receiving hydalazine for six weeks have lower systolic blood pressure than patients receiving a placebo (Campbell et al 2011), would be the scientific hypothesis we are most interested in. But in the Frequentist NHST approach we test the null hypothesis, not the alternative hypothesis. This framework over proper hypothesis testing is the basis of the Bayesian vs Frequentist controversy.
Consider the independent sample t-test (see Chapter 8.5 and 8.6), our first example of a parametric test.

After plugging in the sample means and the standard error for the difference between the means, we calculate t, the test statistic of the t-test. The critical value is treated as a cut-off value in the NHST approach. We have to set our Type I error rate before we start the experiment, and we have available the degrees of freedom for the test, which follows from the sample size. With these in hand, the critical value is found by looking in the t-table of probabilities (or better, use R).
For example, what is the critical value of t-test with 10 degrees of freedom and Type I error of 5%?
In Rcmdr, choose Distributions → Continuous distributions → t distribution → t quantiles… (Fig 1).
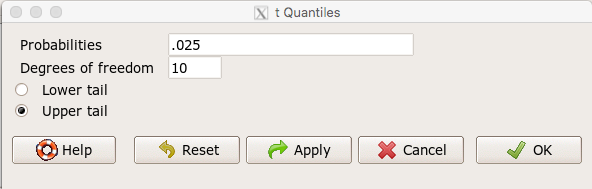
Figure 1. Screenshot t-quantiles Rcmdr menu.
Note we want Type I equal to 5%. Since there are two tails for our test, we divide 5% by two and enter 0.025 and select the Upper tail.
R output
> qt(c(.025), df=10, lower.tail=FALSE)
[1] 2.228139
which is the same thing we would get if we look up on the t-distribution table (Fig 2).
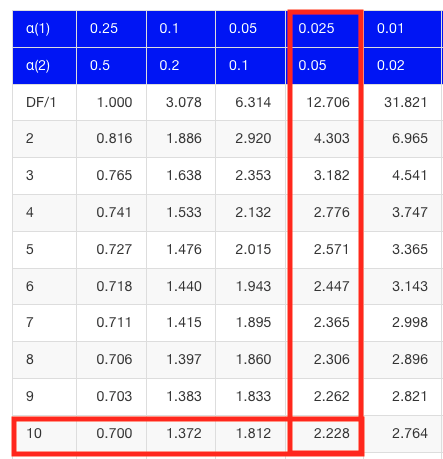
Figure 2. Screenshot of portion of t-table with highlighted (red) critical value for 10 degrees of freedom.
If the test statistic is greater than the critical value, then the conclusion is that the null hypothesis is to be provisionally rejected. We would like to conclude that the alternative hypothesis should favored as best description of the results. However, we cannot — the p-value simply tells us how likely our results would be obtained and if the null hypothesis was true. Confusingly, however, you cannot interpret the p-value as telling you the probability (how likely) that the null hypothesis is true. If however the test statistic is less than the critical value, then the conclusion is that the null hypothesis is to be provisionally accepted.
The test statistic can be assigned a probability or p-value. This p-value is judged to be large or small relative to an a priori error probability level cut off called the Type I error rate. Thus, NHST as presented in this way may be thought of as a decision path — if the test statistic is greater than the critical value, which will necessarily mean that the p value is less than the Type I error rate, then we make one type of conclusion (reject HO). In contrast, if the test statistic is less than the critical value, which will mean that the p-value associated with the test statistic will be greater than the Type I error rate, then we conclude something else about the null hypothesis. The various terms used in this description of NHST were defined in Chapter 8.3.
Sounds confusing, but, you say, OK, what exactly is the controversy? The controversy has to do whether the probability or p-value can be interpreted as evidence for a hypothesis. In one sense, the smaller the p-value, the stronger the case to reject the null hypothesis, right? However, just because the p-value is small — the event is rare — how much evidence do we have that the null hypothesis is true? Not necessarily, and so we can only conclude that the p-value is one part of what we may need for evidence for or against a hypothesis (hint: part of the solution is to consider effect size — introduced in Chapter 9.2 — and the statistical power of the test, see Ch 11). What follows was covered by Goodman (1988) and others. Here’s the problem. Consider tossing a fair coin ten times, with the resulting trial yielding nine out of ten heads (eg, a value of one, with tails equal to zero).
R code
set.seed(938291156)
rbinom(10,1,0.5)
[1] 1 1 1 1 1 1 0 1 1 1
Note 1: To get this result I repeated rbinom() a few times until I saw this rare result. I then used the command get_seed() from mlr3misc package to retrieve current seed of R’s random number generator. Initialize the random seed with the command set.seed().
While rare (binomial probability 0.0098), do we take this as evidence that the coin is not fair? By itself, the p-value provides no information about the alternative hypothesis. More about p-value follows below in sections What’s wrong with the p-value from NHST? and The real meaning and interpretation of P-values.
Statisticians have been aware of limitations of the NHST approach for years (see editorial by Wasserstein et al 2019), but only now is the message getting attention of researchers in the biosciences and other fields. In fact, the New York Times recently had a nice piece by F.D. Flam (“The Odds, Continually Updated,” 29 Sep 2014) on the controversy and the Bayesian alternative. Like most controversies there are strong voices on either side, and it can be difficult as an outsider to know which position to side with (Fig 3).
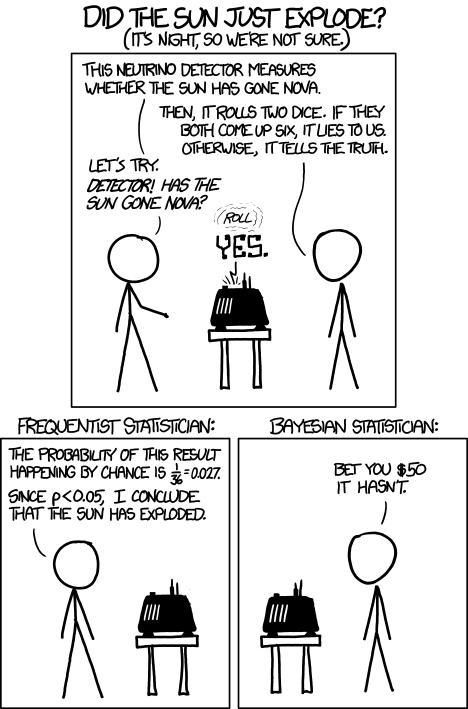
Figure 3. “Frequentists vs. Bayesians,” https://xkcd.com/1132/.
The short answer is — as you go forward do realize that there is a limitation to the frequentist approach and to be on the correct side of the controversy, you need to understand what you can conclude from statistical results. NHST is by far the most commonly used approached in biosciences (eg, out of 49 research articles I checked from four randomly selected issues of 2015 PLoS Biology, 43 used NHST, 2 used a likelihood approach, none used Bayesian statistics). The NHST is also the overwhelming manner in which we teach introductory statistics courses (eg, checking out the various MOOC courses at www.coursera.org, all of the courses related to Basic Statistics or Inferential Statistics are taught primarily from the NHST perspective). However, right from the start I want to emphasize the limits of the NHST approach.
If the purpose of science is to increase knowledge, then the NHST approach by itself is an inadequate framework at best, and in the eyes of some, worthless! Now, I think this latter sentiment is way over the top, but there is a need for us to stop before we begin, in effect, to set the ground rules for what can be interpreted from the NHST approach. The critics of NHST have a very important point, and that needs to be emphasized, but we will also defend use and teaching of this approach so that you are not left with the feeling that somehow this is a waste of time or that you are being cheated from learning the latest knowledge on the subject of statistical inference. The controversy hinges on what probability means.
P-values, statistical power, and replicability of research findings
Science, as a way of knowing how the world works, is the only approach that humans have developed that has been empirically demonstrated to work. Note how I narrowed what science is good for — if we are asking questions about the material world, then science should be your toolkit. Some (eg, Platt 1964), may further argue that there are disciplines in science that have been more successful (eg, molecular biology) than others (eg, evolutionary psychology, cf discussion in Ryle 2006) at advancing our knowledge about the material world. However, to the extent research findings are based solely on statistical results there is reason to believe that many studies in fact have not recovered truth (Ioannidis 2005).
In a review of genomics, it was reported that findings of gene expression differences by many microarray studies were not reproducible (Allison et al 2006). The consensus is that confidence in the findings should hold only for the most abundant gene transcripts of many microarray gene expression profiling studies, a conclusion that undercuts the perceived power of the technology to discover new causes of disease and the basis for individual differences for complex phenotypes. Note that when we write about failure of research reproducibility we are not including cases of alleged fraud (Carlson 2012 on Duke University oncogenomics case), we are instead highlighting that these kinds of studies often lack statistical power; hence, when repeated, the experiments yield different results.
Frequentist and Bayesian Probabilities
Turns out there is a lot of philosophical problems around the idea of “probability,” and three schools of thought. In the Fisherian approach to testing, the researcher devises a null hypothesis, HO, collects the data, then computes a probability (p-value) of the result or outcome of the experiment. If the p-value is small, then this is inferred as little evidence in support of the null hypothesis.
In the Frequentists’ approach, the one we are calling NHST, the researcher devises two hypotheses, the null hypothesis, HO, and an alternative hypothesis, HA. The results are collected from the experiment and, prior to testing, a Type I error rate (α, chance) is defined. The Type I error rate is set to some probability and refers to the chance of rejecting the null hypothesis purely due to random chance. The Frequentist then computes a p-value of result of the experiment and applies a decision criterion: If P-value greater than Type I error rate, then provisionally accept null hypothesis. In both the Fisherian and Frequentist approaches, the probability, again defined at the relative frequency of an event over time, is viewed as a physical, objective and well-defined set of values.
Bayesian approach: based on Bayes conditional probability, one identifies the prior (subjective) probability of an hypothesis, then, adjusts the prior probability (down or up) as new results come in. The adjusted probability is known as posterior probability and it is equal to the likelihood function for the problem. The posterior probability is related to the prior probability and this function can be summarized by the Bayes factor as evidence the evidence against the null hypothesis. And that’s what we want, a metric of our evidence for or against the null hypothesis.
Note 2: A probability distribution function (PDF) is a function of the sample data and returns how likely that particular point will occur in the sample. The distribution is given. The likelihood function approaches this from a different direction. The likelihood function takes the data set as a given and represents how likely are the different parameters for your distribution.
We can calibrate the Bayesian probability to the frequentist p-value (Selke et al 2001; Goodman 2008; Held 2010; Greenland and Poole 2012). Methods to achieve this calibration vary, but the Fagan nomogram Held (2010) proposed is a good tool for us as we go forward. We can calculate our NHST p-value, but then convert the p-value to a Bayes factor by looking at the nomogram. I mention this here not as part of your to do list, but rather as a way past the controversy: the NHST p-value can be interpreted as a Bayesian conditional probability, but they do not test the same hypothesis.
Likelihood
Before we move on there is one more concept to introduce, that of likelihood. We describe a model (an equation) we believe can generate the data we observe. By constructing different models with different parameters (hypotheses), you generate a statistic that yields a likelihood value. If the model fits the data, then the likelihood function has a small value. The basic idea then is to compare related, but different models to see which fits the data better. We will use this approach when comparing linear models when we introduce multiple regression models in Chapter 18.
What’s wrong with the p-value from NHST?
Well, really nothing is “wrong” with the p-value.
Where we tend to get into trouble with the p-value concept is when we try and interpret it. See below, Why is this important to me as a beginning student? The p-value is not evidence for a position, it is a statement about error rates. The p-value from NHST can be viewed as the culmination of a process that is intended to minimize the chance that the statistician makes an error.
In Bayesian terms, the p-value from NHST is the probability that we observe the data (eg, the differences between two sample means), assuming the null hypothesis is true. If we want to interpret the p-value in terms of evidence for a proposition, then we want the conditional error probability.
Sellke et al (2001) provided a calibration of p-values and, assuming that the prior probabilities of the null hypothesis and the alternative hypothesis are equal (that is, that each have a prior probability of 0.5), by using a formula provided by them (equation 3), we can correct our NHST p-value into a probability that can be interpreted as evidence in favor of the interpretation that the null hypothesis is true. In Bayesian terms this is called the posterior probability of the null hypothesis. The formula is

where e is Euler’s number, the base of the natural logarithm (ln), and p is the p-value from the NHST. This calibration works as long as  (Sellke et al 2001).
By convention we set the Type I error at 5% (cf Cohen 1994). How strong of evidence is a p-value near 5% against the null hypothesis being true, again, under the assumption that the prior probability of the null hypothesis being true is 50%? Using the above formula I constructed a plot of the calculated conditional error probability values against p-values (Fig 4).
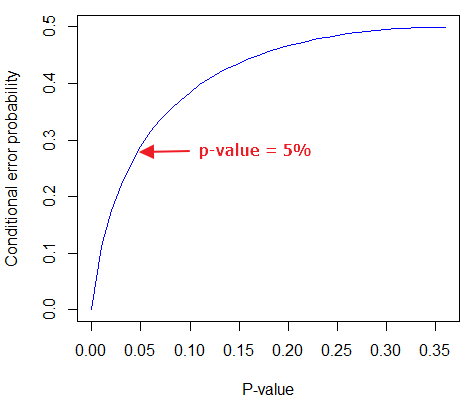
Figure 4. Conditional error probability values plotted against p-values.
As you can see, a p-value of 5% is not strong evidence at just 0.289. Not until p-values are smaller than 0.004 does the conditional error probability value dip below 0.05, suggesting strong evidence against the null hypothesis being true.
R note: For those of you keeping up with the R work, here’s the code for generating this plot. Text after “#” are comments and are not interpreted by R.
At the R prompt type each line
NHSTp = seq(0.00001,0.37,by=0.01)      #create a sequence of numbers between 0.0001 and 0.37 with a step of 0.01
CEP = (1+(-1*exp(1)*NHSTp*log(NHSTp))^-1)^-1    #equation 3 from Sellke et al 2001
plot(NHSTp,CEP,xlab="P-value", ylab="Conditional error probability",type="l",col="blue")
Why is this important to me as a beginning student?
As we go forward I will be making statements about p-values and Type I error rates and null hypotheses and even such things as false positives and false negative. We need to start to grapple with what exactly can be said by p-values in the context of statistical inference, and to recognize that we will sometimes state conclusions that cut some corners when it comes to interpreting p-values. And yet, you (and all consumers of statistics!) are expected to recognize what p-values mean. Always.
The real meaning and interpretation of P-values
This is as good of a time as any to make some clarification about the meaning of p-value and the whole inference concept. Fisher indeed came up with the concept of the p-value, but its use as a decision criterion owes to others and Fisher disagreed strongly with use of the p-value in this way (Fisher 1955; Lehmann 1993).
Here are some common p-value corner-cutting statements to avoid using (after Goodman 2008; Held 2010). P-values are sometimes interpreted, incorrectly, as
Table. Incorrect interpretations of NHST p-values
- the probability of obtaining the observed data under the assumption of no real effect
- an observed type-I error rate
- the false discovery rate, ie, the probability that a significant finding is a “false positive”
- the (posterior) probability of the null hypothesis.
So, if p-values don’t mean any of these things, what does a p-value mean? It means that we begin by assuming that there is no effect of our treatments — the p-value is then the chance we will get as large of a result (our test statistic) and the null hypothesis is true. Note that this definition does not include a statement about evidence of the null hypothesis being true. To get evidence of “truth” we need additional tools, like the Bayes Factor and the correction of the p-value to the conditional error probability (see above). Why not dump all of the NHST and go directly to a Bayesian perspective, as some advise? The single best explanation was embedded in the assumption we made about the prior probability in order to calculate the conditional error probability. We assumed the prior probability was 50%. For many, many experiments, that is simply a guess. The truth is we generally don’t know what the prior probability is. Thus, if this assumption is incorrect, then the justification for the formula by Sellke et al (2001) is weakened, and we are no closer to establishing evidence than before.
The take home message is that it is unlikely that a single experiment will provide strong evidence for the truth. Thus the message is repeat your experiments — and you already knew that! And the Bayesians can tell us that with the addition of more and more data reduces the effect of the particular value of the prior probability on our calculation of the conditional error probability. So, that’s the key to this controversy over the p-value.
Reporting p-values
Estimated p-values can never be zero. Students may come to use software that may return p-values like “0” — I’m looking at you Google Sheets re: default results from CHISQ.TEST() — but again, this does not mean the probability of the result is zero. The software simply reports values to two significant figures and failed to round. Some journals may recommend that 0 should be replaced by p < 0.01 or even < 0.05 inequalities, but the former lacks precision and the latter over-emphasizes the 5% Type I error rate threshold, the “statistical significance” of the result. In general, report p-value to three significant figures and four digits. If a p-value is small, use scientific notation and maintain significant digits. Thus, a p-value of 0.004955794 should be reported as 0.00496 and a p-value of 0.0679 should be reported as 0.0679. Use R’s signif() function, for example p-value reported as 6.334e-05, then
signif(6.334e-05,3)
[1] 6.33e-05
Rounding and significant figures were discussed in Chapter 3.5. See Land and Altman (2015) for guidelines on reporting p-values and other statistical results.
Questions
- Revisit Figure 1 again and consider the following hypothesis — the sun will rise tomorrow.
- If we take the Frequentist position, what would the null hypothesis be?
- If we take the Bayesian approach, identify the prior probability.
- Which approach, Bayesian or Frequentist, is a better approach for testing this hypothesis?
- Consider the pediatrician who, upon receiving a chest X-ray for a child notes the left lung has a large irregular opaque area in the lower quadrant. Based on the X-ray and other patient symptoms, the doctor diagnoses pneumonia and prescribes a broad-spectrum antibiotic. Is the doctor behaving as a Frequentist or a Bayesian?
- With the p-value interpretations listed in the table above in hand, select an article from PLoS Biology, or any of your other favorite research journals, and read how the authors report results of significance testing. Compare the precise wording in the results section against the interpretative phrasing in the discussion section. Do the authors fall into any of the p-value corner-cutting traps?
Quiz Chapter 8.2
The controversy over proper hypothesis testing
Chapter 8 contents
- Introduction
- The null and alternative hypotheses
- The controversy over proper hypothesis testing<.span>
- Sampling distribution and hypothesis testing
- Tails of a test
- One sample t-test
- Confidence limits for the estimate of population mean
- References and suggested readings
6.11 – F distribution
Introduction
The F distribution is the probability distribution associated with the F statistic and named in honor of R. A. Fisher. The F distribution is used as the null distribution of the ANOVA test statistic. The F distribution is the ratio of two chi-square distributions, with degrees of freedom v1 and v2 for numerator and denominator, respectively.
Note 1: George W. Snedecor named the F-distribution after Sir Ronald Fisher in honor of his work on variance ratio. Fisher first developed the concept of the variance ratio in the 1920s, calling it the “general z-distribution”.
We can for illustration purposes define the F statistic as a ratio of two variances,

Note 2: We test the ratio of variances to infer the difference between means because a large ratio suggests the variation between groups is much greater than the variation within groups. This comparison, key to Analysis of Variance (ANOVA), allows us to decide if the group means are different beyond random chance.
The F statistic has two sets of degrees of freedom, one for the numerator and one for the denominator. The actual formula for the F distribution is quite complicated and in general we don’t use the F distribution in a way that involves parameter estimation. Rather, it is used in evaluating the statistical significance of the F statistic. Therefore, we produce but a few graphs and a table of critical values to illustrate the distribution.
We call the result of this calculation the F test statistic. We evaluate how often that value or greater of a test statistic will occur by applying the F distribution function. A few graphs to get a sense of what the distribution looks like for varying v1, v2 held to ten degrees of freedom (Fig 1).
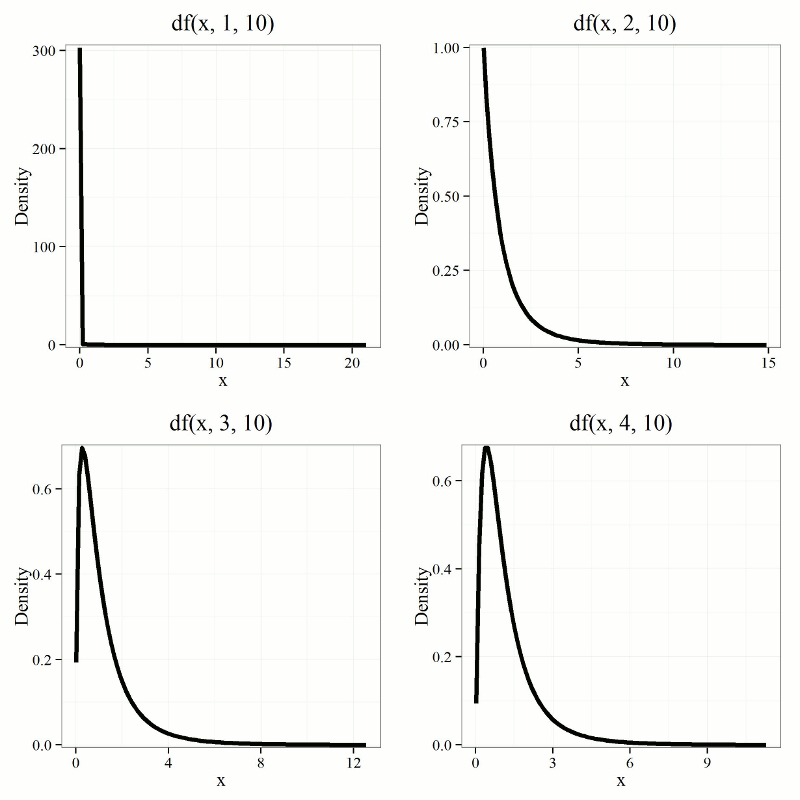
Figure 1. Animated GIF plot of F distribution value for range of degrees of freedom.
By convention in the Null Hypothesis Significance Testing protocol (NHST), we compare the test statistic to a critical value. The critical value is defined as the value of the test statistic that occurs at the Type I error rate, which is typically set to 5%., per our presentations in Chapter 6.7, 6.9, and 6.10. The justification for NHST approach to testing of statistical significance is developed in Chapter 8.
Table of Critical values of the F distribution, one tail (upper)
Degrees of freedom v1 = 1 – 4, v2 = 10
| Fv1, 10 | α = 0.05 | α = 0.025 | α = 0.01 |
| 1 | 4.964 | 6.937 | 10.044 |
| 2 | 4.103 | 5.456 | 7.559 |
| 3 | 3.708 | 4.826 | 6.552 |
| 4 | 3.478 | 4.468 | 5.994 |
For the complete F table see Appendix 20.4
χ2, t and F distributions are related
χ2, t and F distributions are all distributions indexed by their degrees of freedom. With some algebra, these three distributions can be shown to be related to each other. The probabilities tabled in the chi-squared are part of the F-distribution.
Some interesting relationships between the F distribution and other distributions can be shown. By definition we claimed that the F distribution is built on ratio of chi-square distributions, so that should indicate to you the relationship between the two kinds of continuous probability distributions. However, one can also show relationships to other distributions for the F distribution. For example, for the case of v1 = 1 and v2 = any value, then F1,v2 = t2, where t refers to the t distribution.
Questions
- What happens to the shape of the F distribution as df1 is held constant, but df2 degrees of freedom are increased from 1 to 5 to 20 to 100?
- What happens to the shape of the F distribution as df1 degrees of freedom are increased from 1 to 5 to 20 to 100 while df2 is held constant?
Be able to answer these questions using the F table, Appendix 20.4, or using R/Rcmdr
- For probability α = 5%, and numerator degrees of freedom equal to 1, what is the critical value of the F distribution (upper tail) for 5 degree of freedom? For 20 df? For 30 df?
Quiz Chapter 6.11
F distribution
Chapter 6 contents
- Introduction
- Some preliminaries
- Ratios and proportions
- Combinations and permutations
- Types of probability
- Discrete probability distributions
- Continuous distributions
- Normal distribution and the normal deviate (Z)
- Moments
- Chi-square distribution
- t distribution
- F distribution
- References and suggested readings
6.9 – Chi-square distribution
Introduction
As noted earlier, the normal deviate or Z score can be viewed as randomly sampled from the standard normal distribution. The chi-square distribution describes the probability distribution of the squared standardized normal deviates with degrees of freedom, df, equal to the number of samples taken. (The number of independent pieces of information needed to calculate the estimate, see Ch. 8.) We will use the chi-square distribution to test statistical significance of categorical variables in goodness of fit tests and contingency table problems.
The equation of the chi-square is
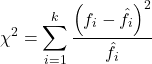
where k is the number of groups or categories, from 1 to k, and fi is the observed frequency and fi “hat” is the expected frequency for the kth category. We call the result of this calculation the chi-square test statistic. We evaluate how often that value or greater of a test statistic will occur by applying the chi-square distribution function. Graphs to show chi-square distribution for degrees of freedom equal to 1 – 5, 10, and 20 (Fig 1).
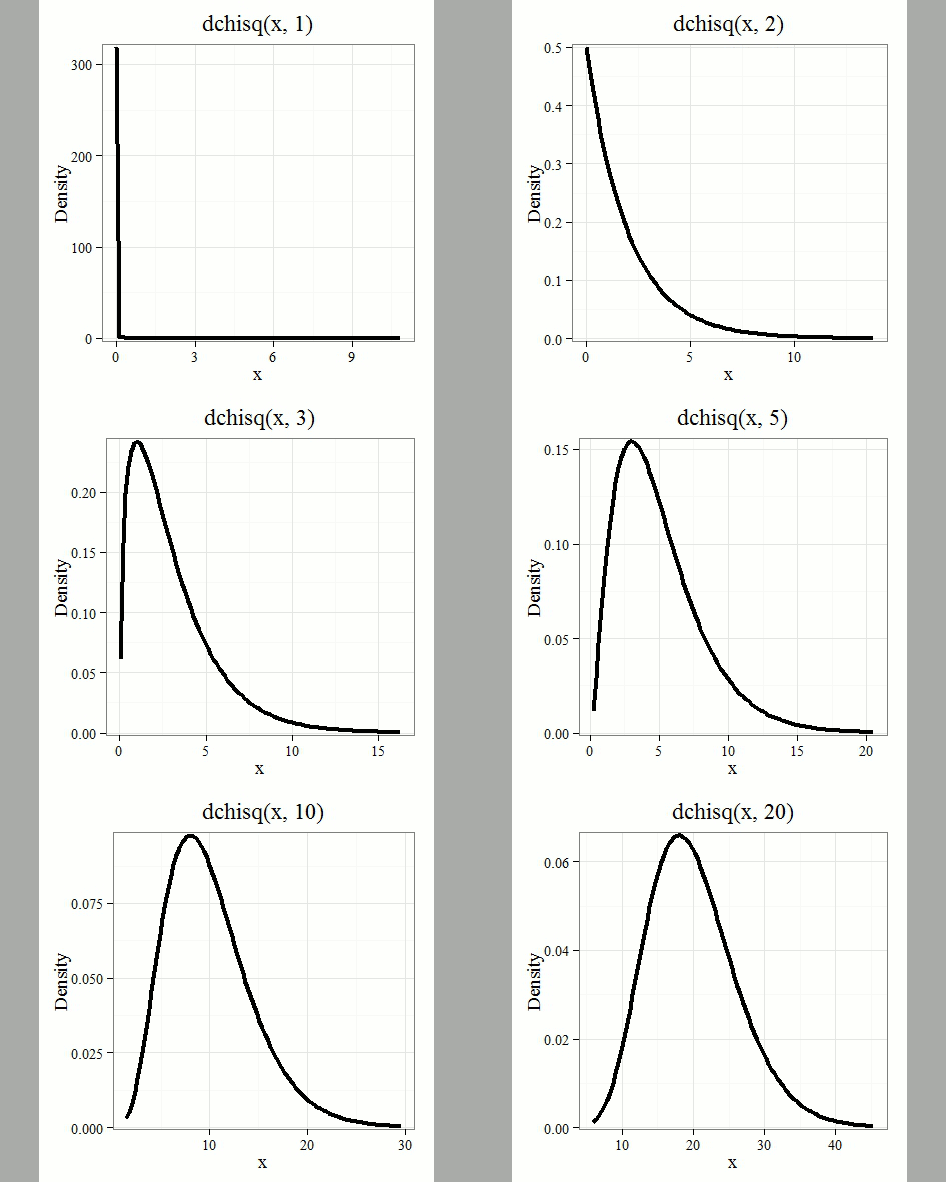
Figure 1. Animated GIF of plots of chi-square distribution over range of degrees of freedom.
Note that the distribution is asymmetric, particularly at low degrees of freedom. Thus tests using the chi-square are one-tailed (Fig 2).
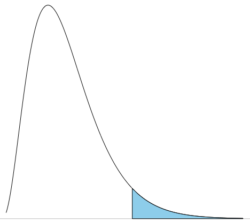
Figure 2. The test of the chi-square is typically one-tailed. In this case, probability of values greater than the critical value.
By convention in the Null Hypothesis Significance Testing protocol (NHST), we compare the test statistic to a critical value. The critical value is defined as the value of the test statistic — the cutoff boundary between statistical significance and insignificance — that occurs at the Type I error rate, which is typically set to 5%. The interpretation of the result is as follows: after calculating a test statistic, we can judge significance of the results relative to the null hypothesis expectation. If our test statistics is greater than the critical value, then the p-value of our results are less than 5% (R will report an exact p-value for the test statistic). You are not expected to be able to follow this logic just yet — rather, we teach it now as a sort of mechanical understanding to develop in the NHST tradition. The justification for this approach to testing of statistical significance is developed in Chapter 8. A portion of the critical values of the chi-square distribution are shown in Figure 3.
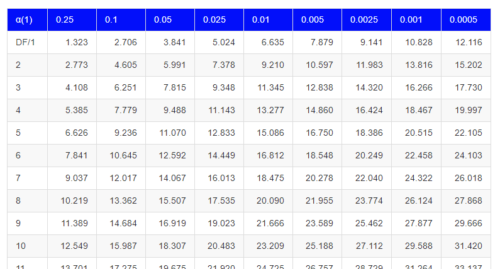
Figure 3. Portion of the table of some critical values of chi-square distribution, one tailed (right-tailed or “upper” portion of distribution).
See Appendix for a complete chi-square table.
The chi-squared test is a one-tailed test.
The result of the calculation of the test statistic is always non-negative because it is calculated by squaring the differences between the observed and expected frequencies. As a consequence, the test is always “right-tailed.”
The chi-square test does not provide information about the direction of an association, nor the strength of the association, only whether or not the variables are independent or associated. We use “correlation,” (eg, Phi coefficient or Cramer’s V, see Chapter 9.1 – Chi-square test: Goodness of fit and Chapter 9.2 – Chi-square contingency tables), to quantify the strength and direction of the association. While statistical significance is important, examining the direction and magnitude, the effect size, provides actionable insight and context for making informed decisions. For example, a new drug tested in a clinical trial may show an association between subject improvement (statistical significance), but yet have a small effect.
Example
Professor Hermon Bumpus of Brown University in Providence, Rhode Island, received 136 House Sparrows (Passer domesticus) after a severe winter storm 1 February 1898. The birds were collected from the ground; 72 of the birds survived, 64 did not (Table 1). Bumpus made several measures of morphology on the birds and the data set has served as a classical example of Natural Selection (Chicago Field Museum). We’ll look at this data set when we introduce Linear Regression.
Table 1. Survival statistics of Bumpus House sparrows
| Yes | No | |
| Female | 21 | 28 |
| Male | 51 | 36 |
Was there a survival difference between male and female House Sparrows? This is a classic contingency table analysis, something we will at length in Chapter 9. For now, we report the Chi-square test statistic for this test was 3.1264 and the test had one degree of freedom. What is the critical value of the chi-square distribution at 5% and one degree of freedom?. Typically we would simply use R to look this up
qchisq(c(0.05), df=1, lower.tail=FALSE)
But we can also get this from the table of critical values (Fig 4). Simply select the row based on the degrees of freedom for the test then scan to the column with the appropriate significance level, again, typically 5% (0.05).
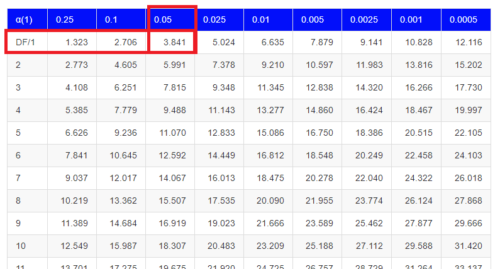
Figure 4. Portion of the chi-square distribution which shows how to find critical value of the chi-square distribution.
For 1 degree of freedom at 5% significance, the critical value is 3.841. Back to our hypothesis: Did male and female survival differ in the Bumpus data set? Following the NHST logic, if the test statistic value (eg, 3.1264) is greater than the critical value (3.841), then we would reject the null hypothesis. For this example, we would conclude no statistical difference between male and female survival because the test statistic was smaller than the critical value. How likely are these results due to chance? That’s where the p-value comes in. Our test statistic value falls between 5% and 10% (2.706 < 3.1264 < 3.841). In order to get the actual p-value of our test statistic we would need to use R.
R code
Given a chi-square test statistic you can use R to calculate the probability of that value against the null hypothesis. At the R prompt
pchisq(c(3.1264), df=1, lower.tail=FALSE)
And R output
[1] 0.07703368
Because we are using R Commander, simply select the command by following the menu options.
Rcmdr: Distributions → Continuous distributions → Chi-squared distribution → Chi-squared probabilities …
Enter the chi-square value and degrees of freedom (Fig 5).
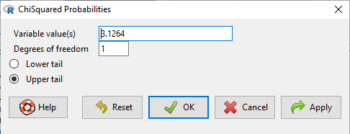
Figure 5. Screenshot of input box in Rcmdr for Chi-square probability values.
Questions
- What happens to the shape of the chi-square distribution as degrees of freedom are increased from 1 to 5 to 20 to 100?
Be able to answer these questions using the Chi-square table, Appendix 20.2, or using Rcmdr
- For probability α = 5%, what is the critical value of the chi-square distribution (upper tail)?
- The value of the chi-square test statistic is given as 12. With 3 degrees of freedom, what is the approximate probability of this value, or greater from the chi-square distribution?
Quiz Chapter 6.9
Chi-square distribution
Chapter 6 contents
- Introduction
- Some preliminaries
- Ratios and proportions
- Combinations and permutations
- Types of probability
- Discrete probability distributions
- Continuous distributions
- Normal distribution and the normal deviate (Z)
- Moments
- Chi-square (Χ2) distribution
- t distribution
- F distribution
- References and suggested readings