3.5 – Statistics of error
Making sense of error in data.
This page explains how statistics of error help quantify differences between measured and true values, beginning with classical methods like standard error and confidence intervals that rely on large-sample assumptions. Related, statisticians talk about uncertainty — the quantification of doubt about a measurement. We introduce permutation-based approaches, including jackknife and bootstrap resampling, which avoid those assumptions and are especially useful with smaller or complex data sets. Observer variation (intra- and interobserver error) is also highlighted as an important source of measurement error.
Missing values are another common source of uncertainty in biological data sets. Data may be missing because of equipment failure, recording mistakes, sample loss, or biological factors that prevent a measurement from being collected. Even a small number of missing observations can influence summaries, graphs, and statistical tests, especially in smaller studies. In this chapter, we treat missing values mainly as a practical issue to identify and report during exploratory data analysis. Later, in the chapter on experimental design, we examine missing data in greater depth, including differences between random and non-random missingness, as well as approaches such as data imputation and the consequences these choices may have for interpretation.
We conclude with a discussion about confidence intervals as a measure of accuracy and emphasize proper use of significant figures to avoid overstating precision.
Statistics of error.
In statistics, error doesn’t mean mistake, an avoidable human misjudgement or oversight, eg, a typo. An error in statistics means there was a difference between the measured value and the actual value for an object. Efforts by many authors of notable classical statistics developed a large body of calculated statistics, eg, standard error the mean, which allows the user to quantify how large the error of measurement is given assumptions about the distribution of the errors. Thus, classical statistics requires user to make assumptions about the error distribution, the subject of our Chapter 6. A critical issue to understand is that these methods assume large sample sizes are available; they are called asymptotic statistics or large-sample statistics; the properties of the statistical estimates are evaluated as sample size approaches infinity.
Jackknife sampling and bootstrap sampling are permutation approaches to working with data when the Central Limit Theorem — as sample size increases, the distribution of sample means will tend to a normal distribution (see Chapter 6.7) — is unlikely to apply or, rather, we don’t wish to make that assumption (Chapter 19). The jackknife is a sampling method involving repeatedly sampling from the original data set, but each time leaving one value out. The estimator, for example, the sample mean, is calculated for each sample. The repeated estimates from the jackknife approach yield many estimates which, collected, are used to calculate the sample variance. Jackknife estimators tend to be less biased than those from classical asymptotic statistics.
Bootstrapping, and not jackknife resampling, may now be the preferred permutation approach (eg, Google Scholar search “bootstrap statistics” 36K hits; “jackknife statistics” 17K hits), but which method is best depends on qualities of the data set. Bootstrapping involves large numbers of permutations of the original data, which, in short, means we repeatedly take many samples of our data and recalculate our statistics on these sets of sampled data. We obtain statistical significance by comparing our result from the original data against how often results from our permutations on the resampled data sets exceed the originally observed results. By permutation methods, the goal is to avoid the assumptions made by large-sample statistical inference, ie, reaching conclusions about the population based on samples from the population. Since its introduction, “bootstrapping” has been shown to be superior in many — but, importantly, not all — cases for statistics of error compared to the standard, classical approach (Efron 1979, Hesterberg 2015).
There are many advocates for the permutation approaches, and, because we have computers now instead of the hand calculators our statistics ancestors used, permutation methods may be the approach you will take in your own work. However, the classical approach has its strengths — when the conditions, that is, when the assumptions of asymptotic statistics are met by the data, then the classical approaches tend to be less conservative than the permutation methods. By conservative, statisticians mean that a test performs at the level we expect it to. Thus, if the assumptions of classical statistics are met they return the correct answer more often than do the permutation tests.
Error and the observer.
Individual researchers make observations, therefore, we can talk about observer variation as a kind of error measurement. For repeated measures of the same object by an individual, we would expect the individual to return the same results. To the extent repeated measures differ, this is intraobserver error. In contrast, measures of the same object from different individuals is interobserver error. For a new instrument or measurement system, one would need to establish the reliability of the measure: confronted with the same object do researchers get the same measurement? Accounting for interobserver error applies in many fields, eg, histopathology of putative carcinoma slides (Franc et al 2003), liver biopsies for cirrhosis (Rousselet et al 2005), blood cell counts (Bacus 1973).
Confidence in estimates.
A really useful concept in statistics is the idea that you can assign how confident you are to an estimate. This is another way to speak of the accuracy of an estimate. Clearly, we have more confidence in a sample estimate for a population parameter if many observations are made. Another factor in our ability to estimate is the magnitude of observation differences. In general, the larger the differences among values from repeated trials, the less confident we will be in out estimate, unless, again, we make our estimates from a large collection of observations. These two quantities, sample size and variability, along with our level of confidence, eg, 95%, are incorporated into a statistic called the confidence interval.

We will use this concept a lot throughout the course; for now, a simple but approximate confidence interval is to use the 2 x SEM rule (as long as sample size large): twice the standard error of the mean. Take your estimate of the mean, then add (upper limit) or subtract (lower limit) twice the value of the standard error of the mean (if you recall, that’s the standard deviation divided by the square-root of the sample size).
Example. Consider five magnetic darts thrown at a dart board (28 cm diameter, height of 1.68m from the floor) from a distance of 3.15 meters (Fig 1).
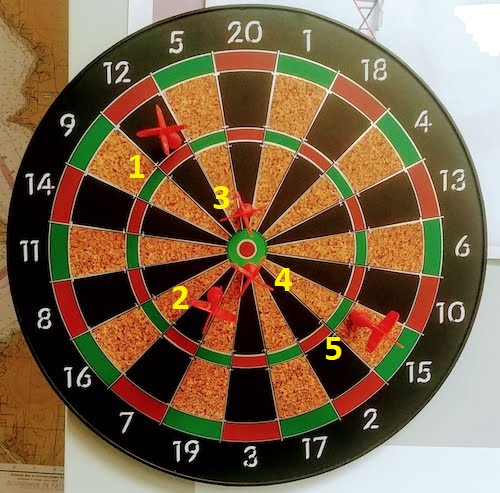
Figure 1. Magnetic dart board with 5 darts. Click image to view full sized image.
The distance in centimeters (cm) between where each of the five darts landed on the board compared to the bullseye is reported in (Table 1),
Table 1. Results of five darts thrown at a target (Figure 2)*
| Dart | Distance |
|---|---|
| 1 | 7.5 |
| 2 | 3.0 |
| 3 | 1.0 |
| 4 | 2.7 |
| 5 | 7.4 |
* distance in centimeters from the center.
Note 1: Use of the coordinate plane, and including the angle measurement in addition to distance (the vector) from center, would be a better analysis. In the context of darts, determining accuracy of a thrower is an Aim-Point targeting problem and part of your calculation would be to get MOA (minute of angle). For the record, the angles (degrees) were
| Dart | Distance | Angle |
|---|---|---|
| 1 | 7.5 | 124.4 |
| 2 | 3.0 | -123.7 |
| 3 | 1.0 | 96.3 |
| 4 | 2.7 | -84.3 |
| 5 | 7.4 | -31.5 |
measured using imageJ. Because there seems to be an R package for just about every data analysis scenario, unsurprisingly, there’s an R package called shotGroups to analyze shooting data.
How precise was the dart thrower? We’ll use the coefficient of variation as a measure of precision. Second, how accurate were the throws? Use R to calculate
darts = c(7.5, 3.0, 1.0, 2.7, 7.4)
#use the coefficient of variation to describe precision of the throws
coefVar = 100*(sd(darts)/mean(darts)); coefVar
[1] 68.46141
Confidence Interval to describe accuracy.
For a game of darts, the true value would be a distance of zero — all bullseyes. We need to calculate the standard error of the mean (SEM), then, we calculate the confidence interval around the sample mean.
#Calculate the SEM
SEM <- sd(darts)/sqrt(length(darts)); SEM
[1] 1.322649
#now, get the lower and upper limit, subtract from the mean
confidence <- c(mean(darts)-2*SEM, mean(darts), mean(darts)+2*SEM); confidence
[1] 1.674702, 4.320000, 6.965298
The mean was 4.3 cm, therefore to get the lower limit of the interval subtract 2.65 (2*SEM = 2.645298) from the mean; for the upper limit add 2.65 to the mean. Thus, we report our approximate confidence interval as (1.7, 7.0), and we read this as saying we are about 95% confident the population value is between these two limits. Five is a very small sample number, so we shouldn’t be surprised to learn that our approximate confidence interval would be less than adequate. In statistical terms, we would use the t-distribution, and not the normal distribution, to make our confidence interval in cases like this.
Note 2: As a rule, implied by Central Limit theory and use of asymptotic statistical estimation, a sample size of 30 or more is safer, but probably unrealistic for many experiments. This is sometimes called as the rule of thirty. (For example, a 96-well PCR array costs about $500; with n = 30, that’s $15,000 US Dollars for one group!). So, what about this rule? This type of thinking should be avoided as “a relic of the pre-computer era,” (Hesterberg, T. (2008). It’s Time To Retire the” n>= 30″ rule.). We can improve on asymptotic statistics by applying bootstrap principles (Chapter 19).
We made a quick calculation of the confidence interval; we can get make this calculation by hand by incorporating the t distribution. We need to know the degrees of freedom, which in this case is 4 (n – 1, where n = 5). We look up critical value of t at 5% (to get our 95% confidence interval), t = 2.78. Subtract for lower limit t*SEM and add for upper limit t*SEM to the sample mean for the 95% confidence interval.
We can get help from R, by using the one-sample t-test with a test against the hypothesis that the true mean is equal to zero. Among a variety of output we will introduce later (see Chapter 8 and 10), the confidence interval is reported (yellow highlight),
#make an attach a data frame object
Ddarts <- data.frame(darts)
t.test(darts,mu=0)
One Sample t-test
data: darts
t = 3.2662, df = 4, p-value = 0.0309
alternative hypothesis: true mean is not equal to 0
95 percent confidence interval:
 0.6477381 7.9922619
sample estimates:
mean of x
 4.32
t.test uses the function qt(), which provides the quantile function. To recreate the 95% CI without the additional baggage output from the t.test, we would simply write
#upper limit
mean(darts)+ qt(0.975,df=4)*sd(darts)/sqrt(5)

#lower limit
mean(darts)+ qt(0.025, df = 4, lower.tail=TRUE)*sd(darts)/sqrt(5)
where sd(darts)/sqrt(5) is the standard error of the mean.
Or, alternatively, download and take advantage of a small package called Rmisc (not to be confused with the RcmdrMisc package) and use the function CI
library(Rmisc)
CI(darts)
     upper     mean     lower
7.9922619 4.3200000 0.6477381
The advantage of using the CI() command from the package Rmisc is pretty clear; I don’t have to specify the degrees of freedom or the standard error of the mean. By default, CI reports the 95% confidence interval. we can specify any interval simply by adding to the command. For example,
CI(darts, ci=0.90)
reports upper and lower limits for the 90% confidence interval.
Try it. On your own, get the 90% confidence interval and the 99% confidence intervals for our dart example. Compare to the 95% confidence interval — what do you conclude about “confidence” in our estimate from 90% to 99%?
Confidence intervals from p-values.
And finally, it is not unusual for a report to provide summary statistics, differences between means (ie, effect size), and p-values (orange highlight), but not report confidence intervals. We discuss p-values and the concept of statistical significance beginning in Chapter 8. But for now, we show how to calculate approximate confidence intervals from the p-value. This may be of use for conducting meta-analysis (Chapter 20.15). See two helpful “how to” articles by Bland and Altman in 2011 BMJ (references listed in Chapter 3.6 – References).
In brief, calculate the test statistic for a normal distribution (letZ), calculate a standard error, and then the lower and upper limits for the 95% confidence interval. We illustrate use of the calculator formulas with the dart example, the p-value was 0.0309; the estimate was 4.32.
R code
letZ = (-0.862 + sqrt(0.743 - 2.404*log(0.0309, base = exp(1)))) = 2.154903
letSE = 4.32/letZ = 2.00473
1.96*letSE = 3.929271 # Add for upper and subtract for lower
The lower limit is 0.39 (4.32 – 3.929271) and the upper limit is 8.25 (4.32 + 3.929271). Although in the ballpark, these calculated estimates are wider than the confidence interval estimated by the t.test command. Small sample size, n = 5, is to blame — the accuracy of these methods, based on asymptotic statistical estimation approaches, assumes the law of large numbers applies.
Significant figures.
And finally, we should respect significant figures, the number of digits which have meaning. Our data were measured to the nearest tenth of a centimeter, or two significant figures. Therefore, if we report the confidence interval as (0.6477381, 7.9922619), then we imply a false level of precision, unless we also report our random sampling error of measurement.
R has a number of ways to manage output. One option would be to set number of figures globally with the options() function — all values reported by R would hold for the entire session. For example, options(digits=3) would report all numbers to three significant figures. Instead, I prefer to use signif() function, which allows us to report just the values we wish and does not change reporting behavior for the entire session.
signif(CI(darts),2)
upper  mean lower
 8.00  4.30  0.65
Note 3: The options() function allows the R user to set a number of settings for an R session. After gaining familiarity with R, the advanced user recognizes that many settings can be changed to make the session work to report in ways more convenient to the user. If curious, submit options() at the R prompt and available settings will be displayed.
The R function signif() applies rounding rules. We apply rounding rules when required to report estimates to appropriate levels of precision. Rounding procedures are used to replace a number with a simplified approximation. Wikipedia provides a comprehensive list of rounding rules. Notable rules include
- directed rounding to an integer, eg, rounding up or down
- rounding to nearest integer, eg, round half up (down) if the number ends with 5
- randomly rounding to an integer, eg, stochastic rounding.
With the exception of stochastic rounding, all rounding methods impose biases on the sets of numbers. For example, the round half up method applied for numbers above 5, round down for numbers below 5 will increase the variance of the sample. In R, use round() for most of your work. If you need one of the other approaches, for example, to round up, the command is ceiling(); to round down we use floor().
When to round?
No doubt your previous math classes have cautioned you about the problems of rounding error and their influence on calculation. So, as a reminder, if reporting calls for rounding, then always round after you’ve completed your calculations, never during the calculations themselves.
A final note about significant figures and rounding. While the recommendations about reporting statistics are easy to come by (and often very proscriptive, eg, Table 1, Cole 2015), there are other concerns. Meta-analysis, which are done by collecting information from multiple studies, would benefit if more and not fewer numbers are reported, for the very same reason that we don’t round during calculations.
Questions
- Calculate the correct 90% and 99% confidence intervals for the dart data using the t-distribution
- by hand
- by one alternative method in R, demonstrated with examples in this page
- How many significant figures should be used for the volumetric pipettor p1000? The p200? The p20 (data at end of this page)?
- Another function,
round(), can be used. Try
round(CI(darts),2)
-
- and report the results: vary the significant figures from 1 to 10 (
signif()will take digits up to 22). - See any output differences between
signif()andround()? Don’t forget to take advantage of R help pages (eg, enter?roundat the R prompt) and see Wikipedia.
- and report the results: vary the significant figures from 1 to 10 (
- Compare rounding by
signif()andround()for the number 0.12345. Can you tell which rounding method the two functions use? - Calculate the coefficient of variation (CV) for each of the three volumetric pipettors from the data at end of this page. Rank the CV from smallest to largest. Which pipettor had the smallest CV and would therefore be judged the most precise?
- (data provided at end of this page, click here).
- Standards distinguish between within run precision and between run precision of a measurement instrument (see Chapter 16.5 – Instrument reliability and validity). The data in Table 1 were all recorded within 15 minutes by one operator. What kind pf precision was measured?
- Calculate the standard error of the means for each of the three pipettors from the data
- (data provided at end of this page, click here).
- Calculate the approximate confidence interval using the 2SE rule and judge which of the three pipettors is the most accurate (narrowest confidence interval)
- Repeat, but this time apply your preferred R method for obtaining confidence intervals.
- Compare approximate and R method confidence intervals. How well did the approximate method work?
- Return to the dart example, but now assume the p-value was p = 0.003 and again for p = 0.0003. Estimate the 95% confidence interval for each case; the difference remains 4.32. How does the change in p-value, from 0.03 to 0.0003 — a two orders of magnitude difference — affect the estimates for the confidence interval (hint: describe the width of the CI)?
Quiz Chapter 3.5
Statistics of error
Data sets
Pipette calibration
| p1000 | p200 | p100 |
|---|---|---|
| 0.113 | 0.1 | 0.101 |
| 0.114 | 0.1 | 0.1 |
| 0.113 | 0.1 | 0.1 |
| 0.115 | 0.099 | 0.101 |
| 0.113 | 0.1 | 0.101 |
| 0.112 | 0.1 | 0.1 |
| 0.113 | 0.1 | 0.1 |
| 0.111 | 0.1 | 0.1 |
| 0.114 | 0.101 | 0.101 |
| 0.112 | 0.1 | 0.1 |
Chapter 3 continues
18.5 – Selecting the best model
Introduction
This is a long entry in our textbook, many topics to cover. We discuss aspects of model fitting, from why model fitting is done to how to do it and what statistics are available to help us decide on the best model. Model selection very much depends on what the intent of the study is. For example, if the purpose of model building is to provide the best description of the data, then in general one should prefer the full (also called the saturated) model. On the other hand, if the purpose of model building is to make a predictive statistical model, then a reduced model may prove to be a better choice. The text here deals mostly with the later context of model selection, finding a justified reduced model.
From Full model to best Subset model
Model building is an essential part of being a scientist. As scientists, we seek models that explain as much of the variability about a phenomenon as possible, but yet remain simple enough to be of practical use.
Having just completed the introduction to multiple regression, we now move to the idea of how to pick best models.
We distinguish between a full model, which includes as many variables (predictors, factors) as the regression function can work with, returning interpretable, if not always statistically significant output, and a saturated model.
The saturated model is the one that includes all possible predictors, factors, interactions in your experiment. In well-behaved data sets, the full model and the saturated model will be the same model. However, they need not be the same model. For example, if two predictor variables are highly collinear, then you may return an error in regression fitting.
For those of you working with meta-analysis problems, you are unlikely to be able to run a saturated model because some level of a key factor are not available in all or at least most of the papers. Thus, in order to get the model to run, you start dropping factors, or you start nesting factors. If you were unable to get more things in the model, then this is your “full” model. Technically we wouldn’t call it saturated because there were other factors, they just didn’t have enough data to work with or they were essentially the same as something else in the model.
Identify the model that does run to completion as your full model and proceed to assess model fit criteria for that model, and all reduced models thereafter.
In R (Rcmdr) you know you have found the full model when the output lacks “NA” strings (missing values) in the output. Use the full model to report the values for each coefficient, i.e., conducting the inferential statistics.
Get the estimates directly from the output from running the regression function. You can tell if the effect is positive (look at the estimate for sample — it is positive) so you can say — more samples, greater likelihood to see more cases of cancer.
Remember, the experimental units are the papers themselves, so studies with larger numbers of subjects are going to find more cases of diabetes. We would worry big time with your project if we did not see statistically significant and positive for sample size.
Example: A multiple linear model
For illustration, here’s an example output following a run with the linear model function on a portion of the Kaggle Cardiovascular disease data set.
Note: For my training data set I simply took the first 100 rows — from the 70,000 rows! in the dataset. A more proper approach would include use of stratified random sampling, for example, by gender, alcohol use, and other categorical classifications.
The variables (and data types) were
SBP = systolic blood pressure (from ap_hi)
age.years = Independent variable, ratio scale (calculated from age in days)
BMI = Dependent variable, ratio scale (calculated from height and weight variables)
active = Independent variable, physical activity, binomial
alcohol = Independent variable, alcohol use, binomial
cholesterol = Independent variable, cholesterol levels (scored 1 = “normal,” 2 = “above normal, and 3 = “well above normal”)
gender = Independent variable, binomial
glucose = Independent variable, glucose levels (scored 1 = “normal,” 2 = “above normal, and 3 = “well above normal”)
smoke = Independent variable, binomial
R output
Call:
lm(formula = SBP ~ BMI + gender + age.years + active + alcohol +
cholesterol + gluc + smoke, data = kaggle.train)

Residuals:
Min 1Q Median 3Q Max
-33.359 -9.701 -1.065 8.703 45.242

Coefficients:
             Estimate Std. Error t value   Pr(>|t|)
(Intercept)   76.7664    14.9311   5.141  0.00000155 ***
BMI            0.8395     0.2933   2.862  0.00522 **
gender        -2.0744     1.6102  -1.288  0.20092
age.years      0.2742     0.2403   1.141  0.25672
active         7.1411     3.4934   2.044  0.04383 *
alcohol       -7.9272     9.1854  -0.863  0.39039
cholesterol    7.4539     2.3200   3.213  0.00182 **
gluc          -1.2701     2.9533  -0.430  0.66817
smoke         11.4132     6.7015   1.703  0.09197 .
---
Signif. codes: 0 '***' 0.001 '**' 0.01 '*' 0.05 '.' 0.1 ' ' 1

Residual standard error: 14.96 on 91 degrees of freedom
Multiple R-squared: 0.2839, Adjusted R-squared: 0.221
F-statistic: 4.51 on 8 and 91 DF, p-value: 0.0001214
Question. Write out the equation in symbol form.
We see from the modest R2 (adjusted) that the model explains little variation in systolic blood pressure; only BMI, physical activity (yes, no), and serum cholesterol levels, were statistically significant at 5% level. Smoker (yes, no) approached significance (p-value = 0.092), but I wouldn’t go on and on about positive or negative coefficients and effects.
Note: For my training data set I simply took the first 100 rows — from the 70,000 rows! in the dataset. A more proper approach would include use of stratified random sampling, for example, by gender, alcohol use, and other categorical classifications.
We report the value (I would round to 7.5) for cholesterol on SBP (Table 1), and note that those who had elevated serum cholesterol levels tended to have higher systolic blood pressure (e.g., the sign of the coefficient — and I related the coefficient back to the most important thing about your study — the biological interpretation). Repeat the same for the other significant coefficients.
Now’s a good time to be clear about HOW you report statistical results. DO NOT SIMPLY COPY AND PASTE EVERYTHING into your report. Now, for the estimates above, you would report everything, but not all of the figures. Here’s how the output should be reported in your Project paper.
Table 1. Coefficients from full model.
term     Coefficient Error  P-value*
Intercept       76.8  14.93 < 0.00001
BMI              0.8   0.29   0.00522
gender          -2.1   1.61   0.20092
age.years        0.3   0.24   0.25672
active           7.1   3.49   0.04383
alcohol         -7.9   9.19   0.39039
cholesterol      7.5   2.32   0.00182
gluc            -1.3   2.95   0.66817
smoke           11.4   6.70   0.09197
* t-test
Looks better, doesn’t it?
Note: Obviously, don’t round for calculations!
Once you have the full model, we should run simple diagnostics on the regression fit to the data (VIF, Cook’s Distance, basic diagnostic plots), then proceed to use this model for the inferential statistics.
> vif(model.1)
BMI gender age.years active alcohol cholesterol gluc smoke
1.112549 1.091154 1.081641 1.048519 1.096382 1.178635 1.168442 1.131081
No VIF was greater than 2, suggesting little multicollinearity among the predictor variables.
> cooks.distance(model.1)[which.max(cooks.distance(model.1))]
60
0.355763
This person had high SBP (180), was a smoker, but active and normal BMI.
Use the significance tests of each parameter in the model from the corresponding ANOVA table. Now, where is the ANOVA table? Remember, right after running the linear regression,
Rcmdr: Models → Hypothesis testing → ANOVA tables
Accept the default (partial marginality), and, Boom! … the ANOVA table you should be familiar with.
From the ANOVA table you will tell me whether a Factor is significant or not. You report the ANOVA table in your paper. You describe it.
Now, the next step is to decide what is the best model. It then guides you to the next step which is to decide whether a better model (fewer parameters, Occam’s razor) can be found. Identify the parameter from the ANOVA table with the highest P-value and remove it from the model when you run the regression again. Repeat the steps above, return the ANOVA table, checking the estimates and P-values, until you have a model with only statistically significant parameters.
Find the best model
We may be tempted to run the linear model again, but with non-significant predictors excluded. For example, re-run the model on SBP but with just BMI, active, cholesterol and excluding smoke.
We can calculate the AIC, Akaike Information Criterion, the lower value is considered the better model.
AIC(model.1)
[1] 835.4938
AIC(model.2)
[1] 834.0782
The full model had eight predictor variables, excluding the intercept, whereas the reduced model had just three predictor variables, again, not including the intercept. Unsurprisingly, the reduced model is better. But now, a stronger test — what about smoking, where the p-value approached 5%? We ran the linear model (model.3).
> AIC(model.3)
[1] 831.9495
We can use an anova test or the likelihood ratio test to compare the models. The anova test, the models must be nested.
stats::anova(model.2, model.3)
Analysis of Variance Table

Model 1: SBP ~ BMI + active + cholesterol
Model 2: SBP ~ BMI + active + cholesterol + smoke
  Res.Df   RSS Df Sum of Sq      F   Pr(>F)
1     96 22205
2     95 21307  1     898.1 4.0043 0.04824 *
---
Signif. codes: 0 '***' 0.001 '**' 0.01 '*' 0.05 '.' 0.1 ' ' 1
and
lmtest::lrtest((model.2,model.3)
Likelihood ratio test

Model 1: SBP ~ BMI + active + cholesterol
Model 2: SBP ~ BMI + active + cholesterol + smoke
 #Df  LogLik Df  Chisq Pr(>Chisq)
1  5 -412.04
2  6 -409.97  1 4.1286 0.04216 *
---
Signif. codes: 0 '***' 0.001 '**' 0.01 '*' 0.05 '.' 0.1 ' ' 1
Both tests tell us the same thing — our model with four predictors, including smoking, is better.
2 December 2024 — Past this point, edits pending
But first, I want to take up an important point about your models that you may not have had a chance to think about. The order of entry of parameters in your model can effect the significance and value of the estimates themselves. The order of parameter model entry above can be read top to bottom. Age was first, followed in sequence by CalsPDay, CholPDay, and so on. By convention, enter the covariates first (the ratio-scale predictors), that’s what I did above.
Here’s the output from a model in which I used a different order of parameters.
Anova(LinearModel.2, type="II")
Anova Table (Type II tests)

Response: BMI
              Sum Sq    Df    F value     Pr(>F)
Sex             1.52     1     0.0478    0.82764
Smoke           8.84     1     0.2782    0.59964
Age             0.62     1     0.0196    0.88918
CalsPDay       10.79     1     0.3394    0.56215
CholPDay       92.37     1     2.9065    0.09286 .
Sex:Smoke       3.35     1     0.1055    0.74631
Residuals    2129.34    67
The output is the same!!! So why did I give you a warning about parameter order? Run the ANOVA table summary command again, but this time select Type III type of test, i.e., ignore marginality
> Anova(LinearModel.2, type="III")
Anova Table (Type III tests)

Response: BMI
               Sum Sq    Df    F value       Pr(>F)
(Intercept)   1544.34     1    48.5929   1.708e-09 ***
Sex              4.69     1     0.1475     0.70214
Smoke           11.82     1     0.3720     0.54400
Age              0.62     1     0.0196     0.88918
CalsPDay        10.79     1     0.3394     0.56215
CholPDay        92.37     1     2.9065     0.09286 .
Sex:Smoke        3.35     1     0.1055     0.74631
Residuals     2129.34    67
The output has changed — and in fact it now reports the significance test of the intercept. This output is the same as the output from the linear model. Try again, this time selecting Type I, sequential
> anova(LinearModel.2)
Analysis of Variance Table

Response: BMI
           Df   Sum Sq    Mean Sq  F value    Pr(>F)
Sex         1     0.68      0.681   0.0214   0.88402
Smoke       1     2.82      2.816   0.0886   0.76690
Age         1     3.44      3.436   0.1081   0.74333
CalsPDay    1     2.27      2.272   0.0715   0.78998
CholPDay    1    96.30     96.299   3.0301   0.08633
Sex:Smoke   1     3.35      3.354   0.1055   0.74631
Residuals  67  2129.34     31.781
Here, we see the effect of order. So, as we are working to learn all of the issues of statistics and in particular mode fitting, I have purposefully restricted you to Type II analyses — obeying marginality correctly handles most issues about order of entry.
Easy there…. Take a deep breath, and guess what? Your best model needs to have significant parameters in it, right? Your best fit model then is Model 5. And that model will be your candidate for best fit as we proceed to complete our model building.

Now we proceed to gain some support evidence for our candidate best model. We are going to use an information criterion approach.
Use a fit criterion for determining model fit
To help us evaluate evidence in favor of one model over another there are a number of statistics one may calculate to provide a single number for each model for comparison purposes. The criteria model evaluators available to us include Mallow’s Cp, adjusted R2, Akaike Information Criterion (AIC) or the Bayesian Information Criterion (BIC) to select best model.
We already introduced the coefficient of determination R2 as a measure of fit – in general we favor models with larger values of R2. However, values of R2 will always be larger for models with more parameters. Thus, the other evaluators attempt to adjust for the parameters in the model and how they contribute to increased model fit. For illustrative purposes we will use Mallow’s Cp. The equation for Mallow’s Cp in linear regression is

where p is the number of parameters in the model. Mallow’s Cp is thus equal to the number of parameters in the model plus an additional amount due to lack of fit of the model (i.e., large residuals). All else being equal we favor the model in which the Cp is close to the number of parameters in the model.
In Rcmdr, select Models → Subset model selection … (Fig. 1)
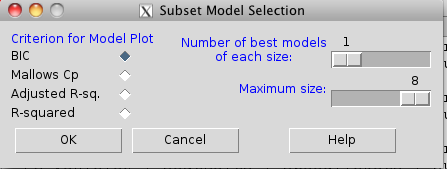
Figure 1. Rcmdr popup menu, Subset model selection…
From the menu, select the criterion and how many models to return. The function returns a graph that can be used to interpret which model is best given the selection criterion used. Below is an example (although for a different data set!) for Mallow’s Cp (Fig. 2).
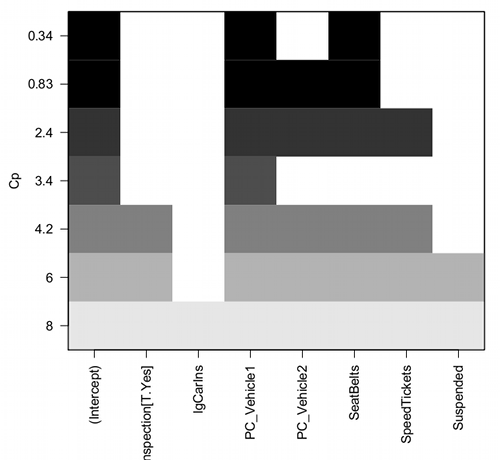
Figure 2. Mallow’s Cp plot
Lets break down the plot. First define the axes. The vertical axis is the range of values for the Cp calculated for each model. The horizontal axis is categorical and reads from left to right: Intercept, Inspection[T.Yes], etc., up to Suspended. Looking into the graph itself we see horizontal bars — the extent of shading indicates which model corresponds to the Cp value. For example, the lowest bar which is associated with the Cp value of 8 extends all the way to the right of the graph. This says that the model evaluated included all of the variables and therefore was the saturated or full model. The next bar from the bottom of the graph is missing only one block (lgCarIns), which tells us the Cp value 6 corresponds to a reduced model, and so forth.
Cross-validation
Once you have identified your Best Fit model, then, your proceed to run the diagnostics plots. For the rest of the discussion we return to our first example.
Rcmdr: Models → Graphs → Basic diagnostic plots.
We’ll just concern ourselves with the first row of plots (Fig. 3).
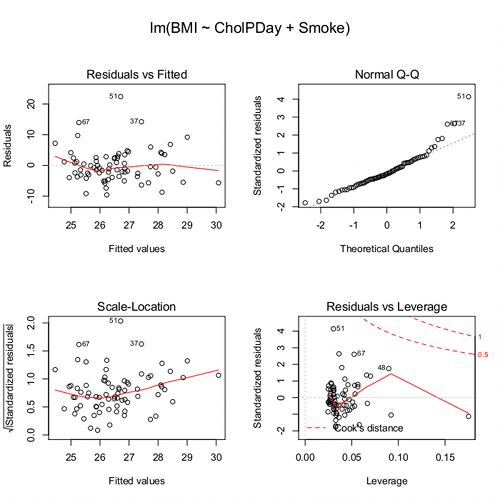
Figure 3. Diagnostic plots
The left one shows the residuals versus the predicted values — if you see a trend here, the assumption of linearity has been violated. The second plot is a test of the assumption of normality of the residuals. Interpret them (residuals OK, Residuals normally distributed? Yes/ No), and you’re done. Here, I would say I see no real trend in the residuals vs fitted plot, so assumption of linear fit is OK. For normality, there is a tailing off at the larger values of residuals, which might be of some concern (and I would start thinking about possible leverage problems), but nothing dramatic. I would conclude that our Model 6 is a good fitting model and one that could be used to make predictions.
Now, if you think a moment, you should identify a logical problem. We used the same data to “check” the model fit as we did to make the model in the first place. In particular if the model is intended to make predictions it would be advisable to check the performance of the model (e.g., does it make reasonable predictions?) by supplying new data, data not used to construct the model, into the model. If new data are not available, one acceptable practice is to divide the full data set into at least two subsets, one used to develop the model (sometimes called the calibration or training dataset) and the other used to test the model. The benefits of cross-validation include testing for influence points, over fitting of model parameters, and a reality check on the predictions generated from the model.
A note on best practices
In the 1980s, researchers often “removed” the effect of a covariate by first fitting a regression and then saving the residuals to use in separate analyses, such as t-tests, ANOVAs, or variance component estimates (eg, Dohm et al 2001). For example, in a study of plant growth, scientists might regress final plant height on initial size to remove the effect of size, then compare the residuals between fertilizer groups. While this approach adjusts for the covariate, it is problematic because residuals are not raw data: they are correlated, have constrained sums, and underestimate uncertainty. This can distort group differences, especially if the covariate distributions differ among groups, and it ignores the variability introduced by the first regression. This approach was common in ecology, evolutionary biology, physiology, and psychology before modern mixed modeling and generalized regression workflows became standard.
Modern best practices instead recommend fitting a single unified model that includes both the covariate and the grouping variable directly. Using the same plant growth example, a linear model such as  estimates the effect of fertilizer while properly accounting for initial plant size. This approach provides valid standard errors, allows correct inference about group differences, and can accommodate interactions (eg, if the relationship between
 and
 differs by group) or hierarchical data structures using mixed-effects models. Additionally, modern workflows include diagnostics such as residual plots, Cook’s Distance, and variance inflation factors to check model assumptions and influential points. Use mixed models when data are hierarchical or repeated data. Random effects handle variation among groups, individuals, years, etc., in a single coherent model. When covariates need to be “controlled for,” we use partial regression. This happens inside the model, not by subtracting covariate effects first. By analyzing all relevant predictors in a single model, researchers obtain more accurate estimates, properly reflect uncertainty, and avoid the statistical pitfalls of the old residual-based two-stage approach.
Thus, there are several statistical reasons the older approach fails under modern scrutiny. First, Residuals are not independent observations. Residuals are model-dependent quantities, not raw data. Once you fit a regression, the residuals are correlated with each other, constrained to sum to zero, and, likely heteroscedastic if the model was imperfect. Using them in a new test violates standard assumptions of the second test.
Second, you underestimate uncertainty. If you perform tests on residuals, the standard errors do not include uncertainty from the first regression, which may lead to inflated Type I error and an overly confident “adjusted” group comparisons.
Third, the old approach creates a “two-stage model” that breaks the likelihood framework. A two-stage analysis discards the correct joint likelihood and therefore produces biases p-values, and interferes with valid confidence intervals or predictions.
Under the modern one-stage models include ML/REML, generalized estimating equations, and fully integrated Bayesian models, which keeps the model coherent. Use of mixed models make residualization unnecessary. In studies with repeated measures, blocks, sites, subjects, or years, the old approach cannot partition sources of variation correctly.
In short, the advantages of the one-stage approach is that resulting models have valid uncertainty, correct group comparisons, better handling of interactions and hierarchy, full likelihood-based inference. They fit a single unified regression or mixed-effects model with all relevant predictors, examine diagnostics, and make inferences directly. This is one more benefit of the increased power and availability of more powerful computers and more complete development of mixed methods modeling.
Questions
- Write up three learning outcomes for this page. Hint: Point your favorite generative AI to this page and ask for help.
Quiz Chapter 18.5
Selecting the best regression model
Chapter 18 contents
14.4 – Randomized block design
Introduction
Randomized Block Designs and Two-Factor ANOVA
In previous lectures, we have introduced you to the standard factorial ANOVA, which may be characterized as being crossed, balanced, and replicated. We expect additional factors (covariates) may contribute to differences among our experimental units, but rather than testing them — which would increase need for additional experimental units because of increased number of groups to test — we randomize our subjects. Randomization is intended to disrupt trends of confounding variables (aka covariates). If the resulting experiment has missing values (see Chapter 5), then we can say that the design is partially replicated; if only one observation is made per group, then the design is not replicated — and perhaps, not very useful!!
A special type of Two-factor ANOVA which includes a “blocking” factor and a treatment factor.
Randomization is one way to control for “uninteresting” confounding factors. Clearly, there will be scenarios in which randomization is impossible. For example, it is impossible to randomly assign subjects to The blocking factor is similar to the 10.3 – Paired t-test. In the paired t-test we had two individuals or groups that we paired (eg, twins). One specific design is called the Randomized Block Design and we can have more than 2 members in the group. We arrange the experimental units into similar groups, ie, the blocking factor. Examples of blocking factors may include day (experiments are run over different days), location (experiments may be run at different locations in the laboratory), nucleic acid kits (different vendors), operator (different assistants may work on the experiments), etcetera.
In general we may not be directly interested in the blocking factor. This blocking factor is used to control some factor(s) that we suspect might affect the response variable. Importantly, this has the effect of reducing the sums of squares by an amount equal to the sums of squares for the block. If variability removed by the blocking is significant, Mean Square Error (MSE) will be smaller, meaning that the F for treatment will be bigger — meaning we have a more powerful ANOVA than if we had ignored the blocking.
Statistical Testing in Randomized Block Designs
“Blocks” is a Random Factor because we are “sampling” a few blocks out of a larger possible number of blocks. Treatment is a Fixed Factor, usually.
The statistical model is

The Sources of Variation are simpler than the more typical Two-Factor ANOVA because we do not calculate all the sources of variation – the interaction is not tested! (Table 1).
Table 1. Sources of variation for a two-way ANOVA, randomized block design
|
Sources of Variation & Sum of Squares
|
DF
|
Mean Squares
|
 |
 |
 |
 |
 |
 |
 |
 |
 |
 |
 |
 |
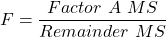
Critical Value F0.05(2), (a – 1), (Total DF – a – b)
In the exercise example above: Factor A = exercise or management plan.
Notice that we do not look at the interaction MS or the Blocking Factor (typically).
Learn by doing
Rather than me telling you, try on your own. We’ll begin with a worked example, then proceed to introduce you to three problems. Click here (Ch 14.8)for general discussion of Rcmdr and linear models for models other than the standard 2-way ANOVA (Chapter 14.8).
Worked example
Wheel running by mice is a standard measure of activity behavior. Even wild mice will use wheels (Meijer and Roberts 2014). For example, we conduct a study of family parity to see if offspring from the first, second, or third sets of births from wheel-running behavior in mice (total revs per 24 hr period). Each set of offspring from a female could be treated as a block. Data are for 3 female offspring from each pairing. This type of data set would look like this:
Table 2. Wheel running behavior by three offspring from each of three birth cohorts among four maternal sets (moms).
|
Revolutions of wheel per 24-hr period
|
||||
|
Block
|
Dam 1
|
Dam 2
|
Dam 3
|
Dam 4
|
|
b1
|
1100
|
1566
|
945
|
450
|
|
b1
|
1245
|
1478
|
877
|
501
|
|
b1
|
1115
|
1502
|
892
|
394
|
|
b2
|
999
|
451
|
644
|
605
|
|
b2
|
899
|
405
|
650
|
612
|
|
b2
|
745
|
344
|
605
|
700
|
|
b3
|
1245
|
702
|
1712
|
790
|
|
b3
|
1300
|
612
|
1745
|
850
|
|
b3
|
1750
|
508
|
1680
|
910
|
Thus, there were nine offspring for each female mouse (Dam1 – Dam4), three offspring per each of three litters of pups. The litters are the blocks. We need to get the data stacked to run in R. I’ve provided the full dataset for readers, scroll to end of this page or click here.
Question 1. Describe the problem and identify the treatment and blocking factors.
Answer. Each female has three litters. We’re primarily interested in genetics (and maternal environment) of wheel running behavior, which is associated with the moms (Treatment factor). The questions is whether there is an effect of birth parity on wheel running behavior. Offspring of a first-time mother may experience different environment than offspring of experienced mother. In this case, parity effects is an interesting question, nevertheless, blocking is the appropriate way to handle this type of problem.
Question 2. What is the statistical model?
Answer. Response variable, Y, is wheel running. Let α the effect of Dam and β the birth cohorts (ie, the blocking effect).
Question 3. Test the model.
Answer. We fit the main effects, Dam and Block Fig 1.

Rcmdr: Statistics → Fit models → Linear model
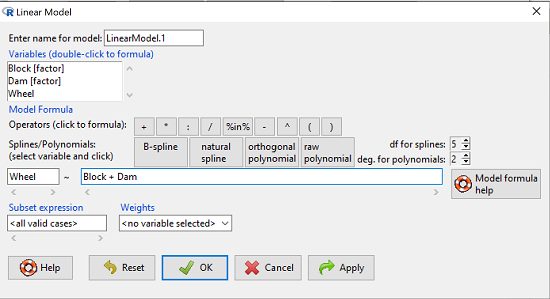
Figure 1. Screenshot Rcmdr Linear Model menu.
then run the ANOVA summary to get the ANOVA table. Rcmdr: Models → Hypothesis tests → ANOVA table.
R Output
Anova Table (Type II tests)

Response: Wheel
           Sum Sq  Df  F value    Pr(>F)
Dam       1467020   3   4.4732   0.01036 *
Block     1672166   2   7.6482   0.00207 **
Residuals 3279544  30
Question 4. Conclusions?
Answer 4. The null hypotheses are:
Treatment factor: Offspring of the different dams have same wheel running activity of offspring.
Blocking factor: No effect of litter parity on wheel running activity of offspring.
Both the treatment factor (p = 0.01036) and the blocking factor (p = 0.00207) were statistically significant.
Questions
Problem 1.
Or we might want to measure the Systolic Blood Pressure of individuals that are on different exercise regimens. However, we are not able to measure all the individuals on the same day at the same time. We suspect that time of day and the day of the year might effect an individuals blood pressure. Given this constraint, the best research design in this circumstance is to measure one individual on each exercise regime at the same time. These different individuals will then be in the same “block” because they share in common the time that their blood pressure was measured. This type of data set would look like this (Table 2):
Table 2. Simulated blood pressure of five subjects on three different exercise regimens.†
|
Subject
|
No
Exercise |
Moderate Exercise
|
Intense Exercise
|
|
1
|
120
|
115
|
114
|
|
2
|
135
|
130
|
131
|
|
3
|
115
|
110
|
109
|
|
4
|
112
|
107
|
106
|
|
5
|
108
|
103
|
102
|
Let’s make a line graph to help us visualize trends (Fig 2).
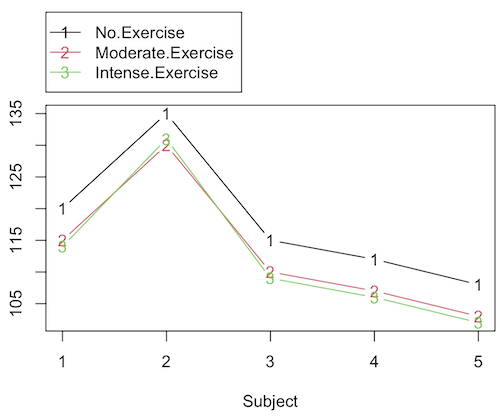
Figure 2. Line graph of data presented in Table 2.
Question 1. Describe the problem and identify the treatment and blocking factors.
Question 2. What is the statistical model?
Question 3. Test the model.
Question 4. Conclusions?
†You’ll need to arrange the data like the data set for the worked example.
Problem 2.
Another example in conservation biology or agriculture. There may be three different management strategies for promoting the recovery of a plant species. A good research design would be to choose many plots of land (blocks) and perform each treatment (management strategy) on a portion of each plot of land (block). A researcher would start with an equal number of plantings in the plots and see how many grew. The plots of land (blocks) share in common many other aspects of that particular plot of land that may effect the recovery of a species.
Table 3. Growth of plants in 5 different plots subjected to one of three management plans (simulated data set).†
|
Plot No.
|
No Management Used
|
Management
Plan 1 |
Management
Plan 2 |
|
1
|
0
|
11
|
14
|
|
2
|
2
|
13
|
15
|
|
3
|
3
|
11
|
19
|
|
4
|
4
|
10
|
16
|
|
5
|
5
|
15
|
12
|
†You’ll need to arrange the data the same arrangement as for the worked example.
These are examples of Two-Factor ANOVA but we are usually only interested in the treatment Factor. We recognize that the blocking factor may contribute to differences among groups and so wish to control for the fact that we carried out the experiments at different times (eg, seasons) or at different locations (eg, agriculture plots)
Question 5. Describe the problem and identify the treatment and blocking factors. Make a line graph to help visualize.
Question 6. What is the statistical model?
Question 7. Test the model.
Question 8. Conclusions?
Repeated-Measures Experimental Design
If multiple measures are taken on the same individual, then we have a repeated-measures experiment. This is a Randomized Block Design. In other words, each animal gets all levels of a treatment (assigned randomly). Thus, samples (individuals) are not independent and the analysis needs to take this into account. Just like for paired-T tests, one can imagine a number of experiments in biomedicine that would conform to this design.
Problem 3.
The data are total blood cholesterol levels for 7 individuals given 3 different drugs (from example given in Zar 1999, Ex 12.5, pp. 257-258).
Table 5. Repeated measures of blood cholesterol levels of seven subjects on three different drug regimens.†
|
Subjects
|
Drug1
|
Drug2
|
Drug3
|
|
1
|
164
|
152
|
178
|
|
2
|
202
|
181
|
222
|
|
3
|
143
|
136
|
132
|
|
4
|
210
|
194
|
216
|
|
5
|
228
|
219
|
245
|
|
6
|
173
|
159
|
182
|
|
7
|
161
|
157
|
165
|
†You’ll need to arrange the data like the data set for the worked example.
Question 9: Is there an interaction term in this design? Make a line graph to help visualize.
Question 10: Are individuals a fixed or a random effect?
Question 11. What is the statistical model?
Question 12. Test the model. Note that we could have done the experiment with 21 randomly selected subjects and a one-factor ANOVA. However, the repeated measures design is best IF there is some association (“correlation”) between the data in each row. The computations are identical to the randomized block analysis.
Question 13. Conclusions?
Problem 4.

Figure 3. Juvenile garter snake, image from juvenile garter snake in hand, public domain.
Here is a second example of a repeated measures design experiment. Garter snakes (Fig 3) respond to odor cues to find prey. Snakes use their tongues to “taste” the air for chemicals, and flick their tongues rapidly when in contact with suitable prey items, less frequently for items not suitable for prey. In the laboratory, researchers can test how individual snakes respond to different chemical cues by presenting each snake with a swab containing a particular chemical. The researcher then counts how many times the snake flicks its tongue in a certain time period (data presented p. 301, Glover and Mitchell 2016).
Table 6. Tongue flick counts of naïve newborn snakes to extracts†
|
Snake
|
Control (dH2O)
|
Fish mucus
|
Worm mucus
|
|
1
|
3
|
6
|
6
|
|
2
|
0
|
22
|
22
|
|
3
|
0
|
12
|
12
|
|
4
|
5
|
24
|
24
|
|
5
|
1
|
16
|
16
|
|
6
|
2
|
16
|
16
|
†You’ll need to arrange the data like the data set for the worked example.
Question 14. Describe the problem and identify the treatment and blocking factors. Make a line graph to help visualize.
Question 15. What is the statistical model?
Question 16. Test the model.
Question 17. Conclusions?
Quiz Chapter 14.4
Randomized block design
Data sets used in this page
Problem 1 data set
| Block | Dam | Wheel |
|---|---|---|
| B1 | D1 | 1100 |
| B1 | D2 | 1566 |
| B1 | D3 | 945 |
| B1 | D4 | 450 |
| B1 | D1 | 1245 |
| B1 | D2 | 1478 |
| B1 | D3 | 877 |
| B1 | D4 | 501 |
| B1 | D1 | 1115 |
| B1 | D2 | 1502 |
| B1 | D3 | 892 |
| B1 | D4 | 394 |
| B2 | D1 | 999 |
| B2 | D2 | 451 |
| B2 | D3 | 644 |
| B2 | D4 | 605 |
| B2 | D1 | 899 |
| B2 | D2 | 405 |
| B2 | D3 | 650 |
| B2 | D4 | 612 |
| B2 | D1 | 745 |
| B2 | D2 | 344 |
| B2 | D3 | 605 |
| B2 | D4 | 700 |
| B3 | D1 | 1245 |
| B3 | D2 | 702 |
| B3 | D3 | 1712 |
| B3 | D4 | 790 |
| B3 | D1 | 1300 |
| B3 | D2 | 612 |
| B3 | D3 | 1745 |
| B3 | D4 | 850 |
| B3 | D1 | 1750 |
| B3 | D2 | 508 |
| B3 | D3 | 1680 |
| B3 | D4 | 910 |
Chapter 14 contents
14.2 – Sources of variation
Introduction
Sources of variation, or components of the two-way ANOVA include two factors, each with two or more levels (groups), and collectively, factors are often referred to as the main effects in these types of ANOVA. The other source of variation in a two-way ANOVA is the interaction between the two factors. Below, I have listed the important components, although I have not included how the sum of squares are calculated. You are expected to know the sources of variation for this most basic two-way ANOVA table (Fig 1). You should also be able to solve any missing elements in one of these tables by utilizing any included information.
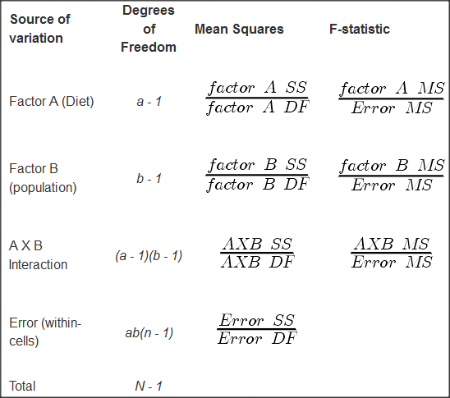
Figure 1. ANOVA table for two-way, balanced, replicated design.
Taking each row from Figure 1 one at a time we have
| Source | DF | Mean Squares | F-statistic |
| First Factor | |
 |
 |
where Source refers to the source of variation, DF refers to Degrees of Freedom, a is the number of levels (groups) of the first factor, SS refers to Sum of Squares, and MS refers to the Mean Squares.
Next is the second factor
| Source | DF | Mean Squares | F-statistic |
| First Factor | |
 |
 |
where b is the number of levels (groups) of the second factor. Next is the interaction between the first and second factors.
| Source | DF | Mean Squares | F-statistic |
| Interaction |  |
 |
 |
and lastly the Within-cell Error or residual source of variation
| Source | DF | Mean Squares | F-statistic |
| Error |  |
 |
 |
where n is the number of experimental units for each group. Note that if the sample size differs for one or more groups (levels),then the design would be unbalanced and this formula does not work to determine the degrees of freedom. The total degrees of freedom for the two-way ANOVA is simply N – 1, where N is the sample size for the entire problem; a little algebra shows that N may be calculated as

Unbalanced designs
An unbalanced design implies that observations are missing value for one or more groups. What to do if data are missing? Decision depends on how the data are missing (see Chapter 5). For example, if data are missing at random with respect to treatment, then this should not affect inference. If data are missing not at random, then inference, logically, must be impacted. Calculating the ANOVA, moreover, becomes a different matter. In the one-way ANOVA, no real problem arises although setting up contrasts among the levels requires a weighting term to be factored into the calculations. For higher-level ANOVA involving two or more factors the sums of squares for treatment effects are no longer simple partitioning into the different sources of variation. The sources overlap and the order by which the Factors enter into the statistical model now affects the calculations. Thus, while setting up the calculations for the balanced design is straight-forward, perhaps surprisingly, if group sizes differ, this simple relationship for calculating the degrees of freedom, sums of squares, and Mean squares become an unsolvable problem. This problem is largely solved by the general linear model.
Questions
- Based on the results of a two-way ANOVA, the error sums of squares (SSE) was computed to be 160. If we ignore one of the factors and perform a one-way ANOVA using the same data, will the SSE be the same as in the two-way ANOVA, or will it increase? Decrease? Explain your choice.
- While conducting a two-way ANOVA, you conclude that a statistically significant interaction exists between factor 1 and factor 2. What should be your next step? Do you drop the interaction term from the model and redo the analysis or do you report the results of factor effects including the non-significant interaction?
Quiz Chapter 14.2
Sources of variation
Chapter 14 contents
5 – Experimental design
Beyond numbers.
During this course, you will learn about statistics, yes, but my hope and goal for your experience in this class is much more than that: statistical reasoning. To have statistical reasoning skills, you need to be comfortable with the context of how data are acquired, ie, data acquisition. It’s not just about knowing how an instrument performs, eg, under or over the limits of quantification characteristics of the instrument lead to censored missing values, missing not at random (MNAR). In a broad stoke view, data are obtained from two kinds of studies: observational studies and experimental (manipulative) studies. what a correctly designed experiment can tell you about the world, and how a poorly designed experiment works against you. At the end of the semester, you should be familiar with the issues of Randomization, Control, Independence, and Replication.
The basics explained.
Experimental design is a discipline within statistics concerned with the analysis and design of experiments. Design is intended to help research create experiments such that cause and effect can be established from tests of the hypothesis. We introduced elements of experimental design in Chapter 2.4. I recommend a quick re-read: We talk about the different types of bias that can affect research. We also point out parts of the problem you’ll need to think about when planning a project, so you can avoid or reduce bias from the start.
Note 1: Just the highlights from Chapter 2.4: use randomization, blinding, and control measures in the study design. Different strategies may be needed depending on the type of bias.
Here, we expand our discussion of experimental design. We begin with review of definitions and an outline of an important concept in statistics. First, we need to be clear about why we measure or conduct experiments. We do so to collect data (datum is the singular) about a characteristic or trait from a population. Data are observations: they include observations and measurements from instruments. At their best, data are the “facts” of science.
Measurement, Observation, Variables, Values.
Measurement is how we as scientists acquire our data (Chapter 3.4). The process of measuring involves the assignment of numbers, codes, or labels to observations according to rules established prior to any data collection (Stevens 1946, Houle et al 2011). Observations refer to the units of measurement, whereas variables are the characteristics or traits that are measured. A value refers to the particular number, score, or label assigned to a particular sample for a variable. Variables are generic, the thing being measured, values are specific to the subject or sample being measured for the variable. Each discipline in biology has its own set of variables and samples may or may not have different values for each variable measured. Variables are summarized as a statistic (eg, the sample mean), which is a number taken to estimate a parameter, which pertains to the population. Variables and parameters in statistics were discussed in Chapter 3.4. Because numbers or scores or labels can be assigned according to different rules, this means that variables may be measured on different kinds of scales or data types. The different kinds of data types were presented in Chapter 3.1.
Missing values.
A missing value refers to lack of a value for an observation or variable (Chapter 3.5). Censored values, a type of missing value, include observations for which limited or partial information is available, eg, range, while a missing value lacks any information about the true value.
Missing values can affect analysis and many R algorithms are sensitive or may fail to run in the presence of missing values. Missing data may be of three kinds, and one of them, missing not at random (MNAR), can substantially influence the analysis. MNAR implies some observations are missing because of a systematic bias. Instrument limits of quantification are an example of systematic bias — for example, spectrophotometric absorbance readings of zero for a colorimetric assay (eg, Bradford protein assay) may not represent complete absence of the target, but rather, the lower detection limits of the instrument or the assay method (0.1 mg protein/mL in this case).
The other kinds of missing values are missing completely at random (MCAR) and missing at random (MAR). MCAR implies there is no association between any element of the experiment and the absence of a value. Analysis on MCAR data sets may support unbiased conclusions. MAR includes the random errors that occur during data acquisition: data may be lost because of operator error or power outage (shudder). Unlike MNAR, analysis of MAR, like MCAR data sets may still result in unbiased conclusions.
Note 2: The word “may” is doing some heavy lifting here; obviously, the size of the data set influences whether this claim holds.
One consequence of missing values — a decision how best to handle the lost information. The options are either pairwise deletion or listwise deletion. Listwise means the entire row, all variables, are lost for any record with one or more missing values. You recorded root length, stem length, numbers of secondary roots, time to germinate, but the SPAD meter failed and there is no chlorophyl reading for seedling #212? Sorry, the entire row is deleted. Optionally, the missing data is deleted pairwise — only chlorophyl reading for #212 is lost, all other variables remain.
Users of R will quickly learn some algorithms immediately fail to run if not instructed how to process missing values. In some cases, missing values can be replaced by imputed values.
Note 3: This being an introduction to applied biostatistics, we won’t dwell on the pros and cons of imputation. Instead, I point interested readers to two heavily cited articles: Schafer 1999; Schafer and Graham 2002.
Cause & Effect.
Observations or measurements gathered under controlled conditions (experiments) are essential if we are to answer questions about populations, to separate cause and effect, where one or more events is directly the result of another factor, as opposed to anecdote, a story about an event which, by itself, cannot be used to cause from association (eg, spurious correlations, see Ch 16.2). Recall that anecdotal evidence typically comes from personal experience, where observations may be obtained by non-systematic methods. Well designed experiments, in the classical sense, permit discrimination among competing hypotheses in large part because observations are collected according to strict rules. Well developed hypotheses tested by well-designed experiments permit ruling out alternative explanations (sensu Pratt [1964] strong inference). Observational studies, or epidemiology studies if we are talking about investigations of risk assessment, also may contribute to discussions of cause and effect (see history of smoking by Doll 1998).
Medicine is replete with stories about how a patient showed a particular set of symptoms, and how a physician applied a set of diagnostic protocols. An outcome was achieved, and the physician reports the outcome and circumstances related to the patient to her colleagues. This is an example of a case study, and the focus of investigation is the individual, the patient. The doctor’s report will sound like, “I tried the standard treatment given the diagnosis, and the patient’s symptoms diminished, but later returned. I tried a higher dose, but the patient’s symptoms persisted unabated.” No inferences are made to a wider set of individuals and the report is anecdotal. If observations are made on several patients, this may be a case series.
In ecology, a field biologist may notice a six-legged adult frog (Scott 1999, Alvarez et al 2021) — since frogs typically have four legs, the six-legged frog attracts the biologist’s eye and he jots down the circumstances in which the frog were found: relative humidity, air temperature, ground temperature, where the frogs was found (on lower leaf of a philodendron plant). A water source near where the frog was found is tested for pH with a meter the biologist carries, and a water sample is taken for later testing of herbicides. The frog is collected so that it can be checked for skin parasites. Upon further inspection, the frog did indeed have parasites known to cause deformities in other frog species. However, note that this example too, is a case study. Although the biologist makes additional observations, any conclusions about why the frog has six legs is anecdotal.
From these case studies, no conclusions can be drawn. We cannot say why the patient failed to respond to treatment, nor can we say why the frog has six legs. Why? Because these are singular events, and a variety of explanations can be given as to their causes — importantly, no controls are available, so there’s no way to distinguish among possibilities.
From such anecdotes, however, experiments can be designed. The physician may decide to recruit additional patients with the diagnosed illness and apply the standard treatment to see if her anecdote is a single, unique event, or more indicative of a problem with the treatment. The biologist may collect other frogs from the area near where he found the six-legged frog and check to see if they, too, have the parasites. If additional patients fail to respond to the treatment, then the singular even is more likely to be a phenomenon. If the normal frogs also have similar levels of the parasite then it is unlikely that these parasites caused the malformed frog. With this simple step (recruiting similar patients, finding additional frogs), we can begin to make inferences about cause and effect and in some cases, to generalize our findings.
This is the objective of most statistical procedures, the concept of sampling from a reference population and making distinctions between groups within the sample. The difference between observational and experimental studies then is how the subjects are selected with respect to the groups. In an experiment, the researcher controls and decides which subject receives the treatment, therefore, allocation to groups is manipulated by the researcher. In contrast, subjects included in an observational study have already been “assigned” to a group, but not by us. Assignment to groups, smokers or non smokers, Type II diabetes or no diabetes (etc.), is done by nature.
Now, I do not wish to imply that research that cannot be generalized back to a reference population are worthless. Far from it. In fact, there is a strong argument for specificity. For example, much basic biological research depends on work or model organisms, which in turn may be further partitioned into specific genetic lines (cf. discussion in Rothman et al 2013). And my goodness, what we have learned about the devastation to oceanic islands like Guam when the brown tree snake was introduced (Fritts and Rodda 1998). Strictly speaking, what has happened to Guam is a case history. But no one would argue that what has happened to Guam cannot happen to Hawaii and other oceanic islands (eg, United States Federal law 384-108 “Brown Tree Snake Control and Eradication Act of 2004”). In other words, even from case histories, generalizations can sometimes be made.
There can also be real reasons to ignore the issue of generality. One benefit of specificity is experimental control. Transgenic lines may differ by single gene knockout or by gene duplication, and clearly the aim of such studies is to evaluate the function (hence purpose) of the gene product (or its absence) on some phenotype. In this sense it may not seem important that an transgenic mouse is not representative of a wild outbred mouse population. However, this argument is fundamentally one of expedience — such studies do result in specific results, results that cannot be generalized beyond the strains involved. It ignores the issue of genetic background — all of the genes that affect a trait in addition to the candidate gene under study (Sigmund 2000; Lariviere et al 2001). Transgenic mice of different inbred strains or their hybrids may have very different alleles at other genes that may influence a phenotype, hence, the results of the gene knockdown or other engineering result in different outcomes. Results of genetic manipulations on inbred strains, no matter how sophisticated, the conclusions are strain- or hybrid cross-specific. Thus, although technically and financially difficult, conclusions are better, more generalizable, when conducted with many different inbred lines and verified in outbred mouse populations precisely because genetic background often influences function of single genes (Sigmund 2000; Lariviere et al 2001).
“Causal criteria:” Logic of causation in medicine.
This section is in progress. Just a list of key points and references
Throughout this text, emphasis on the power of experimentation is emphasized. Well designed experiments …
Henle-Koch’s postulates (1877, 1882), working on tuberculosis reported a set of causal criteria to establish link between a microorganism and a disease, are the following:
- The microorganism must be found in abundance in all organisms suffering from the disease, but should not be found in healthy organisms.
- The microorganism must be isolated from a diseased organism and grown in pure culture.
- The cultured microorganism should cause disease when introduced into a healthy organism.
- The microorganism must be reisolated from the inoculated, diseased experimental host and identified as being identical to the original specific causative agent.
Robert Koch wrote these more than 100 years ago, so, clearly, understanding of infectious disease has improved. Evan’s postulates, quoted from A Dictionary of Epidemiology, 5th edition (pp. 86-87).
- Prevalence of the disease should be significantly higher in those exposed to the hypothesized cause than in controls not so exposed.
- Exposure to the hypothesized cause should be more frequent among those with the disease than in controls without the disease—when all other risk factors are held constant.
- Incidence of the disease should be significantly higher in those exposed to the hypothesized cause than in those not so exposed, as shown by prospective studies.
- The disease should follow exposure to the hypothesized causative agent with a normal or log-normal distribution of incubation periods.
- A spectrum of host responses should follow exposure to the hypothesized agent along a logical biological gradient from mild to severe.
- A measurable host response following exposure to the hypothesized cause should have a high probability of appearing in those lacking this before exposure (eg, antibody, cancer cells) or should increase in magnitude if present before exposure. This response pattern should occur infrequently in persons not so exposed.
- Experimental reproduction of the disease should occur more frequently in animals or humans appropriately exposed to the hypothesized cause than in those not so exposed; this exposure may be deliberate in volunteers, experimentally induced in the laboratory, or may represent a regulation of natural exposure.
- Elimination or modification of the hypothesized cause should decrease the incidence of the disease (eg, attenuation of a virus, removal of tar from cigarettes).
- Prevention or modification of the host’s response on exposure to the hypothesized cause should decrease or eliminate the disease (eg, immunization, drugs to lower cholesterol, specific lymphocyte transfer factor in cancer).
- All of the relationships and findings should make biological and epidemiological sense.
Fredericks, D. N., & Relman, D. A. (1996). Sequence-based identification of microbial pathogens: a reconsideration of Koch’s postulates. Clinical microbiology reviews, 9(1), 18-33.
Correlation (association) does not imply causation, a well-worn truism in any application of critical thinking skills. Conversely, causation does imply association (correlation); If a change in one variable directly changes another variable, there will be a statistical association between the two variables. Thus, a correlation between two variables is necessary, but not sufficient evidence for cause and effect between two variables.
Note 4: Association is the more general term for a possible relationship between two or more variables. A correlation in statistics generally refers to a linear association (Chapter 16); the aforementioned truism should be restated as association (or statistical relationship) does not imply causation.
However, sometimes association does point to a cause. A familiar example is association between tobacco cigarette smoking causes lung cancer. Surgeon General Luthar Terry’s 1964 report (link to document in National Library of Medicine), presented a strong case linking smoking to elevated risk of lung cancer and coronary artery disease.
Bradford Hill’s guidelines to evaluate causal effects based on epidemiology (Hill 1965, see also Sussar 1999, Fedak et al 2015). Set of necessary and sufficient conditions, inductive reasoning.
- Strength of association
- Consistency of observed association
- Specificity of association
- Temporal relationship of the association
- Biological gradient, eg, a dose-response curve
- Biological plausibility
- Coherence, the cause and effect inference should not conflict with what is known about the etiology of a disease.
Follows and extends David Hume’s (1739) causation criteria: association (Hill #1), cause precedes effect (Hill #4), direction of connection.
Validity.
An obvious objective of research is to reach valid conclusions about fundamental questions. A helpful distinction between the specific and the generalizable experiment is to recognize there are two forms of validity in research: internal validity and external validity (Elwood 2013). Internal validity is the quality of a designed study that determines whether cause and effect can be determined. Random assignment of subjects to treatment groups enhances the internal validity of the study. External validity relates to how general the assessment of cause and effect can be to other populations. Thus, random sampling from a reference population has to do with whether or not the study has external validity.
Additional definitions.
We proceed now with definitions. We use the term population in a special and restrictive way in statistics. Our definition includes the one you are already familiar with, but it also means more than that.
Populations are the entire group of individuals that you want to investigate. In statistics, the entire groups is actually the entire class with the observation — so if we are referring to the average body weight of house mice, we’re actually referring to the body weight as the population — it’s a subtle distinction, not essential for our introduction to biostatistics. When we conduct experiments and apply statistical tests on collected data, we generally intend to make inferences (draw conclusions) from our results back to the population.
Population has a strict application in statistics, but the definition also includes our general understanding of the word population. For example, Examples of a population in the general sense one may refer to include: .… the entire human population existing today .… the entire collection of U.S. citizens. .… all the individuals in an entire species. .… all individuals in a population of a species (eg, house mice in a dairy barn in Hawai’i) .… all of us in this classroom (if we are ONLY interested in US) If you could measure the entire population then there would be no need to do (or learn) statistics! Populations usually are in the thousands, millions, or billions of individuals. Here, population is used in the everyday sense that we think of — a collection of individuals that share a characteristic.
A more formal definition of “population” in statistics reads as follows: A statistical population is the complete set of possible measurements on a trait or characteristic corresponding to the entire collection of sampling units for which conclusions are intended.
To conclude, in this class, when we talk about population, we will generally be using it in the everyday sense of the word. However, keep in mind that the definition is more restrictive than that and the key is to identify what sampling units are measured.
Conclusions.
This is only the beginning, the basics of experimental design. Beginning with RA Fisher‘s 1935 book, The Design of Experiments (nine editions, some freely accessible via internet search), which is still very much worth reading, entire books are written on the subject, as you can well imagine.
Note 5: Fisher’s The Design of Experiments concerned experimental design, randomization, blocking, and replication, particularly from perspective of agriculture research. Most readers of this eBook likely know that RA Fisher’s broader career absolutely included eugenics and hereditarian views about human populations and race. Those views are not in The Design of Experiments, which is largely about methods and statistical framework for inference.
We will also return to the subject of Experimental Design throughout the book. We will return to random sampling in Chapter 5.5. Next we discuss distinctions between experiments and observational studies with respect to sampling of populations.
A bit of a disclaimer here before proceeding; while I cite several papers for examples in experimental design in Chapter 5, reader’s should not read into this that I am either criticizing or endorsing the published experiments. Experimental design will always have elements of compromise — the trick of course is knowing which choices influence validity (Thompson and Panacek 2006).
Questions.
- Define in your own words the following terms
- reference population
- subjects
- specific versus general conclusions
- random sampling
- convenience sampling
- haphazard sampling
- research validity
- Revisit our cell experiment, “What is the sampling unit in the following cell experiment?” How would you change this experiment so that there will be biological and not just technical replication?
- Describe the type of sampling for each research scenario described?
- All African snails on a staircase at Chaminade University are collected on a Thursday evening.
- All African snails on a staircase at Chaminade University are collected every Thursday evening for six months.
- All African snails on all staircases at Chaminade University are collected.
- African snails are studied in the lab, then returned to the areas from which they were collected. Days later, the researcher collects snails from the same area.
- African snails are studied in the lab, then returned to the areas from which they were collected. Days later, the researcher collects snails from a different area.
- The Chaminade University campus is divided into grids. Grids that include stairwells are marked. Before collecting snails, the researcher randomly selects from the list of grids and searches for snails only in those grids selected from the list.
Figure 1. Giant African Snail (Lissachatina fulica, formerly Achatina fulica). Image by M. Dohm.
- This next scenario may be evaluated by you for potential sources of bias. Review the list of bias listed above. A researcher wants to do a population count of feral cats on campus. Feral cats are active at night, so he decides to set up a feeding station near a light post. The researcher sits all night in a parked car yards away and watches the feeding station for visits by cats. The researcher repeats these observations over the course of a week, moving the feeding station to different campus locations each night, and reports the total number of cats seen during the week as an estimate of the population size. Be able to discuss this study in terms of potential and actual bias.
Quiz
Including the quiz on this page, a total of 65 questions among the several subchapters, a mix of true or false and multiple choice question format.
Quiz Chapter 5
Experimental design