3.1 – Data types
Understanding data: Types, measurement, and use in analysis.
.
Data? Data refers to collections of facts, information, or statistics about an object. Data are either quantitative (numbers) or qualitative (observed properties that cannot be summarized by numbers). Data are measured and analyzed for research or reports to be used as evidence in support or against some hypothesis or for some other decision making arena (medicine, policy). Measurement implies a systematic effort to assign a numerical value to the thing that is measured; measurement units are standard quantities used to describe the same kinds of things. Examples of measurement units include kilograms (mass), meter (length), liter (volume), and Celsius (temperature).
An observation, then, is a single occurrence of something, the variable, we measure or count of gather information about. A unit of observation is the level at which the measure is taken: a single cell, a biopsy containing grams of tissue, one flower among many flowers on a tree, the individual, the family, the community, the population, the ecosystem, … the planet, the solar system, …. If the time period over which the observation may take place varies, then the interval of time may be the unit.
Data also implies a means to code or structure information so that it can be analyzed. Raw data refers to unprocessed collection of information about an object, which then needs to go through data processing in order to be useful in the next steps. If you look more closely, you’ll see that considerable effort is made to standardize data formats for analytical purposes. Good examples of such standards are available in clinical research and genomics.
In statistics, we recognize data which belongs to either of two data types: quantitative or qualitative. We will return to data types repeatedly throughout our statistics journey — knowing which type you directs you to the types of statistical tests that are available to you. In brief, quantitative data types implies estimation of parameters about a population, hence, this data type points the user towards use of parametric statistics; qualitative data types do not lead to estimates of parameters, but provide counting of observations in categories.
Quantitative.
.
Discrete, countable or meristic, example: five Conus shells (Fig 1)
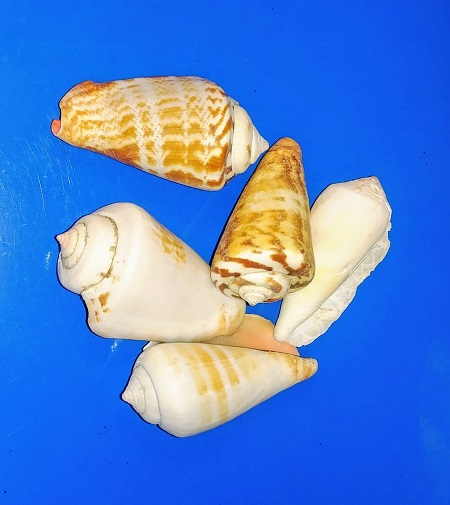
Figure 1. Five Conus shells, example of discrete data type. Click image to view full sized image.
Interval, example: degrees Celsius
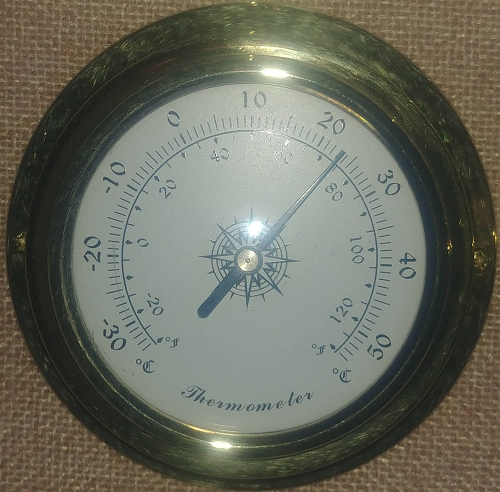
Figure 2. Analog thermometer showing office temperature at 23.1 Celsius, example of interval data type. Click image to view full sized image.
Another classical interval scale example is time of day — there’s no meaningful zero time. We can measure amount of time — hours, minutes, seconds, etc, between intervals, but there is no absolute absence of time.
Ratio, true zero, examples: body mass, capillary blood glucose reading (Fig 3), degrees Kelvin, relative humidity (Fig 4).
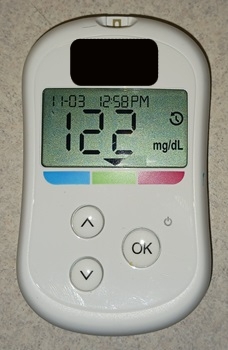
Figure 3. Blood glucose reading, 122 mg/dL. Click image to view full sized image.
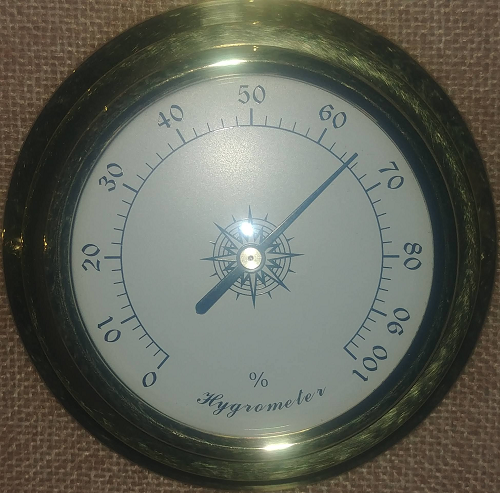
Figure 4. Analog hygrometer showing office humidity at 65 percent, example of ratio data type. Click image to view full sized image.
I’m a fan of competitive sports and also have interested in measures of performance like running times in lizards! (eg, Beck et al 1998).
Qualitative.
.
Binomial, yes/no, example: a person either has the condition or they do not; hydrangea petals are sometimes blue (Fig 5).

Figure 5. Flowers (Hydrangea) are blue or they are not, example of binomial data type. Click image to view full sized image.
Nominal, example: names of species. Wolves and dogs are members of Canis lupus and Canis familiaris, respectively, house cats, Felis catus, are not (Fig 6).

Figure 6. Cats are neither dogs or wolves, example of nominal data type. Click image to view full sized image.
Note 1: Identifying variables, id number, are unique identification numbers or other for each record (individual) in the data set. These variables are categorical, nominal data type. Examples of id numbers include Social Security numbers, student identification numbers, driver’s license numbers, etc. Note that id numbers would only rarely be considered objects of study because they are typically assigned by researcher to subjects and not properties of subjects. Exceptions may include testing for impacts of anonymization procedures (for example, see Koll et al 2022).
Ordinal, ranked, example: Likert scale:
Biologists should know their data types before proceeding with an experiment.
- Strongly disagree
- Disagree
- No opinion
- Agree
- Strongly agree
Although common practice, caution is warranted when converting Likert categories into numerical scale, for example, Strongly agree = 4, Strongly disagree = -4, and so on. Because it is ordinal, the difference between 4 and -4 can’t be calculated as the difference because it is ranked, not the numerical scale. (See Carifio and Perla 2007, h/t Karen Grace-Martin, The Analysis Factor.)
Examples to try.
.
In R, load the data set diabetic (survival package, which is loaded as part of R Commander), then view the variables.
For more about R data sets, see Part 6 Working with an included data set in Mike’s Workbook for Biostatistics
R code
data(diabetic, package="survival")
.
R Commander (Fig 7)
Rcmdr: Data → Data in packages → Read data set from an attached package… Double click survival, the list of data sets should appear in the right-hand panel. Select diabetic, then click OK button.
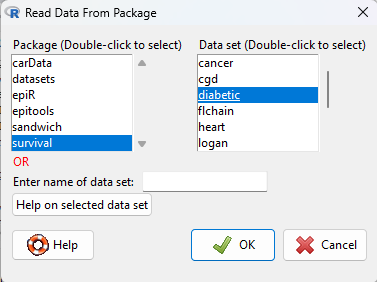
Figure 7. Screenshot Rcmdr Read data from package menu.
View the data by clicking on Rcmdr’s View data set button, or, better, submit the following command in R
head(diabetic)
.
R output
  id laser age   eye trt risk  time status
1  5 argon  28  left   0    9 46.23      0
2  5 argon  28 right   1    9 46.23      0
3 14 xenon  12  left   1    8 42.50      0
4 14 xenon  12 right   0    6 31.30      1
5 16 xenon  9   left   1   11 42.27      0
6 16 xenon  9  right   0   11 42.27      0
.
The command head() displays by default the first six rows of a data frame.
It’s a good idea to read up on the data set. Data sets included with R packages often provide a help page. submit the following command in R to load the help page.
help(diabetic)
.
The data set was subjects with high risk diabetic retinopathy, “each patient had one eye randomized to laser treatment and the other eye received no treatment.”
What are the data types for the variables? I’ll give you the a couple to start. The first column with entries 1 – 6 is called the index variable; it’s row 1, row 2, etc. of the data set and technically is not a data set variable (since it’s assignment is arbitrary) — R adds this for you. Next, the variable labeled id — clearly we see numbers, so we might think meristic, but because these are labels for the subjects, the proper data type is nominal! Try the rest on your own, scroll down to end of the page for best answers.
Questions.
.
1. Assign examples of units of measurement for each kind of measurement.
- Darts tossed, Distance from center.
- Shells, width, length.
- InfraRed temperature device readings.
- Body weight.
- Lung volume.
- Tomato color morphs (green, yellow).
- Tomato root length, stem length.
- Systolic blood pressure.
- Blood arsenic levels.
- Body Mass Index.
- Body Mass Index scale, for example NIH: underweight, normal, overweight, obese.
Assign the data type and provide examples of units of measurement.
2. What are the data types for
- Basal 5 hour fasting plasma glucose-to-insulin ratio in mice.
- Four inbred strains of mice.
- Height, in inches of six women.
- Atmospheric carbon dioxide, CO2, levels from Mauna Loa for the month of December, in parts-per-million, ppm.
- Body temperature readings, deg C, from IR device on forehead or back of the throat.
- Six mollusk species.
- The index variable in the following data set:
mom dad1 67.0 78.52 66.5 75.53 64.0 75.04 58.5 75.05 68.0 74.06 66.5 74.0
Answers to Examples to try
laser: binomial, there were two types, xenon or argon
age: ratio, years
eye: binomial
trt: binomial, no treatment (0) or laser (1)
risk: ordinal
time: ratio, time to event, number of months
status: binomial
Quiz Chapter 3.1
Data types
Chapter 3 contents
.
16.5 – Instrument reliability and validity
Introduction
What’s in a measure? We’ve talked about measurement extensively, eg, Chapter 3.3 . As review, a measure is simply the result of some process used to quantify an object or item of interest. Instead of a number, a measure may return a classification: for a given sample unit, the unit may be categorized as meeting the definition and therefore given a “yes” or it does not (“no”), a dichotomous response. The method used to obtain the measurement is called the instrument. An instrument may indeed be an instrument like a sphygmomanometer or a thermocycler equipped with fluorescent optics. Instrument in this context however also includes questionnaires or surveys intended.
In biology and biomedical research, there are thousands of kinds of measurements one has to choose among depending on the question at hand. In many cases choices are straightforward: in morphometrics, the instruments of choice will be lengths and areas and shapes quantified by rulers and application of well-defined geometry equations. Where multiple measurement approaches apply, reliability analysis can help decide which method to use, or, importantly, whether the different approaches agree. For example, Kruse et al (2017) compared ultra sound and magnetic resonance imaging measurements of Achilles tendon cross-sectional area; they found that although both methods were internally consistent, the methods consistently yielded different results.
In other arenas, the choice of instrument will be less clear. For example, doctors use a questionnaire to rank cardiac patients for attention in perioperative care, the care a surgical patient receives from admittance to release from the hospital, to improve patient outcomes. The questionnaire will include a number of questions intended to provide a summary picture of each patient so that if resources are limited, the most at risk patients may get priority. To the extent the questionnaire in fact is a useful discriminant, then the instrument may benefit both hospital and patients.
In conducting measures one selects instruments that provide valid results. That is, provided the instruments are maintained and well-calibrated, use of a sphygmomanometer by a trained technician will return accurate and valid measures of a subject’s blood pressure. Survey questions also can be evaluated for validity although the extent to which survey questions measure what is intended may be more complex. For example, if the intent is to ascertain a subject’s chance (ie, risk) of graduating from college in the next year, how useful would the following question be if administered to a room filled with first-year students?
Survey question: How old are you now?
Simple enough question, but immediately, several questions come to mind. Do we want our responses in years, months, days, hours, minutes, or seconds? What about for those individuals that know only approximately when they were born, ie, in many parts of the world, registration of birth is irregular. So, we may even wonder about how necessary it is we ask this question of college students in the first place, eg, do we really want to trigger our subjects for a case in which most of our subjects are about the same age?
Perhaps we decide this is important information to ask. When do you start counting? Most Western cultures start the clock at zero when the baby is born. In China and many other Eastern Asian countries, people are born at one. In India, once a person reaches a year plus six months, the person would be considered two years old, whereas in the USA, the person would still be considered one until the second birthday. Thus, depending on the person’s culture identity, responses to this simple question may differ by as much as a year.
Types of reliability
Regardless of instrument, all measures contain error. Hence, even a valid instrument may not return an accurate measure for each subject. The concept of instrument reliability is concerned with error of measurement. Reliability may be defined in at least four contexts:
- internal consistency
- inter-rater (also called inter-observer reliability)
- parallel-forms
- test-retest
For an instrument to show internal consistency, this implies that the survey has multiple questions that pertain to the same concept or topic, but written in different ways to reveal effects of word choice, for example. Inter-rater reliability refers to an instrument that when used by different observers (eg, science fair judges), the observers give the same or at least consistent scores for the same test. Parallel forms reliability implies that two surveys on, perhaps scientific literacy in high school students, yield the same conclusions even though each survey has different questions. Test-retest reliability is a straight-forward concept — if the instrument is repeated, are the same scores achieved?
Split-half reliability
Split-half reliability is a method for assessing a measurement tool’s internal consistency by determining if different parts of it produce consistent results. This is done by splitting a single measure (eg, a test or a set of behavioral observations) into two comparable halves, calculating a score for each half, and then finding the correlation between the two sets of scores. For example, the ManyDogs research consortium used split-half design to investigate whether or not dogs consistently interpret human pointing instructions (Espinoza et al 2023). Alternatives to split-half reliability include test-retest reliability, parallel-forms reliability, and inter-rater reliability — see Chapter 12.3, Chapter 14.3 — (Cook and Beckman 2006). These methods assess different aspects of consistency, such as stability over time (test-retest), consistency between two different but equivalent tests (parallel-forms), or agreement between observers (inter-rater). Both ICC and split-half reliability address consistency. The primary distinction is that split-half reliability is a method for assessing the internal consistency of a single test administration, while the Intraclass Correlation Coefficient (ICC) is a more flexible statistical measure used to assess absolute agreement or consistency across different measures, time points, or, most commonly, between multiple raters.
For split-half reliability, a product moment correlation is first calculated between the score of the two halves. A high correlation indicates that all items or observations within the measure are likely assessing the same underlying construct, while a low correlation suggests inconsistency. The correlation coefficient is typically adjusted using the Spearman-Brown prediction formula to estimate the reliability of the original full-length measure.
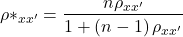
Equation of the Spearman-Brown prediction (or prophecy) formula.
Reliability estimators
In general, correlation-type measures can be used to quantify the extent of reliability (also termed reproducibility or repeatability). The product moment correlation is used to quantify the relationship between two measures where there is clear distinction between the two variables. For example, to quantify the association between body weight and height, the proper correlation to calculate would be the product moment correlation because it is clear that a measure of weight goes with the variable weight whereas height measures goes with the variable height.
But it is less clear which variable should go first in the calculation when you have repeat measures of essentially the same thing. Which goes first, the first observation of sprint running speed over a 100 meters of the second measure of the same person’s performance? Logically, we may say take the first as the X variable and the second as the Y variable, but there is no mathematical justification.
For a more challenging example, consider measures of body mass on male and female birds that are mated, and the researcher wants to assess whether there is a correlation between male and female weight — which variable goes first in the analysis, male weight or female weight? In such cases the intraclass correlation coefficient may be used (Chapter 12.3, Chapter 16.4). The intraclass correlation can be estimated as the ratio of the variance of interest over the sum of the variance of interest plus the variance error. Interest in the case of sprint running would be the two (or more) trials or for the bird weights the variable of interest is weights of male and female birds within a mated pair. The formula for ICC in this context is given by

where k is the number of repeat measures and MS refers to the mean squares from the one-way ANOVA and B and e refer to between (among) subjects and e is the error or within subjects variability.
Cronbach’s alpha is a reliability measure that quantifies the internal consistency of items in a survey or instrument by calculating the average among these items. Cronbach’s alpha will tend to increase as the intercorrelations among test items increase, and in this sense can be taken as an internal consistency estimate of the reliability of test scores.

where k is the number of items, si2 is the variance of the i-th item, and sT2 is the variance of the total score after summing all items.
Cronbach’s alpha is one of the oldest measures, and at least in part because of how long ago it was introduced, is very common as a measure of reliability. However, there are other estimators and in some aspects these perform better than Cronbach’s alpha.
Reliability statistics like Cronbach’s alpha are available in the R package psych. See also R package agRee.
Example. Judging of posters
library(psych)
alpha(myJudge)
Output from R
Reliability analysis
Call: alpha(x = myJudge)

raw_alpha std.alpha G6(smc) average_r S/N   ase  mean   sd median_r
     0.74      0.74   0.59       0.59 2.9  0.21   2.8  1.1     0.59

lower alpha upper 95% confidence boundaries
0.33 0.74 1.15
Questions
1. Write up three learning outcomes for this page. Hint: Point your favorite generative AI to this page and ask for help.
2. A team of behavioral ecologists designs a new test to measure problem-solving ability in domestic dogs. Each dog is given a puzzle box, and the experimenters record the time taken to retrieve a treat and number of errors made. They want to ensure that their measurement instrument is reliable before drawing conclusions about individual differences in cognition.
Question: Describe how you would test the reliability of this instrument. Which type(s) of reliability would be most appropriate (split-half, test–retest, parallel-forms, inter-rater), and why?
Quiz Chapter 16.5
Instrument reliability and validity
Chapter 16 contents
3.4 – Estimating parameters
Introduction.
What you will find on this page. Definitions for constants, variables, and parameters as used in data analytics. Statistical bias and the concept of unbiased estimators are discussed. The different types of error are introduced along with definitions of accuracy and precision. Statistics used to quantify error are presented in the next section, Chapter 3.4.
Estimating parameters.
Parameters belong to populations; they are fixed but unknown. Parameters are characteristics of populations: the typical average height and weight of five year old children; What is the normal range of values for height and weight of five year old children; average and range of gene expression of TP53 in epithelial lung cells of 50 year old non-smoking humans; etc. Because we generally do not have at our disposal surveys — census — of entire populations for these characteristics, we sample and calculate descriptive statistics for a subset of individuals from populations: these statistics, the mean height, range of height, etc., are variables. We expect average height, range of height, etc., to change, to vary, from sample to sample. A constant, as the word implies, is not variable and remains unchanged.
We estimate parameters (means, variances) from samples of observations from a population. Intuitively then, our estimates are only as good as how representative of the population the sample is. Statistics allows us to be more precise: we can define “how good” our estimates are by asking about, and quantifying, the accuracy and precision of our estimates.
Notwithstanding the notion of “personalized medicine,” our goal in science is to understand cause and effect among sets of observations on samples from a population. We ask, what is the link between lung cancer and smoking? We know that smoking tobacco cigarettes increases risk of cancer, but not everyone who smokes will get cancer (Pesch et al., 2012). Tumorigenic risk is in part mediated by heredity (cf. Trifiletti et al 2017). That’s one way we run into problems in statistics: the biological phenomenon is complicated in ways we are not yet aware of, and thus samples drawn from populations are heterogeneous. Put another way, we think there is one population, but there may be many distinct populations. By chance, repeated samples drawn from the population include individuals with different risk associated with heredity.
As an aside, this is precisely why the concept of personalized medicine is important. Medical researchers have learned that some people with breast cancer respond to treatment with trastuzumab, a monoclonal antibody, but others do not (review in Valabrega et al 2007). Responders have more copies of a gene, copy number variation, for an EGF-like receptor called HER2. In contrast, non-responders to trastuzumab have fewer copies of this receptor (and are said to be HER2-negative in an antibody test for HER2). Thus, we speak about people with breast cancer as if the disease is the same, and from a statistical point of view, we would assume that individuals with breast cancer are of the same population. But they are not — and so the treatment fails for some, but works for others. In this example, we have a mechanism or cause to explain why some do not respond; their breast cancer is not associated with increased copy numbers of HER2. And so in studies with breast cancer, statisticians may account for differences in HER2 status. Note: Fewer than 30% of breast cancer may have over-expression of HER2, (Bilous et al. 2003).
Clearly, HER2 status would be used by statisticians when drawing samples from population, and we would not mistake samples. But, in many other situations we are not aware of any differences and so we assume our samples come from the same population. Note that even with imperfect knowledge about samples, experimental design is intended to help mediate heterogeneous samples. For example, this is why treatment controls need to be used, or case controls are included in studies.
Random assignment to groups also is an attempt to control for unknowns: if random, then all treatment groups will likely include representatives of the numerous co-factors that contribute to risk.
Statisticians have an additional, technical burden: there are often a variety of ways (algorithms) to describe or make inferences about samples, and they are not equally capable of giving us “truth.” Estimates of a parameter are not going to be exactly the true value of the parameter! This is the problem of identifying unbiased ways to estimate parameters. In statistics, bias quantifies whether an algorithm to calculate a particular statistic (e.g., the mean or variance), is consistently too low or too high.
Random sampling.
Random sampling from the population is likely to be our best procedure for obtaining representative samples, but it is not foolproof (we’ll return to situations where random sampling fails to provide adequate samples of populations in Chapter 5.5 Importance of randomization in experimental design). However, a second concern is how to calculate the mean, how to calculate the variance. In the section on Descriptive Statistics (Chapter 3.2), we presented how to calculate the arithmetic mean — the simple average — but also introduced you to other calculations for the middle (e.g., median, geometric mean, harmonic mean). How to know which “middle” is correct?
Statisticians use the concept of bias — the simple arithmetic mean is an unbiased estimator of the population parameter, but a correction needs to be made to the calculation of sample variance to remove bias. Bias implies that the estimator systematically misses the target in some way. Good or “best” parameter estimates are, on average, going to be close to the actual parameter if we collected many samples of the population (this will depend on the sample size and the variability of the data). Earlier we introduced Bessel’s correction to the sample variance, divide the sum of squares by n – 1 and not N as we did for the population variance, so that it is an unbiased estimator of the sample variance. Thus, statisticians have worked out how well their statistical equations work as estimators; concepts of expected values or the expectation are used to evaluate how well an estimator works. In statistics, the expected value of a statistic is calculated by multiplying each of the possible outcomes by the likelihood each outcome will occur and then summing all of those values..
We need to add a bit more to our discussion about measurement and estimation.
Types of error.
To measure is to assign a number to something, a variable. Measurements can have multiple levels, but are of the four data types: nominal, ordinal, interval scale, and ratio scale. Nominal and ordinal types are categorical or qualitative; interval and ratio are continuous or quantitative. Errors in measurement represent differences between what is observed and recorded compared with the true value, i.e., the actual population value. With respect to measurement we distinguish between random errors and systematic errors. Random errors occur by chance, and are thus expected to vary from one measurement instance from another. Random error may lead to measures larger or smaller than the true value. Systematic errors are of a kind that can be attributed to failures of an experimental design or instrument.
Accuracy is reflected in the question: how close to the true value is our measure? Accuracy is distinct from precision, the concept of how clustered together are repeated values for the same measurement. All measurement has associated error, which may be divided into two kinds: random error and systematic error.
We tend to think of error in terms of mistakes, mistakes by us or as failure of the measurement process. However, in biology research, that is too restrictive of a meaning for error. First, experimental error occurs when the estimates derived from the samples — sample mean, sample variance — differ from the population parameters — population mean, population variance. Second, error in biology ranges from mistakes in data collection to real differences among individuals for a characteristic. The latter source, error among individuals, is of course, not a mistake, but rather, it’s the “very spice of life” (Cowper 1845). We’ll leave the study of individual differences, biological error, for later. This section is concerned with error in the sense of mistakes.
Random error includes things like chance error in an instrument leading to different repeat measures of the same thing and to the reality that individual differences exist for most biological traits. We minimize the effects of this kind of error by randomizing: we randomly select samples from populations; we randomly assign samples to treatment groups. Random error can make it hard to differentiate treatment effects. Random error decreases precision, the repeatability of measures. At worse, random error is conservative — it tends to mean we miss group differences, we conclude that the treatment (e.g., aspirin analgesics) has no effect on the condition (e.g., migraines). This kind of error is referred to as a Type II error (Chapter 8).
The experimental design remedy for random error is to increase sample size, a key conclusion drawn from power analysis on experiments, discussed in Chapter 11. The other type of error, systematic error, a type of bias, is more in line with the idea of errors being synonymous with mistakes. Uncalibrated instruments yield incorrect measures. And these kinds of errors lead us to make errors that can be more problematic. An example? Back in the early 1990s when I started research on whole animal metabolic rates (e.g., Dohm et al 1994, Beck et al 1995), we routinely set baseline carbon dioxide, CO2, levels to 0.035% of volume of dry air (350 ppm, parts per million), which reflected ambient levels of CO2 at the time (see Figure 4 in Chapter 4.6).
#NOAA monthly data from Mauna Loa Observatory
co2.1994 <- c(358.22, 358.98, 359.91, 361.32, 361.68, 360.80, 359.39, 357.42, 355.63, 356.09, 357.56, 358.87)
You are probably aware, today, background CO2 have increased considerably even since the 1980s. Data for 2021 (average 420 ppm — reporting just 2 significant figures) are provided below
co2.2021 <- c(415.49, 416.72, 417.61, 419.01, 419.09, 418.93, 416.9, 414.42, 413.26, 413.9, 414.97, 416.67)
source: Global Monitoring Lab, NOAA
Thus, if I naively compared rates of CO2 produced by an animal at rest,  , measured today against the data I gathered back in the 1990s without account for the change in background CO2 in my analysis, I will have committed a systematic error: values of on animals would be systematically higher than values for 1988 when I apply a baseline correction.
Examples of error.
One under-reported cost of next-generation sequencing technologies is that base calls, the process of assigning a nucleotide base to chromatogram peaks has more errors than traditional Sanger-based sequencing methods (Fox et al 2014). In “next-generation-sequencing” (NGS) methods, individual DNA fragments are assigned sequences, whereas Sanger methods took the average sequence of a collection of DNA fragments; thus, in principle, NGS methods should be able to characterize variation of mixtures of sequences in ways not available to traditional sequencing approaches. However, artifacts introduced in sample preparation and PCR amplification lead to base calling errors (Fox et al 2014).
Gene expression levels will differ among tissue types, thus mixed samples from different tissues will misrepresent gene expression levels.
Measurement of energy expenditure, oxygen uptake and carbon dioxide release by an organism, have long been sources of study in ecology and other disciplines. A classic measure is called basal metabolic rate, measured as the rate of oxygen consumption of an endothermic animal, post-absorptive (i.e., not digesting food), at rest but not sleeping, while the animal is contained within a thermal-neutral environment (Blaxter 1989).
Accuracy and precision.
Two properties of measurement are the accuracy of the measure and its precision. Accuracy is defined as the closeness of a measured value to its true value. Precision refers to the closeness of a second measure to the first, to the closeness of a third measure to the first and second, and so on. Precision refers to repeatability of measurement. We suggested use of the coefficient of variation, defined with examples in Chapter 3.2, as a way to quantify precision.
Consider the accuracy and precision of three volumetric pipettors: p1000, which has a nominal range between 100 and 1000 μL (microliters); p200, which has a range between 20 and 200 μL; p100, which has a range between 10 and 100 μL. Which of these three pipettors do you think would have the best accuracy and precision for dispensing 100 μL? We can test pipettors by measuring the mass of distilled water dispensed by the pipettor on an analytical balance. For 100 μL of distilled water at standard temperature and pressure conditions, the mass of the water would be 0.100 grams. The results are shown in the table, and a dot plot is shown in the figure to help us see the numbers.
Table 1. Mass (grams) of 100 μL of distilled water dispensed by three volumetric pipettors*
| p1000 | p200 | p100 | |
| 0.113 | 0.100 | 0.101 | |
| 0.114 | 0.100 | 0.100 | |
| 0.113 | 0.100 | 0.100 | |
| 0.115 | 0.099 | 0.101 | |
| 0.113 | 0.100 | 0.101 | |
| 0.112 | 0.100 | 0.100 | |
| 0.113 | 0.100 | 0.100 | |
| 0.111 | 0.100 | 0.100 | |
| 0.114 | 0.101 | 0.101 | |
| 0.112 | 0.100 | 0.100 | |
| mean: | 0.113 | 0.100 | 0.1004 |
| standard deviation: | 0.0012 | 0.0005 | 0.0005 |
*Temperature 21.5 °C, barometric pressure 76.28 cm mercury (elevation 52 meters). Data presented in Table 1 were not corrected to standard temperature or pressure.
Here is the code for the R run; assuming that you have started R commander, then copy and paste each line into the R Commander script window; if not, enter the script one line at a time in the R console. Recall that the hashtag, #, is used to add comment lines.
Note 1: A reminder: Don’t include the last two rows from Table 1 in your data set; these contain descriptive statistics and are not your data.
#create the variables
p1000 <- c(0.113, 0.114, 0.113, 0.115, 0.113, 0.112, 0.113, 0.111, 0.114, 0.112)
p100 <- c(0.101, 0.1, 0.1, 0.101, 0.101, 0.1, 0.1, 0.1, 0.101, 0.1)
p200 <- c(0.1, 0.1, 0.1, 0.099, 0.1, 0.1, 0.1, 0.1, 0.101, 0.1)
#create a data frame
pipet <- data.frame(p100,p200,p1000)
attach(pipet)
#stack the data
stackPipet <- stack(pipet[, c("p100","p200","p1000")])
#Add variable names
names(stackPipet) <- c("mass", "pipet")
#create the dot plot
with(stackPipet, RcmdrMisc::Dotplot(mass, by=pipet, bin=FALSE))
From Table 1 we see that the means for the p100 and p200 were both close to the target mass of 0.1 g. The mean for the p1000, however, was higher than the target mass of 0.1 g. A dot plot is a good way to display measurements (Fig. 1).
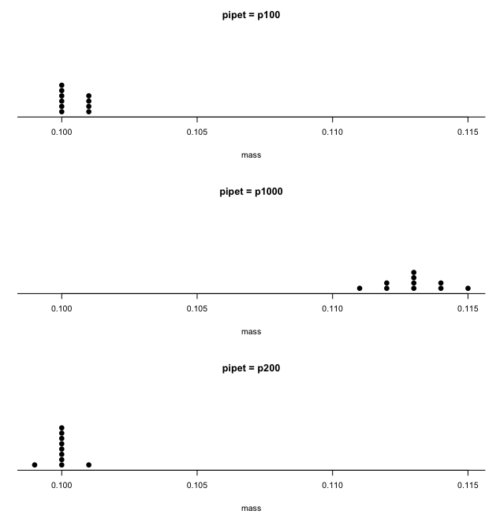
Figure 1. Dot plot of pipet results.
Note 2: Dotplot() is part of the RcmdrMisc package; if you are using the Rcmdr script window (please do!), then the functions in RcmdrMisc are already available and you wouldn’t need to use RcmdrMisc:: (package name plus double-colon operator) to call the Dotplot() function (more properly, referred to as namespaces). Thus, with(stackPipet, Dotplot(mass, by=pipet, bin=FALSE)) would work perfectly well within the Rcmdr script window.
From the dot plot we can quickly see that the p1000 was both inaccurate (the data fall well above the true value), and lacked precision (the values were spread about the mean value). The other two pipettors showed accuracy and looked to be similar in precision, although only two of ten values for the p200 were off target compared to four of ten values for the p100. Thus, we would conclude that the p200 was best at dispensing 100 microliters of water.
In the next chapter we apply statistics to estimate our confidence in this conclusion. In contrast to measurement, estimation implies calculation of a value. In statistics, estimates may be a point, e.g., a value of a collection of data, or an interval, e.g., a confidence interval.
Summary.
This is your first introduction into the concept of experimental design, as defined by statisticians! One of the key tasks for a statistical analyst is to have an appreciation for measurement accuracy and precision as established in the experiment. Precise and accurate measurement levels determine how well questions about the experiment can be answered. At one extreme, if a measure is imprecise, but accurate, then it will be challenging to quantify differences between a control group and a treatment group. At the other extreme, if the measure is precise, but inaccurate, the danger would be differences between the treatment and control group may be more likely, even when the groups are truly not different!
Questions.
- List the types of error in measuring mRNA expression levels on a gene for a sampling of cells from biopsy of normal tissue and a biopsy of a tumor. Assume use of NEXGEN methods for measuring gene expression. Distinguish between technical errors and biological errors.
- If confidence interval are useful for estimating accuracy, what statistic do we call to quantify precision?
Quiz Chapter 3.4
Estimating parameters
Chapter 3 contents
5 – Experimental design
Beyond numbers.
During this course, you will learn about statistics, yes, but my hope and goal for your experience in this class is much more than that: statistical reasoning. To have statistical reasoning skills, you need to be comfortable with the context of how data are acquired, ie, data acquisition. It’s not just about knowing how an instrument performs, eg, under or over the limits of quantification characteristics of the instrument lead to censored missing values, missing not at random (MNAR). In a broad stoke view, data are obtained from two kinds of studies: observational studies and experimental (manipulative) studies. what a correctly designed experiment can tell you about the world, and how a poorly designed experiment works against you. At the end of the semester, you should be familiar with the issues of Randomization, Control, Independence, and Replication.
The basics explained.
Experimental design is a discipline within statistics concerned with the analysis and design of experiments. Design is intended to help research create experiments such that cause and effect can be established from tests of the hypothesis. We introduced elements of experimental design in Chapter 2.4. I recommend a quick re-read: We talk about the different types of bias that can affect research. We also point out parts of the problem you’ll need to think about when planning a project, so you can avoid or reduce bias from the start.
Note 1: Just the highlights from Chapter 2.4: use randomization, blinding, and control measures in the study design. Different strategies may be needed depending on the type of bias.
Here, we expand our discussion of experimental design. We begin with review of definitions and an outline of an important concept in statistics. First, we need to be clear about why we measure or conduct experiments. We do so to collect data (datum is the singular) about a characteristic or trait from a population. Data are observations: they include observations and measurements from instruments. At their best, data are the “facts” of science.
Measurement, Observation, Variables, Values.
Measurement is how we as scientists acquire our data (Chapter 3.4). The process of measuring involves the assignment of numbers, codes, or labels to observations according to rules established prior to any data collection (Stevens 1946, Houle et al 2011). Observations refer to the units of measurement, whereas variables are the characteristics or traits that are measured. A value refers to the particular number, score, or label assigned to a particular sample for a variable. Variables are generic, the thing being measured, values are specific to the subject or sample being measured for the variable. Each discipline in biology has its own set of variables and samples may or may not have different values for each variable measured. Variables are summarized as a statistic (eg, the sample mean), which is a number taken to estimate a parameter, which pertains to the population. Variables and parameters in statistics were discussed in Chapter 3.4. Because numbers or scores or labels can be assigned according to different rules, this means that variables may be measured on different kinds of scales or data types. The different kinds of data types were presented in Chapter 3.1.
Missing values.
A missing value refers to lack of a value for an observation or variable (Chapter 3.5). Censored values, a type of missing value, include observations for which limited or partial information is available, eg, range, while a missing value lacks any information about the true value.
Missing values can affect analysis and many R algorithms are sensitive or may fail to run in the presence of missing values. Missing data may be of three kinds, and one of them, missing not at random (MNAR), can substantially influence the analysis. MNAR implies some observations are missing because of a systematic bias. Instrument limits of quantification are an example of systematic bias — for example, spectrophotometric absorbance readings of zero for a colorimetric assay (eg, Bradford protein assay) may not represent complete absence of the target, but rather, the lower detection limits of the instrument or the assay method (0.1 mg protein/mL in this case).
The other kinds of missing values are missing completely at random (MCAR) and missing at random (MAR). MCAR implies there is no association between any element of the experiment and the absence of a value. Analysis on MCAR data sets may support unbiased conclusions. MAR includes the random errors that occur during data acquisition: data may be lost because of operator error or power outage (shudder). Unlike MNAR, analysis of MAR, like MCAR data sets may still result in unbiased conclusions.
Note 2: The word “may” is doing some heavy lifting here; obviously, the size of the data set influences whether this claim holds.
One consequence of missing values — a decision how best to handle the lost information. The options are either pairwise deletion or listwise deletion. Listwise means the entire row, all variables, are lost for any record with one or more missing values. You recorded root length, stem length, numbers of secondary roots, time to germinate, but the SPAD meter failed and there is no chlorophyl reading for seedling #212? Sorry, the entire row is deleted. Optionally, the missing data is deleted pairwise — only chlorophyl reading for #212 is lost, all other variables remain.
Users of R will quickly learn some algorithms immediately fail to run if not instructed how to process missing values. In some cases, missing values can be replaced by imputed values.
Note 3: This being an introduction to applied biostatistics, we won’t dwell on the pros and cons of imputation. Instead, I point interested readers to two heavily cited articles: Schafer 1999; Schafer and Graham 2002.
Cause & Effect.
Observations or measurements gathered under controlled conditions (experiments) are essential if we are to answer questions about populations, to separate cause and effect, where one or more events is directly the result of another factor, as opposed to anecdote, a story about an event which, by itself, cannot be used to cause from association (eg, spurious correlations, see Ch 16.2). Recall that anecdotal evidence typically comes from personal experience, where observations may be obtained by non-systematic methods. Well designed experiments, in the classical sense, permit discrimination among competing hypotheses in large part because observations are collected according to strict rules. Well developed hypotheses tested by well-designed experiments permit ruling out alternative explanations (sensu Pratt [1964] strong inference). Observational studies, or epidemiology studies if we are talking about investigations of risk assessment, also may contribute to discussions of cause and effect (see history of smoking by Doll 1998).
Medicine is replete with stories about how a patient showed a particular set of symptoms, and how a physician applied a set of diagnostic protocols. An outcome was achieved, and the physician reports the outcome and circumstances related to the patient to her colleagues. This is an example of a case study, and the focus of investigation is the individual, the patient. The doctor’s report will sound like, “I tried the standard treatment given the diagnosis, and the patient’s symptoms diminished, but later returned. I tried a higher dose, but the patient’s symptoms persisted unabated.” No inferences are made to a wider set of individuals and the report is anecdotal. If observations are made on several patients, this may be a case series.
In ecology, a field biologist may notice a six-legged adult frog (Scott 1999, Alvarez et al 2021) — since frogs typically have four legs, the six-legged frog attracts the biologist’s eye and he jots down the circumstances in which the frog were found: relative humidity, air temperature, ground temperature, where the frogs was found (on lower leaf of a philodendron plant). A water source near where the frog was found is tested for pH with a meter the biologist carries, and a water sample is taken for later testing of herbicides. The frog is collected so that it can be checked for skin parasites. Upon further inspection, the frog did indeed have parasites known to cause deformities in other frog species. However, note that this example too, is a case study. Although the biologist makes additional observations, any conclusions about why the frog has six legs is anecdotal.
From these case studies, no conclusions can be drawn. We cannot say why the patient failed to respond to treatment, nor can we say why the frog has six legs. Why? Because these are singular events, and a variety of explanations can be given as to their causes — importantly, no controls are available, so there’s no way to distinguish among possibilities.
From such anecdotes, however, experiments can be designed. The physician may decide to recruit additional patients with the diagnosed illness and apply the standard treatment to see if her anecdote is a single, unique event, or more indicative of a problem with the treatment. The biologist may collect other frogs from the area near where he found the six-legged frog and check to see if they, too, have the parasites. If additional patients fail to respond to the treatment, then the singular even is more likely to be a phenomenon. If the normal frogs also have similar levels of the parasite then it is unlikely that these parasites caused the malformed frog. With this simple step (recruiting similar patients, finding additional frogs), we can begin to make inferences about cause and effect and in some cases, to generalize our findings.
This is the objective of most statistical procedures, the concept of sampling from a reference population and making distinctions between groups within the sample. The difference between observational and experimental studies then is how the subjects are selected with respect to the groups. In an experiment, the researcher controls and decides which subject receives the treatment, therefore, allocation to groups is manipulated by the researcher. In contrast, subjects included in an observational study have already been “assigned” to a group, but not by us. Assignment to groups, smokers or non smokers, Type II diabetes or no diabetes (etc.), is done by nature.
Now, I do not wish to imply that research that cannot be generalized back to a reference population are worthless. Far from it. In fact, there is a strong argument for specificity. For example, much basic biological research depends on work or model organisms, which in turn may be further partitioned into specific genetic lines (cf. discussion in Rothman et al 2013). And my goodness, what we have learned about the devastation to oceanic islands like Guam when the brown tree snake was introduced (Fritts and Rodda 1998). Strictly speaking, what has happened to Guam is a case history. But no one would argue that what has happened to Guam cannot happen to Hawaii and other oceanic islands (eg, United States Federal law 384-108 “Brown Tree Snake Control and Eradication Act of 2004”). In other words, even from case histories, generalizations can sometimes be made.
There can also be real reasons to ignore the issue of generality. One benefit of specificity is experimental control. Transgenic lines may differ by single gene knockout or by gene duplication, and clearly the aim of such studies is to evaluate the function (hence purpose) of the gene product (or its absence) on some phenotype. In this sense it may not seem important that an transgenic mouse is not representative of a wild outbred mouse population. However, this argument is fundamentally one of expedience — such studies do result in specific results, results that cannot be generalized beyond the strains involved. It ignores the issue of genetic background — all of the genes that affect a trait in addition to the candidate gene under study (Sigmund 2000; Lariviere et al 2001). Transgenic mice of different inbred strains or their hybrids may have very different alleles at other genes that may influence a phenotype, hence, the results of the gene knockdown or other engineering result in different outcomes. Results of genetic manipulations on inbred strains, no matter how sophisticated, the conclusions are strain- or hybrid cross-specific. Thus, although technically and financially difficult, conclusions are better, more generalizable, when conducted with many different inbred lines and verified in outbred mouse populations precisely because genetic background often influences function of single genes (Sigmund 2000; Lariviere et al 2001).
“Causal criteria:” Logic of causation in medicine.
This section is in progress. Just a list of key points and references
Throughout this text, emphasis on the power of experimentation is emphasized. Well designed experiments …
Henle-Koch’s postulates (1877, 1882), working on tuberculosis reported a set of causal criteria to establish link between a microorganism and a disease, are the following:
- The microorganism must be found in abundance in all organisms suffering from the disease, but should not be found in healthy organisms.
- The microorganism must be isolated from a diseased organism and grown in pure culture.
- The cultured microorganism should cause disease when introduced into a healthy organism.
- The microorganism must be reisolated from the inoculated, diseased experimental host and identified as being identical to the original specific causative agent.
Robert Koch wrote these more than 100 years ago, so, clearly, understanding of infectious disease has improved. Evan’s postulates, quoted from A Dictionary of Epidemiology, 5th edition (pp. 86-87).
- Prevalence of the disease should be significantly higher in those exposed to the hypothesized cause than in controls not so exposed.
- Exposure to the hypothesized cause should be more frequent among those with the disease than in controls without the disease—when all other risk factors are held constant.
- Incidence of the disease should be significantly higher in those exposed to the hypothesized cause than in those not so exposed, as shown by prospective studies.
- The disease should follow exposure to the hypothesized causative agent with a normal or log-normal distribution of incubation periods.
- A spectrum of host responses should follow exposure to the hypothesized agent along a logical biological gradient from mild to severe.
- A measurable host response following exposure to the hypothesized cause should have a high probability of appearing in those lacking this before exposure (eg, antibody, cancer cells) or should increase in magnitude if present before exposure. This response pattern should occur infrequently in persons not so exposed.
- Experimental reproduction of the disease should occur more frequently in animals or humans appropriately exposed to the hypothesized cause than in those not so exposed; this exposure may be deliberate in volunteers, experimentally induced in the laboratory, or may represent a regulation of natural exposure.
- Elimination or modification of the hypothesized cause should decrease the incidence of the disease (eg, attenuation of a virus, removal of tar from cigarettes).
- Prevention or modification of the host’s response on exposure to the hypothesized cause should decrease or eliminate the disease (eg, immunization, drugs to lower cholesterol, specific lymphocyte transfer factor in cancer).
- All of the relationships and findings should make biological and epidemiological sense.
Fredericks, D. N., & Relman, D. A. (1996). Sequence-based identification of microbial pathogens: a reconsideration of Koch’s postulates. Clinical microbiology reviews, 9(1), 18-33.
Correlation (association) does not imply causation, a well-worn truism in any application of critical thinking skills. Conversely, causation does imply association (correlation); If a change in one variable directly changes another variable, there will be a statistical association between the two variables. Thus, a correlation between two variables is necessary, but not sufficient evidence for cause and effect between two variables.
Note 4: Association is the more general term for a possible relationship between two or more variables. A correlation in statistics generally refers to a linear association (Chapter 16); the aforementioned truism should be restated as association (or statistical relationship) does not imply causation.
However, sometimes association does point to a cause. A familiar example is association between tobacco cigarette smoking causes lung cancer. Surgeon General Luthar Terry’s 1964 report (link to document in National Library of Medicine), presented a strong case linking smoking to elevated risk of lung cancer and coronary artery disease.
Bradford Hill’s guidelines to evaluate causal effects based on epidemiology (Hill 1965, see also Sussar 1999, Fedak et al 2015). Set of necessary and sufficient conditions, inductive reasoning.
- Strength of association
- Consistency of observed association
- Specificity of association
- Temporal relationship of the association
- Biological gradient, eg, a dose-response curve
- Biological plausibility
- Coherence, the cause and effect inference should not conflict with what is known about the etiology of a disease.
Follows and extends David Hume’s (1739) causation criteria: association (Hill #1), cause precedes effect (Hill #4), direction of connection.
Validity.
An obvious objective of research is to reach valid conclusions about fundamental questions. A helpful distinction between the specific and the generalizable experiment is to recognize there are two forms of validity in research: internal validity and external validity (Elwood 2013). Internal validity is the quality of a designed study that determines whether cause and effect can be determined. Random assignment of subjects to treatment groups enhances the internal validity of the study. External validity relates to how general the assessment of cause and effect can be to other populations. Thus, random sampling from a reference population has to do with whether or not the study has external validity.
Additional definitions.
We proceed now with definitions. We use the term population in a special and restrictive way in statistics. Our definition includes the one you are already familiar with, but it also means more than that.
Populations are the entire group of individuals that you want to investigate. In statistics, the entire groups is actually the entire class with the observation — so if we are referring to the average body weight of house mice, we’re actually referring to the body weight as the population — it’s a subtle distinction, not essential for our introduction to biostatistics. When we conduct experiments and apply statistical tests on collected data, we generally intend to make inferences (draw conclusions) from our results back to the population.
Population has a strict application in statistics, but the definition also includes our general understanding of the word population. For example, Examples of a population in the general sense one may refer to include: .… the entire human population existing today .… the entire collection of U.S. citizens. .… all the individuals in an entire species. .… all individuals in a population of a species (eg, house mice in a dairy barn in Hawai’i) .… all of us in this classroom (if we are ONLY interested in US) If you could measure the entire population then there would be no need to do (or learn) statistics! Populations usually are in the thousands, millions, or billions of individuals. Here, population is used in the everyday sense that we think of — a collection of individuals that share a characteristic.
A more formal definition of “population” in statistics reads as follows: A statistical population is the complete set of possible measurements on a trait or characteristic corresponding to the entire collection of sampling units for which conclusions are intended.
To conclude, in this class, when we talk about population, we will generally be using it in the everyday sense of the word. However, keep in mind that the definition is more restrictive than that and the key is to identify what sampling units are measured.
Conclusions.
This is only the beginning, the basics of experimental design. Beginning with RA Fisher‘s 1935 book, The Design of Experiments (nine editions, some freely accessible via internet search), which is still very much worth reading, entire books are written on the subject, as you can well imagine.
Note 5: Fisher’s The Design of Experiments concerned experimental design, randomization, blocking, and replication, particularly from perspective of agriculture research. Most readers of this eBook likely know that RA Fisher’s broader career absolutely included eugenics and hereditarian views about human populations and race. Those views are not in The Design of Experiments, which is largely about methods and statistical framework for inference.
We will also return to the subject of Experimental Design throughout the book. We will return to random sampling in Chapter 5.5. Next we discuss distinctions between experiments and observational studies with respect to sampling of populations.
A bit of a disclaimer here before proceeding; while I cite several papers for examples in experimental design in Chapter 5, reader’s should not read into this that I am either criticizing or endorsing the published experiments. Experimental design will always have elements of compromise — the trick of course is knowing which choices influence validity (Thompson and Panacek 2006).
Questions.
- Define in your own words the following terms
- reference population
- subjects
- specific versus general conclusions
- random sampling
- convenience sampling
- haphazard sampling
- research validity
- Revisit our cell experiment, “What is the sampling unit in the following cell experiment?” How would you change this experiment so that there will be biological and not just technical replication?
- Describe the type of sampling for each research scenario described?
- All African snails on a staircase at Chaminade University are collected on a Thursday evening.
- All African snails on a staircase at Chaminade University are collected every Thursday evening for six months.
- All African snails on all staircases at Chaminade University are collected.
- African snails are studied in the lab, then returned to the areas from which they were collected. Days later, the researcher collects snails from the same area.
- African snails are studied in the lab, then returned to the areas from which they were collected. Days later, the researcher collects snails from a different area.
- The Chaminade University campus is divided into grids. Grids that include stairwells are marked. Before collecting snails, the researcher randomly selects from the list of grids and searches for snails only in those grids selected from the list.
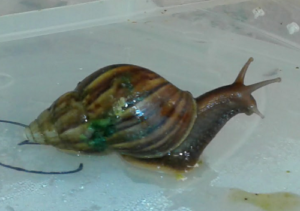
Figure 1. Giant African Snail (Lissachatina fulica, formerly Achatina fulica). Image by M. Dohm.
- This next scenario may be evaluated by you for potential sources of bias. Review the list of bias listed above. A researcher wants to do a population count of feral cats on campus. Feral cats are active at night, so he decides to set up a feeding station near a light post. The researcher sits all night in a parked car yards away and watches the feeding station for visits by cats. The researcher repeats these observations over the course of a week, moving the feeding station to different campus locations each night, and reports the total number of cats seen during the week as an estimate of the population size. Be able to discuss this study in terms of potential and actual bias.
Quiz
Including the quiz on this page, a total of 65 questions among the several subchapters, a mix of true or false and multiple choice question format.
Quiz Chapter 5
Experimental design