17.6 – ANCOVA – analysis of covariance
Introduction
Analysis of covariance (ANCOVA) is intended to help with analysis of designs with categorical treatment variables on some response (dependent) variable, but a known confounding variable is also present. Thus, the researcher is also likely to know of additional ratio scale variables that covary with the response variable and, moreover, must be included in the experimental design in some way.
Take for example the well-known relationship between body size and whole-animal metabolic rate as measured by rates of carbon dioxide production or rates of oxygen consumption for aerobic organisms. We may be interested in how addition or blocking of stress hormones affects resting metabolism; we may be interested in comparing men and women for activity metabolism, and so on. We’d like to know if the regressions were the same (eg, metabolic rate covaried with body mass in the same way — that is, the slope of the relationship was the same).
This situation arises frequently in biology. For example, we might want to know if male and female birds have different mean field metabolic rates, in which case we might be tempted to use a one-way ANOVA or t-test (since one factor with two levels). However, if males and females also differ for body size, then any differences we might see in metabolic rate could be due to differences in metabolic rate are confounded by differences in the covariable body size. We already discussed one approach to correction: calculate a ratio. Thus, a logical approach to correcting or normalizing for the covariation would be to divide body mass (units of kilograms) into metabolic rate (eg, volume of oxygen, O2, consumed), and make comparisons, say, among different species, on mass-specific trait ( ). However, because the regression between mass and metabolic rate is allometric, i.e., not equal to one, the ratio does not, in fact normalize for body mass. We made this point in Chapter 6.2, and remarked that analysis of covariance ANCOVA was a solution.
ANCOVA allows you to test for mean differences in traits like metabolic rate between two or more groups, but only after first accounting for covariation due to another variable (eg, body size). However, ANCOVA makes the assumption that relationship between the covariable and the response variable is the same in the two groups. This is the same as saying that the regression slopes are the same. We discussed how to use t-test to test hypothesis of equal slopes between regression models in Chapter 17.5, but a more elegant way is to include this in your model.
Example
We return to our sample of 13 tadpoles (Rana pipiens), hatched in the laboratory. I’ve repeated the data set in this page, scroll or click here.
Our linear model was  and a scatterplot of the data set is shown in Figure 1 (a repeat of Figure 3 from Chapter 17.5, but now points identified to developmental group).
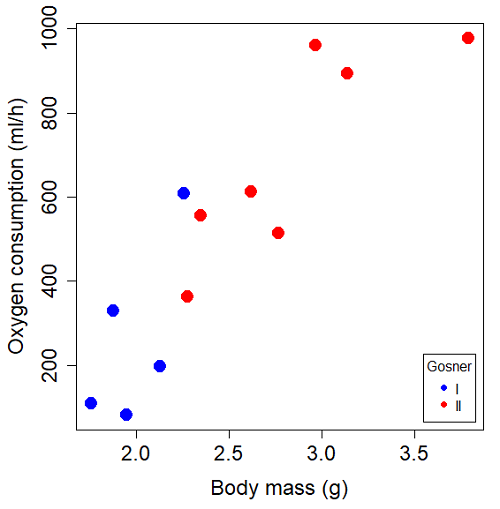
Figure 1. Scatterplot of oxygen consumption by R. pipiens tadpoles vs body mass (g) by developmental group (Gosner stages I or II).
The project looked at whether metabolism as measured by oxygen consumption was consistent across two developmental stages. Metamorphosis in frogs and other amphibians represents profound reorganization of the organism as the tadpole moves from water to air. Thus, we would predict some cost as evidenced by change in metabolism associated with later stages of development. Figure 2 shows a box plot of tadpole oxygen consumption by Gosner (1960) developmental stage (Figure 2 is a repeat of Figure 4 Chapter 17.5).
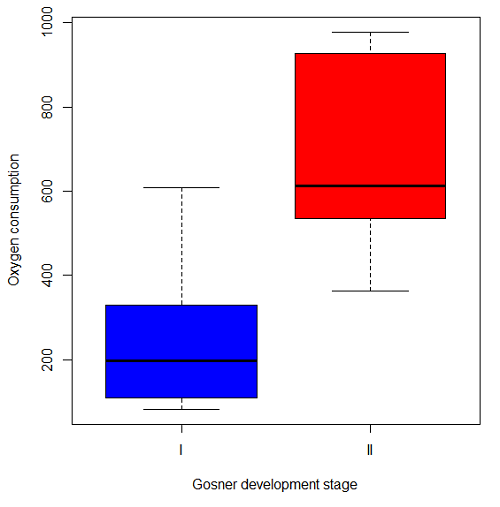
Figure 2. Copy of Figure 4, Chapter 17.5; boxplot of oxygen consumption of R. pipiens tadpoles by Gosner developmental stages.
Looking at Figure 2 we see a trend consistent with our prediction; developmental stage may be associated with increased metabolism. However, older tadpoles also tend to be larger, and the plot in Figure 2 does not account for that. Thus, body mass is a confounding variable in this example. There are several options for analysis here (eg, ANCOVA), but one way to view this is to compare the slopes for the two developmental stages. While this test does not compare the means, it does ask a related question: is there evidence of change in rate of oxygen consumption relative to body size between the two developmental stages? The assumption that the slopes are equal is a necessary step for conducting the ANCOVA.
So, divide the data set (Table 1) into two groups by developmental stage (12 tadpoles could be assigned to one of two developmental stages; one was at a lower Gosner stage than the others and so is dropped from the subset.
Table 1.  and
 of 12 R. pipiens tadpole larvae by Gosner developmental stage.
Gosner stage I
|
|
| 1.76 | 109.41 |
| 1.88 | 329.06 |
| 1.95 | 82.35 |
| 2.13 | 198 |
| 2.26 | 607.7 |
Gosner stage II
| Body mass | |
| 2.28 | 362.71 |
| 2.35 | 556.6 |
| 2.62 | 612.93 |
| 2.77 | 514.02 |
| 2.97 | 961.01 |
| 3.14 | 892.41 |
| 3.79 | 976.97 |
The slopes and standard errors we obtained in Chapter 17.5 were
| Gosner Stage I | Gosner stage II | |
| slope | 750.0 | 399.9 |
| standard error of slope | 444.6 | 111.2 |
Make a plot (Figure 3).
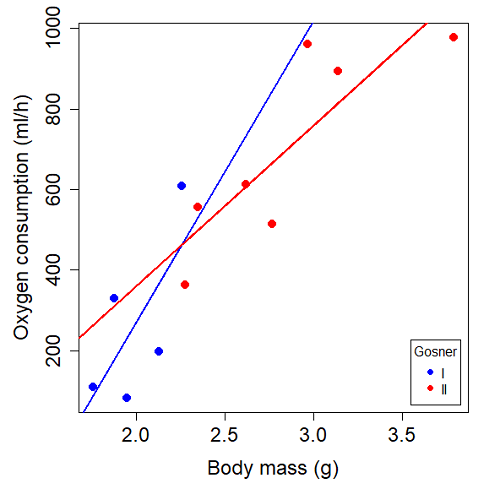
Figure 3. Scatterplot with best-fit regression lines of by for Gosner State I (closed circle, solid line) and Gosner Stage II (open circle, dashed line) R. pipiens tadpoles.
R code for plot in Figure 3.
#Used Rcmdr scatterplot(), then modified code
scatterplot(VO2~Body.mass | Gosner, regLine=FALSE, smooth=FALSE,
boxplots=FALSE, xlab="Body mass (g)", ylab="Oxygen consumption (ml/h)",
main="", cex=1.4, cex.axis=1.5, cex.lab=1.5, pch=c(19,19), by.groups=TRUE,
col=c("blue","red"), grid=FALSE,
legend=list(coords="bottomright"), data=Tadpoles)
#Get regression equations for groups, subset by Gosner
abline(lm(VO2~Body.mass, data=Stage01), lty=1, lwd=2, col="blue")
abline(lm(VO2~Body.mass, data=Stage02), lty=1, lwd=2, col="red")
Returning to the important question, are the two slopes statistically indistinguishable (Ho: bI = bII), where bI is the slope for the Gosner Stage I subset and bII is the slope for the Gosner Stage II subset? We look at the plot, and since the lines cross, we tend to see a difference. Of course, we need to consider that our perception of slope differences may simply be chance, especially because the sample size is small. Proceed to test.
R code
The ANCOVA is a new ANOVA model where the factor variables are adjusted or corrected for the effects of the continuous variable.
R code for ANCOVA example, crossed or interaction model.
tadpole.1 <- lm(VO2 ~ Body.mass*Gosner, data=example.Tadpole)
summary(tadpole.1)
Anova(tadpole.1, type="II")
Output
summary(tadpole.1)

Call:
lm(formula = VO2 ~ Body.mass * Gosner, data = example.Tadpole)

Residuals:
    Min      1Q   Median      3Q      Max
-167.80 -117.93    13.81   94.66   214.65

Coefficients:
                       Estimate   Std. Error   t value    Pr(>|t|)
(Intercept)             -1231.6       783.0     -1.573    0.1544
Body.mass                 750.0       390.7      1.919    0.0912 .
Gosner[T.II]              790.4       859.2      0.920    0.3845
Body.mass:Gosner[T.II]   -350.1       409.5     -0.855    0.4174
---
Signif. codes: 0 '***' 0.001 '**' 0.01 '*' 0.05 '.' 0.1 ' ' 1

Residual standard error: 155.8 on 8 degrees of freedom
(1 observation deleted due to missingness)
Multiple R-squared: 0.821, Adjusted R-squared: 0.7539
F-statistic: 12.23 on 3 and 8 DF, p-value: 0.002336
The coefficients for the first factor (GII) and then the differences in the coefficient for the second factor. You can just add the second coefficient to the first so they’re on the same scale.
Anova Table (Type II tests)

Response: VO2
                  Sum Sq   Df    F value     Pr(>F)
Body.mass         330046    1    13.6030   0.006146 **
Gosner              5630    1     0.2321   0.642908
Body.mass:Gosner   17736    1     0.7310   0.417423
Residuals 194102 8
---
Signif. codes: 0 '***' 0.001 '**' 0.01 '*' 0.05 '.' 0.1 ' ' 1
Suggests interaction is not significant, i.e., the slopes are not different.
We can then proceed to check to see if the intercepts are different, now that we’ve confirmed no significant difference in slope.
R code for ANCOVA as additive model
tadpole.2 <- lm(VO2 ~ Body.mass + Gosner, data=example.Tadpole)
summary(tadpole.2)
Anova(tadpole.2, type="II")
Output
> summary(tadpole.2)

Call:
lm(formula = VO2 ~ Body.mass + Gosner, data = example.Tadpole)

Residuals:
    Min       1Q    Median      3Q      Max
-163.12  -125.53    -20.27   83.71   228.56

Coefficients:
                   Estimate   Std. Error     t value    Pr(>|t|)
(Intercept)         -595.37       239.87      -2.482     0.03487 *
Body.mass            431.20       115.15       3.745     0.00459 **
Gosner[T.II]          64.96       132.83       0.489     0.63648
---
Signif. codes: 0 '***' 0.001 '**' 0.01 '*' 0.05 '.' 0.1 ' ' 1

Residual standard error: 153.4 on 9 degrees of freedom
(1 observation deleted due to missingness)
Multiple R-squared: 0.8047, Adjusted R-squared: 0.7613
F-statistic: 18.54 on 2 and 9 DF, p-value: 0.0006432

Anova(tadpole.2, type="II")
Anova Table (Type II tests)

Response: VO2
              Sum Sq    Df    F value      Pr(>F)
Body.mass     330046     1    14.0221   0.004593 **
Gosner          5630     1     0.2392   0.636482
Residuals     211839     9
---
Signif. codes: 0 '***' 0.001 '**' 0.01 '*' 0.05 '.' 0.1 ' ' 1
Note 1. There is no test of interaction in the added model. This model would be appropriate IF the slopes are equal.
Instead of the interaction, or as added, try a nested model, with body mass nested within stage.
tadpole.3 <- lm(VO2 ~ Body.mass/Gosner, data=example.Tadpole)

summary(tadpole.3)

Call:
lm(formula = VO2 ~ Body.mass/Gosner, data = example.Tadpole)

Residuals:
    Min       1Q    Median      3Q      Max
-168.66  -131.14    -20.28   90.33   225.36

Coefficients:
                 Estimate      Std. Error    t value Pr(>|t|)
(Intercept)           -575.10      319.51     -1.800   0.1054
Body.mass              423.65      162.50      2.607   0.0284 *
Body.mass:Gosner[T.II]  21.95       63.73      0.344   0.7384
---
Signif. codes: 0 '***' 0.001 '**' 0.01 '*' 0.05 '.' 0.1 ' ' 1

Residual standard error: 154.4 on 9 degrees of freedom
(1 observation deleted due to missingness)
Multiple R-squared: 0.8021, Adjusted R-squared: 0.7581
F-statistic: 18.24 on 2 and 9 DF, p-value: 0.0006823
Gets the true coefficient (nested lm() version).
The two test different hypotheses.
lm(VO2 ~ Body.mass * Gosner) tests whether or not the regression has a nonzero slope.
lm(VO2 ~ Body.mass */Gosner) test whether or not the slopes and intercepts from different factors are statistically significant.
Questions
- Write up three learning outcomes for this page. Hint: Point your favorite generative AI to this page and ask for help.
- An OLS approach was used for the analysis of tadpole oxygen consumption body mass. Consider the RMA approach — would that be a more appropriate regression model? Explain why or why not.
- Consider an experiment in which you plan to administer a treatment that has a carry-over effect. For example, Compare and contrast “crossed” and “nested” designs.
- True or False. The nested design option for the ANCOVA assumes the slopes for the two groups of tadpoles for the regression line of by are equal. Explain your choice.
- Metabolic rates like oxygen consumption over time are well-known examples of allometric relationships. That is, many biological variables (eg, is related as aMb, where M is body mass, slope b is scaling exponent), and best evaluated on log-log scale. Repeat the analysis above on log10-transformed and for
- crossed design (eg, tadpole.1 model)
- added design (eg, tadpole.2 model)
- nested design (eg, tadpole.3 model)
- Create the plot and add the fitted lines from crossed design to the plot.
Note 2. About log-transform of a variable. The most straight-forward tact is to create two new variables. For example,
lgVO2 <- log10(VO2)
Another option is to transform the variables within the call to lm() function. For example, try
lm(log10(VO2) ~ log10(Body.mass ), data=example.Tadpole)
Hint: don’t forget to attach your data set to avoid having to call the variable as, for example, example.Tadpole$VO2
Quiz Chapter 17.6
ANCOVA - analysis of covariance
Data sets
Oxygen consumption,  , of Anuran tadpoles, dataset=
example.Tadpole
| Gosner | Body mass | VO2 |
|---|---|---|
| NA | 1.46 | 170.91 |
| I | 1.76 | 109.41 |
| I | 1.88 | 329.06 |
| I | 1.95 | 82.35 |
| I | 2.13 | 198 |
| II | 2.28 | 362.71 |
| I | 2.26 | 607.7 |
| II | 2.35 | 556.6 |
| II | 2.62 | 612.93 |
| II | 2.77 | 514.02 |
| II | 2.97 | 961.01 |
| II | 3.14 | 892.41 |
Gosner refers to Gosner (1960), who developed a criteria for judging metamorphosis staging.
Chapter 17 contents
- Introduction
- Simple Linear Regression
- Relationship between the slope and the correlation
- Estimation of linear regression coefficients
- OLS, RMA, and smoothing functions
- Testing regression coefficients
- ANCOVA – Analysis of covariance
- Regression model fit
- Assumptions and model diagnostics for Simple Linear Regression
- References and suggested readings (Ch17 & 18)
6.2 – Ratios and probabilities
Introduction
One common objective of a research project is comparison between quantities: one effective way to communicate a comparison is to construct a ratio. Ratios provide a standardized way to compare different data sets. The purpose of this page is introduce the wealth of types of ratios used for quantification of comparisons, from indexes to ratios.
Let’s review our definitions again. An event is some occurrence. As you know, a ratio is one number, the numerator, divided by another called the denominator. A proportion is a ratio where the numerator is a part of the whole. A rate is a ratio of the frequency of an event during a certain period of time. A rate may or may not be a proportion, and a ratio need not be a proportion, but proportions and rates are all kinds of ratios. If we combine ratios, proportions, and/or rates, we construct an index.
Ratios
Yes, data analysis can be complicated, but we start with this basic idea. Much of the statistics is based on frequency measures, eg, ratios, rates, proportions, indexes, and scales.
Ratios are the association between two numbers, one random variable divided by another. Ratios are used as descriptors and the numerator and denominator do not need to be of the same kind. Business and economics are full of ratios. For example, return on investment (ROI), eg, earnings equals net income divided by number of shares outstanding, the Price-Earnings, or P/E ratio, is the ratio of the price of a stock to the earnings per stock, as well as many others are used to summarize performance of a business, and to compare performance of one business against another.
Note 1: ROI also stands for region of interest — a sample in a data set identified by the analyst for a particular interest. Often refers to a specific area in an image.
Ratios are deceptively convenient way to standardize a variable for comparisons, ie, how many times one number contains another. For example, when estimating bird counts for different areas, or different birding effort (intensity, time searched), we may correct counts by accounting for area in which counts were made or the total time spent counting, for a per-unit ratio (Liermann et al 2004).
Practice: There were 1,326 day undergraduate students enrolled in 2014 at Chaminade University of Honolulu and the Sullivan Library added 8469 new items (ebooks, journals, etc,) to its collection during 2014. What is the ratio of new items per student?

Data collected from Chaminade University website at www.chaminade.edu on 3 July 2014.
Practice: For another example, what is ratio of annual institutional aid a student at Chaminade University may expect to receive compared to a student at Hawaii Pacific University?

Thus, in 2014, Chaminade offered more than twice the institutional aid to its students then does HPU (both institutions are private universities, data from retrieved on 3 July 2014 from www.cappex.com).
Relative change, Fold-change and orders of magnitude
It’s common practice to report on the amount of change between two quantities recorded over time. Relative change (often percentage) describes change relative to an initial value. Relative change in root length b
To make percent increase (decrease), simply multiple 100%.
(1) 
The ratio between two quantities, eg, to compare mRNA expression levels of genes from organisms exposed to different conditions, researchers may report fold-change. Fold change is often reported as log base 2 change.

Why log base 2? Symmetry and ease of reporting. A doubling becomes +1 and a halving becomes -1. Without log transformation, doubling is +2, but having is +0.5.
Relative change is useful for reporting percent changes, fold change for ratios, although if the change is small in amount, then relative change can be misleading, eg, value goes from five to ten, then the relative change is 100%, but effectively, a very small change in absolute units. Similarly, fold change becomes a large, but likely meaningless comparison, if the denominator is close to zero.
An example of calculation of fold change. Rates of the expression from cells exposed to heavy metal divided by expression under basal conditions. Gene expression under different treatments may be evaluated by calculating fold-change as the log base2 of the ratio of expression of a gene for one treatment divided by expression of same gene from control conditions. Copper is an essential trace element, but excess exposure to copper is known to damage human health, including chronic obstructive pulmonary disease. One proposed mechanism is that cell injury promotes an epithelial-to-mesenchymal shift. In a pilot study (N.I.H. INBRE P20RR016467), we investigated gene expression changes by quantitative real-time polymerase chain reaction (qPCR) in a rat lung Type II alveolar cell line exposed to copper sulfate compared to unexposed cells. Record cycle threshold values, CT, for each gene, where CT is number of cycles required for the fluorescent signal to exceed background levels; CT is inversely proportional to amount of cDNA (mRNA) in the sample. Genes investigated were ECAD, FOXC2, NCAD, SMAD, SNAI1, TWIST, and VIM, with ATCB as reference gene. ECAD expression is marker of epithelial cells, whereas FOXC2, NCAD, SNAI1, TWIST, and VIM expression marker of mesenchymal cells. After calculating  values, geometric means of normalized values of three replicates each are shown in Table 1.
Note 2: The  is a relative change quantification that relates the PCR signal of the normalized gene of interest (GOI) transcript in a treatment group to another sample, eg, an untreated control. is now a widely applied method to analyze the relative changes in gene expression from real-time quantitative PCR experiments (relevant papers on the analysis method, Livak and Schmittgen (2001) and Schmittgen and Livak (2008) have been cited more than 230K times, Pubmed 2026. See also Rao et al (2013).)
Log-transform, introduced in Ch03.2, was used because gene expression levels vary widely on the original scale and any log-transform will reduce the variability. log-base 2 specifically was used for fold-change in particular because it is easy to interpret (eg, see discussion in Bergemann and Wilson 2011 and Corliss et al 2024), and provides symmetry (all log-transforms provide this symmetry). For example, log(1/2, 2) returns -1, while log(2/1, 2) returns +1. Thus, base 2, we see a decrease by half or doubling of original scale is a fold change of  . In contrast,
log(1/2, 10) returns -0.301, while log(2/1, 10) returns +0.301 — which is perfectly accurate, but deceptive to interpret.
log-base 2 is commonly employed to calculate the number of bits — binary digits — for a given number of values. For example, 8 bits (0 – 7), then log2(8-1), and R returns 2.807355. Round, add 1, and the number of bits is3. Related R code, if want to calculate and print te binary representation of of a number, eg, 8, try
myBits <- intToBits(8)
paste(as.character(myBits),collapse="")
On a more casual note, log-base 2 is useful to calculate number of rounds for a single-elimination playoff tournament, eg, NCAA men’s and women’s basketball tournament or March Madness (NCAA). As of 2025, 60 teams are invited, plus the four winning teams from four play-in games, for a total of 64 teams. The number of rounds is log2(64) and R returns 6. These six are referred to as First Round, Second Round, Sweet Sixteen, Elite Eight, Final Four, and the Championship Game. The play-in games are referred to as the”First Four.” The function draw_bracket() of R package SwimmeR can be used to plot a simple playoff bracket.
Table 1. Mean and fold change of gene expression values from qPCR for several genes from a rat lung cell line.*
| Control | Copper-sulfate | Fold change | |
| ECAD | 34.6 | 35.7 | 0.6 |
| NCAD | 28.5 | 24.0 | 27.2 |
| SMAD | 29.5 | 25.0 | 28.2 |
| SNAI1 | 25.5 | 28.1 | 0.2 |
| FOXC2 | 27.6 | 27.0 | 1.9 |
| VIM | 23.1 | 16.4 | 134.4 |
| TWIST | 25.1 | 22.9 | 5.6 |
* INBRE funding, P20RR016467.
At face value, following four hour exposure to copper sulfate in media, some evidence that the epithelial cell line adopted gene expression profile of mesenchyme-like cells. However, weakness of fold-change is clear from Table 1: the quantity is sensitive to small values. ECAD expression in the cell line is low, thus high numbers of PCR cycles (mean = 36) and treated cells not much fewer (mean = 34.4).
Note 3: Calculation of is included. Geomean CT were
| Control | CuSO4 | |
| ACTB | 32.2 | 32.5 |
| NCAD | 28.5 | 24.0 |
For control cells, 
For treatment cells, 
and 
log2, 
table value differs by rounding
Orders of magnitude
In addition to fold change, order of magnitude is another common way to compare quantities. While fold change returns the multiplier between two numbers, order of magnitude generally refers to differences in multiples of ten, logarithmic.

Thus, a difference of one order of magnitude is the number multiplied by 101, three orders of magnitude is the number multiplied by 103, and so on. A change from 10 to 100 is a one order of magnitude increase; the same change, 10 to 100, is a ten-fold change. It’s a difference of scale. If a person’s salary increases by 3%, from $49K to $50,470, reporting this as an “order of magnitude” increase is nonsensical as a communication device (magnitude of change is just 0.01). By contrast, fold change for the same increase would be 1.03 — also indicative of a negligible increase, but a cleaner representation.
Rates
Rates are a class of ratios in which the denominator is some measure of time. For example, the four year graduation rate of some Hawaii universities are shown in Table 2.
Table 2. Percent students graduation with bachelor’s degrees within four years or six years (cohort 2014, data source NCES.ed.gov)
| School | Private/Public | Four-year, Percent graduation |
Six-year, Percent graduation |
| Chaminade University | Private (non-profit) | 43 | 58 |
| Hawaii Pacific University | Private (non-profit) | 31 | 46 |
| University of Hawaii – Hilo | Public | 15 | 38 |
| University of Hawaii – Manoa | Public | 35 | 62 |
| University of Hawaii – West Oahu | Public | 16 | 39 |
| University of Phoenix | Private (for profit) | 0 | 19 |
Examples of rates
Rates are common in biology. To name just a few
- Basal metabolic rate (BMR), often measured by indirect calorimetry, reported in units kiloJoules per hour.
- Birth rates and mortality (death) rates, components of population growth rate.
- Extinction rate, how often over a given time species go extinct.
- Growth rate, which may refer to growth of the individual (somatic growth rate), or increase of number of individuals in a population per unit time.
- Molecular clock hypothesis, rate of amino acid (protein) or nucleotide (DNA) substitution is approximately constant per year over evolutionary time.
- Mutation rate, frequency of new mutations in a DNA sequence of an organism over time.
- Photosynthetic rate, convert light energy into chemical energy.
- Phred quality score, error rates of incorrectly called nucleotide bases by the sequencer.
Proportions
Proportions are also ratios, but they are used to describe one part to the whole. For example, 902 women (self-reported) day undergraduate students enrolled in 2014 at Chaminade University in Honolulu, Hawaii.
Practice: Given that the total enrollment for Chaminade in 2014 was of 1,326, calculate the proportion of female students to the total student body.

More practice: A common statistic in agriculture is germination percentage, count the number of seeds that sprout over a period of time divided by total number of seeds planted multiplied by 100. Figure 1 shows an example of a germination trial for five tomato seeds. Seed in position 3 (left to right 1 – 5) failed to germinate, whereas the other four seeds display range of seedling growth. (A seed coat is observed next to plant 2.)

Figure 1. Example planting of five tomato seeds, day 5, on agar Petri dish (M. Dohm).
Observations conducted over 10 days. Germination defined as evidence of radicle by day 10. Data collected by student for biostatistics project. A random sample of results from three plates is presented in Table 3.
Table 3. Germination of tomato seeds on agar Petri dishes.
| Plate* | 1 | 2 | 3 | 4 | 5 |
| 18 | Yes | No | Yes | Yes | Yes |
| 13 | Yes | Yes | Yes | No | Yes |
| 20 | No | Yes | Yes | Yes | Yes |
* Random sample of three plates drawn from among 30 plates.
We calculate the percent germination for the 15 seeds planted as

Thus, for the sample of plates the germination percent was 80%, which, coincidently, is the same result if germination percent was calculated for the five seeds displayed in Figure 1.
Beginning in Chapter 7 – Probability, Risk Analysis, we introduce and use a number of proportions, for example incidence and prevalence are proportions, as is PPV — positive predictive value. Sensitivity and specificity are both proportions and also qualified as indexes.
Comparing proportions
In some cases you may wish to compare two proportions or two ratios. The hypothesis tested is the difference between the two ratios, and the test is if the confidence interval of the difference includes zero. If it does, then we would conclude there is no statistical difference between the two proportions. In R, use the prop.test function. For example, 63 women were on team sport rosters at Chaminade in 2014, a proportion of 59% of all student athletes (n = 106). Recall from the example above that women were 68% of all students at Chaminade University. Title IX compliance requires that a university “maintain policies, practices and programs that do not discriminate against anyone on the basis of gender” (NCAA, INCLUSION AND BELONGING Championing Women in Sports). In terms of athletic programs, then, universities are required to provide participation opportunities for women and men that are substantially proportionate to their respective rates of enrollment of full-time undergraduate students.
Consider Chaminade University: Is there a statistical difference between proportion of women athletes and their proportion of total enrollment? We introduce statistical inference in Chapter 8, but for now, this is a test of the null hypothesis that the difference between the two proportions is zero.
At the R prompt type (remember, anything after the # sign is a comment and ignored by R).
women = c(62,902)  #where 62 is the number of women athletes and 902 is the number of women students
students = c(106,1326)  #106 is the number of student athletes and 1326 is all students
prop.test(women,students)  #the default is a two-tailed test, ie, no group differences
And R returns
2-sample test for equality of proportions with continuity correction
 data: women out of students
X-squared = 3.6331, df = 1, p-value = 0.05664
alternative hypothesis: two.sided
95 percent confidence interval:
 -0.197532407 0.006861073
sample estimates:
 prop 1 prop 2
0.5849057 0.6802413
What is the conclusion of the test?
When you compare two groups, you’re asking whether the two groups are equal (the null hypothesis). Mathematically, that’s the same as saying the difference between the two groups is equal to zero.
First check the lower and upper limits of the confidence interval. A confidence interval is one way to report a range of plausible values for an estimate (see Ch 7.6 – Confidence intervals). It’s called a confidence interval because a probability is assigned to the range of values; a 95% confidence interval is interpreted as we’re 95% certain the true population value is somewhere between the reported limits. For our Chaminade University Title IX question, recall that we are asking whether the value of zero is included. The lower limit was -0.1975 and some change; the upper limit was 0.0068 and some change. Thus, zero is included and we would conclude that there was no statistical difference between the two proportions.
The second relevant output to look at is the p-value, or probability value. If the p-value is less than 5%, we typically reject the tested hypothesis. We will talk more about p-values and their relationship to inference testing in Chapter 8; for now, pay attention to the confidence interval (introduced in Chapter 3.4); if zero is included, then we conclude no substantial differences between the two proportions.
Indexes
Indexes are composite statistics that combine indicators. They condense complex diagnostic performance data into a single, universally understood numerical indicator.
Indexes are common in biology, and well-known business and economics indexes are reported on every day, eg, Dow Jones Industrial average combines stock prices from 30 companies listed on the New York Stock Exchange and the CPI, or Consumer Protection Index, constructed by the US Bureau of Labor Statistics from a “market basket of consumer goods and services, used by the government and other institutions to track inflation. The CPI itself is made up of numerous indexes to account for regional price differences and other factors.
Some indexes presented in this book include
- Grade point average
- Body Mass Index (BMI)
- Comet assay indexes (tail intensity, tail length, tail moment) are used to assess DNA damage among organisms exposed to environmental contaminants (eg, Mincarelli et al., 2019).
- Encephalization index, ratio of brain to body weight among species. Used to compare cognitive abilities.
- Sensitivity, specificity, NNT — number needed to treat, odds-ratio and RRR and related. See Chapter 7.1 – Probability, Risk Analysis.
- Species diversity indexes, measures of species richness and abundance. See Chapter 20.8.
Scales
Agreement scales for surveys, eg, Likert scale or sliding scale (Sullivan and Artino 2013). For example, after learning about Theranos, students were asked:
How serious is this violation in your opinion?
| Not serious
0 |
Slightly serious
0 |
Moderately serious
2 |
Serious
4 |
Very serious
19 |
a 5-point scale.
Although an intuitive measure, how fast can an individual run, challenging to determine whether individual’s performance is at physiological maximum. Particularly for measures of performance capacity that involves behavior (motivation), may apply a race quality scale (eg., binary scale “good” or “bad” Husak et al 2006).
These examples reflect ordinal scales. Many of the nonparametric tests discussed in Chapter 15 are suitable for analysis of scales.
Limitations of ratios
Although the indexes may be easy to communicate, statistically, indexes have many drawbacks. Chief among these, variation in ratios may be due to change in numerator or denominator. Ratios and any index calculated by combining ratios seem simple enough, but have complicated statistical properties. Over the years, several authors have made critical suggestions for use of ratios and indexes. Some key references are Packard and Boardman (1988), Jasienski and Oikos (1999), Nee et al (2005), and Karp et al (2012). For example, ratios, computing trait value by body weight, are often used to compare some trait among individuals or species that differ in body size. However, this normalization attempt only removes the covariation between size and the trait if there is a 1:1 relationship between size and the trait. More typically, relationship between the trait and body size is allometric, ie, the slope is not equal to one. Thus, ratio will over-correct for large size and under-correct for small size. The proper solution is to conduct the comparison as part of an analysis of covariance (ANCOVA, see Chapter 17.6).
Example
Which is the safer mode of travel: car or airplane?
The following discussion covers travel safety in the United States of America for a typical year, 2000*.
Note 4: *The following discussion excludes the 241 airline passenger deaths associated to the terrorist attacks of September 11 2001 in the USA; the NTSB also “…exclude(s illegal acts) for the purpose of accident rate computation. It also does not include considerations of 2020-2021 and effects of the COVID-19 pandemic on numbers of flights. The purpose of this discussion is not to convince you about the safety of modes of travel. Moreover, the following analysis is not necessarily the proper way to frame or analyze risk, but, rather, the purpose of this discussion is to highlight the impact of assumptions on estimating risk.
Between 2000 and 2023, there were 779 deaths associated with accidents of major air carriers in the USA. Year 2009 was the last multiple-casualty crash of a major U.S. carrier (Colgan Air Flight 3407); between 2010 and 2021, two fatal accidents, two fatalities were reported.
We’ve all heard the claim that it’s much safer to fly with a major airline than it is to travel by car (eg, Flying is getting scary. But is it still safe? CNN June 20, 2024). There are a variety of arguments, but one statistical argument goes as follows. In 2000 in the United States, 638,902,993 persons traveled by major air carrier, whereas there were 190,625,023 licensed drivers. In 2000, 92 persons died in air travel (again, major carriers only), whereas 37,526 persons died in vehicle crashes (includes drivers and passengers). Thus, the risk of dying in air travel is given as the proportion  , or 1.44e-07 (0.000014%), whereas the comparable proportion for death by motor vehicle is
 , or 1.97e-04 (0.0197%).
In other words, we can expect one death (actually 1.4) for every ten million airline passengers, but 20 deaths (actually 19.7) for every one hundred thousand licensed drivers. Thus, flying is a thousand times safer than driving (actual result 1,367 times; divide the rate of motor vehicle-caused deaths for licensed drivers by the rate for airlines). Proportions are hard to compare sometimes, especially when the per capita numbers differ (ten million vs. 100,000 in this case).
We can put the numbers onto a probability tree and get a sense of what we are looking at (Fig 2).
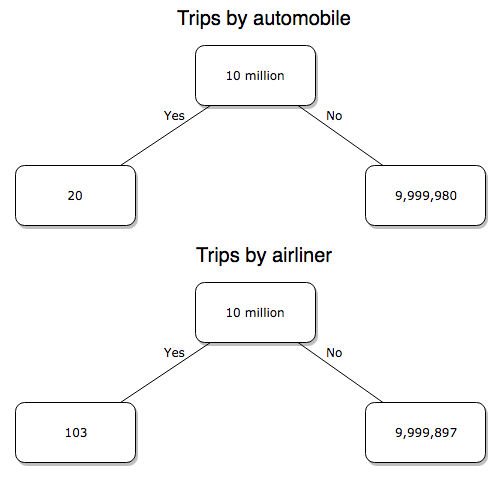
Figure 2. A probability tree to help visualize comparison of deaths (“yes”) by car travel and by airline travel in the United States for the year 2000.
Comparing rates and proportions
Without going into the details, we will do so in Chapter 9 Inferences on Categorical Data, comparing two rates is a chi-square, χ2, contingency table type of problem. More specifically, however, it is a binomial problem (Chapter 3.1, Chapter 6.5); there are two outcomes, death or no death, and we can describe how likely the event is to occur as a proportion. Because the numbers are large, we can use rely on the normal distribution for comparing the two proportions. We’ll explain this more in the next chapters, but for now it may be enough to present the equation for the comparison of two proportions under the assumption of normality, proportion z test.
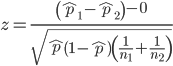
and the null hypothesis (see Chapter 8) tested as that the two proportions are equal. This may be written as
H0 : p1-p2=0
We can assign statistical significance to the differences in events for the two modes of travel under this set of assumptions. Rcmdr has a nice menu-driven system for comparing proportions, but for now I will simply list the R commands.
At the R prompt type each line then submit the command.
total = 100000000
prop.test(c(19700,14),c(total,total)))
And the R output
prop.test(c(19700,14),c(total,total))

    2-sample test for equality of proportions with continuity
    correction

data:  c(19700, 14) out of c(total, total)
X-squared = 19658, df = 1, p-value < 2.2e-16
alternative hypothesis: two.sided
95 percent confidence interval:
 0.0001940984 0.0001996216
sample estimates:
  prop 1   prop 2
1.97e-04 1.40e-07
There’s a bit to unpack here. R is consistent; when it reports results of a statistical test, it typically returns the value of the test statistic (χ2 = 19658), the degrees of freedom for the test (df = 1), and the p-value (< 2.2e-16).
prop.test() were calculated by the Wilson Score method not the Wald method. While both are parametric tests and therefore sensitive to departures from normality (see Chapter 13.3), formulation of Wilson score method makes fewer assumptions (involving approximations of the population proportions) and therefore is considered more accurate.By convention in statistics, if a p-value, where “p” stands for probability, is less than 5%, we would say that our results are statistically significant from the null hypothesis. Looks pretty convincing to me, the difference of 19,700 deaths compared to 14 deaths is clearly different by any criterion and by the results of the statistical test, the p-value is several orders of magnitude smaller than 5%.
Safer to fly. By far, not even close. And similar conclusions would be reached if we compare different years, or averages over many years, or if we used a different way to express the amount of travel (eg, miles/year) by these modes of transportation.
Are you convinced, really? Is it safer to fly?
Let’s try a little statistical reasoning — what assumptions did I make to do these calculations? We recognize immediately that many more people travel by car: that there are way more cars being driven then there are airline planes being flown. The question then is, have we properly adjusted for this difference? Here are a few considerations. My source for the numbers is the NTS 2001 book published by the U.S. Department of Transportation (U.S. Department of Transportation). We are conducting a risk analysis, and the first step is to make sure that we are comparing “apples with apples.” Here are two alternative solutions that at least compare, “Red Delicious” apples with “Macintosh” apples.
Option 1. There are many, many more licensed drivers than there are licensed commercial airline pilots. The standard comparison offered in the background above compared deaths per licensed car driver, but a different metric for air travel, the rate per passenger. This isn’t as bad of a comparison as it may seem — after all, the majority of deaths in car accidents are of the driver themselves. But it isn’t that hard to make the direct comparison — just find out how many commercial pilots there are — a direct comparison with licensed car drivers (stated above as 190,625,023). From the FAA we see that in 2009 there were 125,738 persons with commercial certificates. Since there are only 20 major airline carriers in the United States now (a few more were active in 2000, but we’ll put this aside), the number of licenses is an over estimate of the actual number we want — how many pilots of commercial airlines — but lets use this number for starters — after all, just because a person has a drivers license doesn’t mean they drive or ride in a car.
Number of deaths/yr: Let’s use 2000 data, a typical year prior to 9/11 (and excluding the Covid-19 pandemic). Airlines: 92 deaths; motor vehicles (includes passenger cars, trucks, etc, but not motorcycles): 37,526 deaths (drivers = 25,567; passengers = 10,695; 86 others).
Which mode of travel is riskier? I get a rate a rate of 7.3 X 10⁻⁴ deaths per commercial pilot, or
92125738
compared to a rate for car drivers of 1.97 X 10⁻⁴ deaths.
To summarize what we have so far, I get a result that suggests car travel is almost four times safer
7.3 x 10-41.97 x 10-4→7.31.97 = 3.7
then traveling by commercial airliner. In whole numbers, these results translate to seven deaths for every 10,000 commercial pilots compared to two deaths for every 10,000 licensed car drivers (Fig 3).
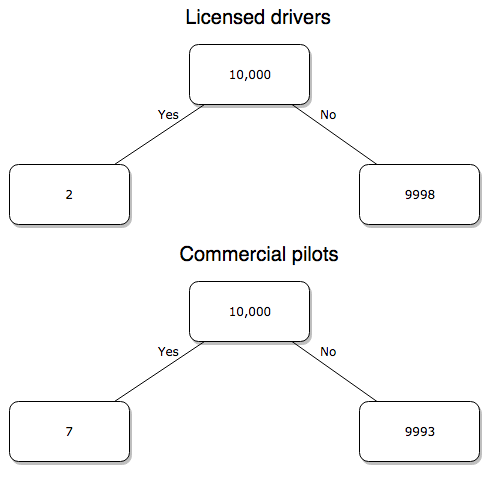
Figure 3. Comparing totals of deaths adjusted by numbers of licensed drivers and by licensed commercial airline pilots in the United States.
R work follows. Enter and submit each command on a separate line in the script window
total = 10000
prop.test(c(2,7),c(total,total))
And the R output
prop.test(c(2,7),c(total,total))

    2-sample test for equality of proportions with continuity
    correction

data:  c(2, 7) out of c(total, total)
X-squared = 1.7786, df = 1, p-value = 0.1823
alternative hypothesis: two.sided
95 percent confidence interval:
 -0.001187816  0.000187816
sample estimates:
prop 1 prop 2
 2e-04  7e-04
What’s happened? The p-value (0.1823) is not less than 5% and so we would conclude under this scenario that there is no difference between the proportions of deaths between the two modes of travel. Let’s keep going.
Option 2. There are many, many more cars on the road then there are airplanes flying commercial passengers. The standard comparison offered in the background information above identified death rates per individual driver, but used a different metric for airline travelers (number of deaths per passenger), which confuses individuals with travelers: what we need is the number of individuals that traveled by airliner, not the total number of passengers (which is many times higher, because of repeat flyers). How can we make a fair comparison for the two modes of travel? Most people never fly whereas most people drive (or ride in a car) frequently in the United States. To me, risk of travel might be better expressed in terms of a per trip rate. I want to know, what are my chances of dying each time I get into my car versus each time I fly on a commercial jet in the United States?
Number of trips/yr. For airlines, I use the number of departures (2000 = 8,951,773). But for cars, we need to decide how to get a similar number. It’s not available directly from the DOT (and would be difficult to get — studies with randomly selected drivers can yield as many as 5 trips per day for licensed drivers). I took the number of licensed drivers and bound the problem — at the low end, let’s say that only 2 trips per week (eg, 50 weeks) are taken by licensed drivers (100 trips); at the upper end, let’s take 2 trips per day per week, or 500 trips/year. Thus, at the low end, we have 1.91 X10¹⁰ trips per year; at the upper end, 9.53 X 10¹⁰ trips per year.
Which mode of travel is riskier? Using the number of deaths/yr listed above in Option 1, I get a rate of 1.03 X 10⁻⁵ deaths/trip for air carriers
928.95 x 10⁶
compared to a rate of 1.97 X 10⁻⁶ deaths/trip for cars (lower bound) or 3.9 X 10⁻⁷ deaths/trip for cars (upper bound). Here’s what the numbers look for in a tree (taking the lower number of trips per year for cars, Fig 4).
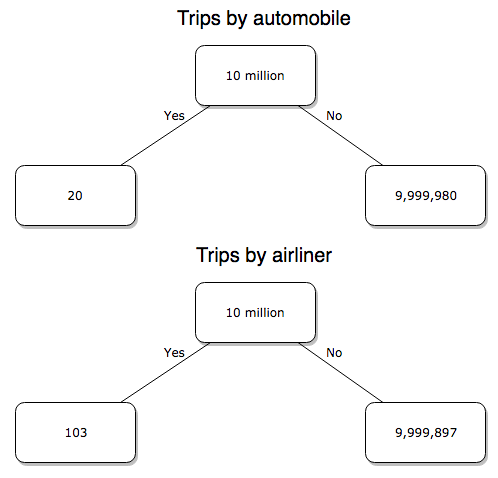
Figure 4. Comparing totals of deaths adjusted by numbers of car trips and by numbers of airline trips in the United States.
R work follow
total = 10000000
prop.test(c(20,103),c(total,total))
And the R output
prop.test(c(20,103),c(total,total))

    2-sample test for equality of proportions with continuity
    correction

data:  c(20, 103) out of c(total, total)
X-squared = 54.667, df = 1, p-value = 1.428e-13
alternative hypothesis: two.sided
95 percent confidence interval:
 -1.057370e-05 -6.026305e-06
sample estimates:
  prop 1   prop 2
2.00e-06 1.03e-05
Now we have another really small p-value (1.428e-13), which suggests a statistically significant difference between the modes of air travel, but the difference in deaths is switched. I now have a result that suggests car travel is much safer than traveling with a commercial airliner! These calculations suggest that you are as much as 26 (upper bounds, five times for lower bounds) times more likely to die from a plane crash then you are behind the wheel. In whole numbers, these results indicate one death for every 100,000 airline flights compared to 1 death for every 500,000 (lower estimate) or 2,500,000 car trips!
Do I have it right and the standard answer is wrong? As Lee Corso used to say on ESPN’s College GameDay program, “Not so fast, my friend!” (Wikipedia). Mark Twain was right to hold the skeptic’s view. Begin by listing the assumptions and by checking the logic of the comparisons (there are still holes in my logic!!). For one, if I am considering my risk of dying by mode of travel, it is far more likely that I will be in a car accident than I will an airline accident, simply because I don’t travel by airline that much. When we consider lifetime risk, we can see why the assertion that it is “safer to fly than drive” is true — we’re far more likely to belong to one of the reference populations involving automobiles (eg, those who drive frequently, for many years) than we are to be among the frequent flyers reference populations.
Questions
1. Review and provide your own examples for
- index
- rate
- ratio
- proportion
3. Like travel safety, we are often confronted by risk comparisons like the following: Which animal is more deadly to humans, dogs or sharks? Between the two, which lead to more hospitalizations in the United States? Work through your assumptions and use results from the International Shark Attack file.
- If a person lives in Nebraska, and never visits the ocean, how does a “shark attack” risk analysis apply? Is it a fair comparison to make between dog attacks and shark attacks? Why or why not.
4. Go to cappex.com/colleges and update institutional (gift) aid offered by Chaminade and HPU. Compare to University of Hawaii-Manoa.
5. Calculate percent increase for
- Annual atmospheric CO2 1980 and 2024.
Quiz Chapter 6.2
Ratios and probabilities
Chapter 6 content
- Introduction
- Some preliminaries
- Ratios and probabilities
- Combinations and permutations
- Types of probability
- Discrete probability distributions
- Continuous distributions
- Normal distribution and the normal deviate (Z)
- Moments
- Chi-square distribution
- t distribution
- F distribution
- References and suggested readings
7.6 – Confidence intervals
Quantifying uncertainty.
Although I’ve already presented the concept (eg, Chapter 3.4), and equations for confidence intervals of risk estimates (Chapter 7.4, Chapter 7.5), here, we expand on the idea of confidence intervals. Confidence intervals are a central part of meeting one of the main objectives of statistics, that is, estimation and communicating uncertainty with any reported estimate.
There are three components of statistical analysis
- Estimation
- Inference
- Modeling
Inference refers to statistical hypothesis testing — we ask questions of observations — do men (Rice et al 1999) and women (Fisher et al 2012) differ for blood glucose levels following a bout of aerobic exercise? T-tests, analysis of variance (ANOVA), chi-square, correlation, regression are types of statistical procedures used to do statistical inference. Modeling on the other hand refers to procedures used to relate cause and effect or for use in prediction of future values given new data. Many of the statistical procedures one uses for inference are also used to build statistical models (ANOVA, regression). Studies may intend to either test some hypothesis (inference) or to provide a predictive equation (modeling). But most studies that relate observations gathered from an experiment are obliged to also report statistics, and this is the realm of estimation. Estimates of the mean and standard deviation, for example, would be typical statistics one expects to find in a report. We call these descriptive statistics, and together with graphics, descriptive statistics are the chief way we describe our results.
Confidence intervals are crucial in statistics because they provide a range of values where the true population parameter is likely to fall, offering a more nuanced understanding of the estimate beyond just a single point value. Similarly, for statistical model model building, confidence intervals quantify the uncertainty inherent in data, providing a range of plausible values for model parameters rather than a single point estimate.
We will review how to calculate confidence intervals for proportions and for NNT. These intervals are available in epiR package and automatically returned in RcmdrPlugin.EBM.
Confidence interval for proportions
A proportion is the fraction of individuals in a population with some characteristic. The characteristic might be HIV positive for example. This would be called the population proportion and it would be a parameter of interest. In reality, we calculate a sample proportion and therefore estimate the population proportion with error. We can calculate the confidence interval (CI) of the proportion to communicate the precision of our estimate. For proportions, we use the binomial distribution — either a sample has the characteristic of interest or it does not — there are only two possibilities. There are a variety of ways to go here, and the simplest is to use a normal approximation. This will work well provided the sample size was reasonably large and the proportion is not close to zero or one, that is, we invoke the Central Limit Theorem here. Although the outcomes are binomial, the error is assumed to be normally distributed. The Wald confidence interval for p is

where  is the proportion of individuals with the characteristic (also called successes), z is the percentile from the normal distribution that corresponds to 1 – 1/2α. For 95% CI then α = 0.05 and z would be 1.965. (See standard normal table.) Of course, if making the normal approximation for the binomial is not appropriate, the CI is less than ideal. The binomial after all is a discrete distribution whereas the normal distribution is continuous, so errors will enter particularly for low sample numbers.
Other approaches may be used to get better estimates of CI for proportions, including Wilson score intervals and Jeffrey Intervals (Agresti and Coull 1998). See R package propCIs.
Because a statistic like the mean or a calculation of absolute or relative risk reduction are calculated from samples drawn from a population, the estimate comes with error. The error is basically this – if we calculate a statistic like number needed to treat (NNT) or its converse, the number needed to harm (NNH), we need to communicate to the reader how precise our estimate is. Estimation has to do with accuracy, error, and precision.
Confidence interval for ARR
The ARR is simply 
where  is the number of treated or exposed individuals for which the event occurred and
 is the number of untreated or unexposed individuals which the event occurred.
| Event happened | Event did not happen | |
| Treated or Exposed |
a | b |
| Control or Not exposed |
c | d |
Our data from example (Ch 7.5), were a = 612, b = 2192, c = 375, and d = 2543.

and the 95% confidence interval is then 
approximately. The “2” is only approximate; you need to use Z = 1.965, the value at probability value = 0.9725 (which comes from the Normal Table).
Confidence interval for NNT
For a sample of 100 people drawn at random from a population (which may number in the millions), then repeat the NNT calculation for a different sample of 100 people, do we expect the first and second NNT estimates to be EXACTLY the same number? No, but we do expect them to be close and we can define what we mean by close as we expect each estimate to be within certain limits. While we expect the second calculation to be close to the first estimate, we would be surprised if it was EXACTLY the same. And so, which is the correct estimate, the first or the second? They both are, in the sense that they both estimate the parameter NNT (a property of a population). But we can do better than two estimates. Confidence Intervals (CI) allow us to assign a probability to how certain we are about the statistic and whether it is likely to be close to the true value. We will
For CI of NNT, we need sample size for control and treatment groups; like all confidence intervals, we need to calculate the standard error of the statistic, in this, case, the standard error (SE) for NNT.
SE = sqrt(risk placebo * (1 - risk placebo) / (# in placebo group) + risk treatment * (1 - risk treatment) / (# in treatment group))
where SE is the standard error for NNT
The CI is approximately then 
* – the “2” is only approximate; you need to use Z = 1.965, the value at probability value = 0.9725 (by multiplying this, which comes from the Standard Normal Table).
Odds ratio Standard error and 95% confidence interval
Like any statistic we can calculate, an estimate of odds ratio should be accompanied by the confidence limit. The standard error may be calculated with the following formula

R code
seOdds <- sqrt(sum(1/612, 1/2192,1/375,1/2543))
where ln refers to the natural logarithm. An estimate for the 95% confidence interval is

where exp is the exponential function

and ln is natural logarithm.
R code
exp(log(1.89,base=exp(1)) - 1.96*seOdds)
Our example the lower limit was 1.64. For the upper limit

Our example the upper limit was 2.19.
R code
exp(log(1.89,base=exp(1)) + 1.96*seOdds)
Thus, our estimate was 1.89 and the 95% confidence interval was 
which does not include one. Therefore, we conclude statistically different.
Note 1. A reminder, log() without specifying the base returns the natural logarithm. A better coding habit might suggest always specifying the base:
log(x, base = exp(1))P-values from confidence intervals
While we expect certain reporting criteria for published, it is not uncommon that one or more elements are missing. For example, while we show how to obtain confidence intervals, the p-values were not reported. We discuss statistical inference and p-values in detail in Chapter 8, but for now, a low p-value (typically < 0.05) indicates that the odds ratio (OR) is statistically significant, meaning the observed relationship between a factor and an outcome is unlikely to be due to random chance. An OR of the difference may not be reported, or, an inexact p-value is reported like “< 0.05,” but we “need” an exact p-value for our meta-analysis. A little math, and these missing statistics can be calculated.
Note 2. We illustrated how to calculate confidence intervals from p-values in Chapter 3.4 – Estimating parameters. See two helpful “how to” articles by Bland and Altman in 2011 BMJ (references listed in Chapter 3.6 – References).
We can use the OR example. We need to take the logarithm of ratios like OR or NNT or RRR. From above, we have the confidence intervals.
We need
The OR estimate,  , which was 1.89
lower and upper confidence intervals: 1.64 and 2.19, respectively.
the standard error, which can be calculated as 
the test statistic, 
and then the p-value, 
we would then report that the OR was not statistically different, p = 0.4044).
Questions
1. Instead of 95% confidence interval, obtain the 99% confidence interval for odds ratio 1.89.
Quiz Chapter 7.6
Confidence intervals