17.8 – Assumptions and model diagnostics for Simple Linear Regression
Introduction
The assumptions for all linear regression:
- Linear model is appropriate.
The data are well described (fit) by a linear model. - Independent values of Y and equal variances.
Although there can be more than one Y for any value of X, the Y‘s cannot be related to each other (that’s what we mean by independent). Since we allow for multiple Y‘s for each X, then we assume that the variances of the range of Y‘s are equal for each X value (this is similar to our ANOVA assumptions for equal variance by groups). Another term for equal variances is homoscedasticity. - Normality.
For each X value there is a normal distribution of Y‘s (think of doing the experiment over and over). - Error
The residuals (error) are normally distributed with a mean of zero.
Note the mnemonic device: Linear, Independent, Normal, Error or LINE.
Each of the four elements will be discussed below in the context of Model Diagnostics. These assumptions apply to how the model fits the data. There are other assumptions that, if violated, imply you should use a different method for estimating the parameters of the model.
Ordinary least squares makes the additional assumption about the quality of the independent variable that e that measurement of X is done without error. Measurement error is a fact of life in science, but the influence of error on regression differs if the error is associated with the dependent or independent variable. Measurement error in the dependent variable increases the dispersion of the residuals but will not affect the estimates of the coefficients; error associated with the independent variables, however, will affect estimates of the slope. In short, error in X leads to biased estimates of the slope.
The equivalent, but less restrictive practical application of this assumption is that the error in X is at least negligible compared to the measurements in the dependent variable.
Multiple regression makes one more assumption, about the relationship between the predictor variables (the X variables). The assumption is that there is no multicollinearity, a subject we will bring up next time (see Chapter 18).
Model diagnostics
We just reviewed how to evaluate the estimates of the coefficients of the model. Now we need to address a deeper meaning — how well the model explains the data. Consider a simple linear regression first. If Ho: b = 0 is not rejected — then the slope of the regression equation is taken to not differ from zero. We would conclude that if repeated samples were drawn from the population, on average, the regression equation would not fit the data well (lots of scatter) and it would not yield useful prediction.
However, recall that we assume that the fit is linear. One assumption we make in regression is that a line can, in fact, be used to describe the relationship between X and Y.
Here are two very different situations where the slope = 0.
Example 1. Linear Slope = 0, No relationship between X and Y
Example 2. Linear Slope = 0, A significant relationship between X and Y
But even if Ho: b = 0 is rejected (and we conclude that a linear relationship between X and Y is present), we still need to be concerned about the fit of the line to the data — the relationship may be more nonlinear than linear, for example. Here are two very different situations where the slope is not equal to 0.
Example 3. Linear Slope > 0, a linear relationship between X and Y
Example 4. Linear Slope > 0, curve-linear relationship between X and Y
How can you tell the difference? There are many regression diagnostic tests, many more than we can cover, but you can start with looking at the coefficient of determination (low R2 means low fit to the line), and we can look at the pattern of residuals plotted against the either the predicted values or the X variables (my favorite). The important points are:
- In linear regression, you fit a model (the slope + intercept) to the data;
- We want the usual hypothesis tests (are the coefficients different from zero?) and
- We need to check to see if the model fits the data well. Just like in our discussions of chi-square, a “perfect fit would mean that the difference between our model and the data would be zero.
Graph options
Using residual plots to diagnose regression equations
Yes, we need to test the coefficients (intercept Ho = 0; slope Ho = 0) of a regression equation, but we also must decide if a regression is an appropriate description of the data. This topic includes the use of diagnostic tests in regression. We address this question chiefly by looking at
- scatterplots of the independent (predictor) variable(s) vs. dependent (response) variable(s).
what patterns appear between X and Y? Do your eyes tell you “Line”? “Curve”? “No relation”? - coefficient of determination
closer to zero than to one? - patterns of residuals plotted against the X variables (other types of residual plots are used to, this is one of my favorites)
Our approach is to utilize graphics along with statistical tests designed to address the assumptions.
One typical choice is to see if there are patterns in the residual values plotted against the predictor variable. If the LINE assumptions hold for your data set, then the residuals should have a mean of zero with scatter about the mean. Deviations from LINE assumptions will show up in residual plots.
Here are examples of POSSIBLE outcomes:
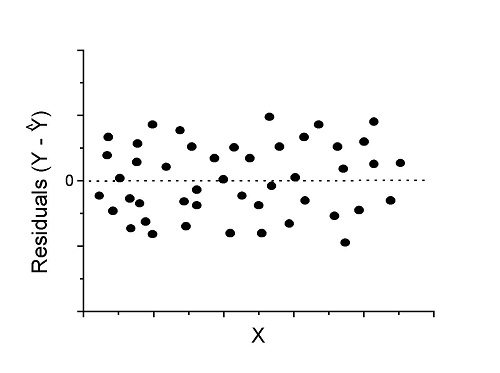
Figure 1. An ideal plot of residuals
Solution: Proceed! Assumptions of linear regression met.
Compare to plots of residuals that differ from the ideal.
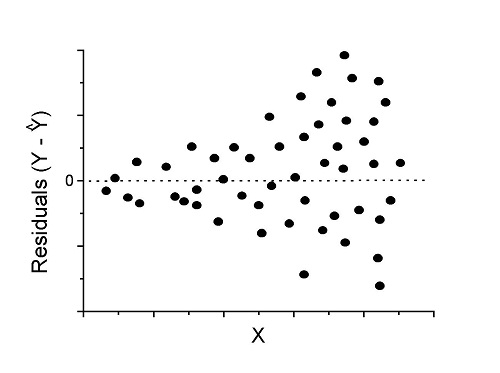
Figure 2. We have a problem. Residual plot shows a “funnel” shape — unequal variance (aka heteroscedasticity).
Solution. Try a transform like the log10-transform.
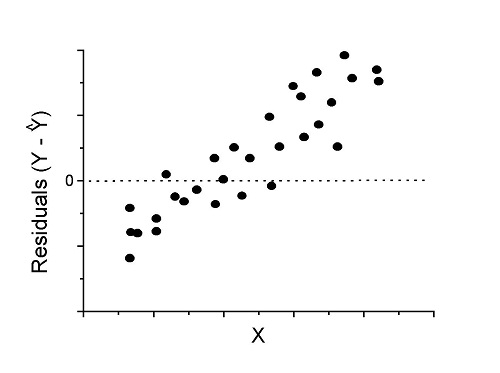
Figure 3. Problem. Residual plot shows systematic trend.
Solution. Linear model a poor fit; May be related to measurement errors for one or more predictor variables. Try adding an additional predictor variable or model the error in your general linear model.
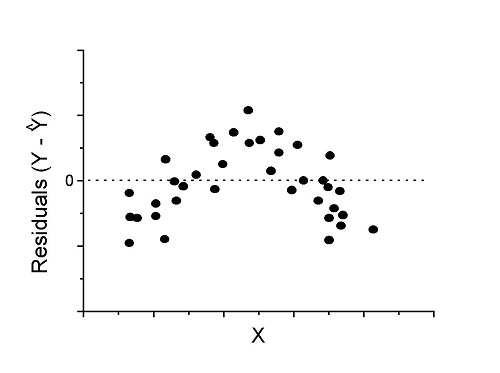
Figure 4. Problem. Residual plot shows nonlinear trend.
Solution. Transform data or use more complex model
This is a good time to mention that in statistical analyses, one often needs to do multiple rounds of analyses, involving description and plots, tests of assumptions, tests of inference. With regression, in particular, we also need to decide if our model (e.g., linear equation) is a good description of the data.
Diagnostic plot examples
Return to our example.Tadpole dataset. To obtain residual plots, Rcmdr: Models → Graphs → Basic diagnostic plots yields four graphs. Graph A is
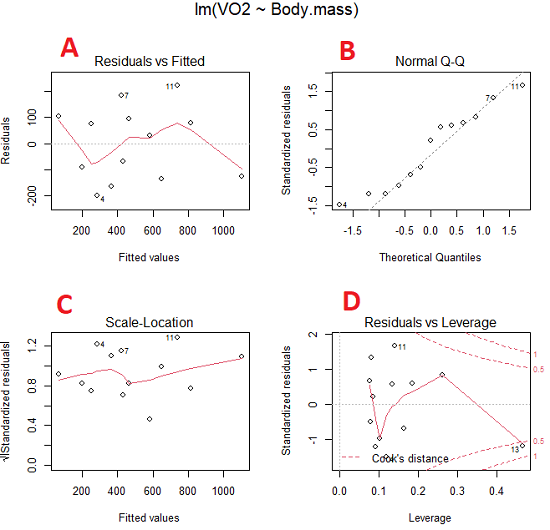
Figure 5. Basic diagnostic plots. A: residual plot; B: Q-Q plot of residuals; C: Scale-location (aka spread-location) plot; D: leverage residual plot.
In brief, we look at plots
A, the residual plot, to see if there are trends in the residuals. We are looking for a spread of points equally above and below the mean of zero. In Figure 5 we count seven points above and six points below zero so there’s no indication of a trend in the residuals vs the fitted VO2 (Y) values.
B, the Q-Q plot is used to see if normality holds. As discussed before, if our data are more or less normally distributed, then points will fall along a straight line in a Q-Q plot.
C, the Scale- or spread-location plot is used to verify equal variances of errors.
D, Leverage plot — looks to see if an outlier has leverage on the fit of the line to the data, i.e., changes the slope. Additionally, provides location of Cook’s distance measure (dashed red lines). Cook’s distance measures the effect on the regression by removing one point at a time and then fitting a line to the data. Points outside the dashed lines have influence.
A note of caution about over-thinking with these plots. R provides a red line to track the points. However, these lines are guides, not judges. We humans are generally good at detecting patterns, but with data visualization, there is the risk of seeing patterns where none exits. In particular, recognizing randomness is not easy. If anything, we may tend to see patterns where none exist, termed apophenia. So yes, by all means look at the graphs, but do so with a plan: red line more or less horizontal? Then no pattern and the regression model is a good fit to the data.
Statistical test options
After building linear models, run statistical diagnostic tests that compliment graphics approaches. Here, simply to introduce the tests, I included the Gosner factor as potential predictor — many of these numerical diagnostics are more appropriate for models with more than one predictor variable, the subject of the next chapter.
Results for the model  were:
lm(formula = VO2 ~ Body.mass + Gosner, data = frogs)

Residuals:
    Min      1Q Median    3Q    Max
-163.12 -125.53 -20.27 83.71 228.56

Coefficients:
           Estimate Std. Error t value  Pr(>|t|)
(Intercept) -595.37     239.87  -2.482 0.03487 *
Body.mass    431.20     115.15   3.745 0.00459 **
Gosner[T.II]  64.96     132.83   0.489 0.63648
---
Signif. codes: 0 '***' 0.001 '**' 0.01 '*' 0.05 '.' 0.1 ' ' 1

Residual standard error: 153.4 on 9 degrees of freedom
  (1 observation deleted due to missingness)
Multiple R-squared: 0.8047, Adjusted R-squared: 0.7613
F-statistic: 18.54 on 2 and 9 DF, p-value: 0.0006432
Question. Note the p-value for the coefficients — do we include a model with both body mass and Gosner Stage? See Chapter 18.5 – Selecting the best model
In R Commander, the diagnostic test options are available via
Rcmdr: Models → Numerical diagnostics
Variance inflation factors (VIF): used to detect multicollinearity among the predictor variables. If correlations are present among the predictor variables, then you can’t rely on the the coefficient estimates — whether predictor A causes change in the response variable depends on whether the correlated B predictor is also included in the model. If correlation between predictor A and B, the statistical effect is increased variance associated with the error of the coefficient estimates. There are VIF for each predictor variable. A VIF of one means there is no correlation between that predictor and the other predictor variables. A VIF of 10 is taken as evidence of serious multicollinearity in the model.
R code:
vif(RegModel.2)
R output
Body.mass Gosner
2.186347 2.186347

round(cov2cor(vcov(RegModel.2)), 3) # Correlations of parameter estimates
         (Intercept) Body.mass Gosner[T.II]
(Intercept)    1.000    -0.958        0.558
Body.mass     -0.958     1.000       -0.737
Gosner[T.II]   0.558    -0.737        1.000
Our interpretation
The output shows a matrix of correlations; the correlation between the two predictor variables in this model was 0.558, large per our discussions in Chapter 16.1 . Not really surprising as older tadpoles (Gosner stage II), are larger tadpoles. We’ll leave the issue of multicollinearity to Chapter 18.1.
Breusch-Pagan test for heteroscedasticity… Recall that heteroscedasticity is another name for unequal variances. This tests pertains to the residuals; we used the scale (spread) location plot (C) above. The test statistic can be calculated as  . The function call is part of the car package, which we download as part of the Rcmdr package. R Commander will pop up a menu of choices for this test. For starters, accept the defaults, enter nothing, and click OK.
R code:
library(zoo, pos=16)
library(lmtest, pos=16)
bptest(VO2 ~ Body.mass + Gosner, varformula = ~ fitted.values(RegModel.2), studentize=FALSE, data=frogs)
R output
Breusch-Pagan test

data:  VO2 ~ Body.mass + Gosner
BP = 0.0040766, df = 1, p-value = 0.9491
Our interpretation
A p-value less than 5% would be interpreted as statistically significant unequal variances among the residuals.
Durbin-Watson for autocorrelation… used to detect serial (auto)correlation among the residuals, specifically, adjacent residuals. Substantial autocorrelation can mean Type I error for one or more model coefficients. The test returns a test statistic that ranges from 0 to 4. A value at midpoint (2) suggests no autocorrelation. Default test for autocorrelation is r > 0.
R code:
dwtest(VO2 ~ Body.mass + Gosner, alternative="greater", data=frogs)
R output
Durbin-Watson test

data:  VO2 ~ Body.mass + Gosner
DW = 2.1336, p-value = 0.4657
alternative hypothesis: true autocorrelation is greater than 0
Our interpretation
The DW statistic was about 2. Per our definition, we conclude no correlations among the residuals.
RESET test for nonlinearity… The Ramsey Regression Equation Specification Error Test is used to interpret whether or not the equation is properly specified. The idea is that fit of the equation is compared against alternative equations that account for possible nonlinear dependencies among predictor and dependent variables. The test statistic follows an F distribution.
R code:
resettest(VO2 ~ Body.mass + Gosner, power=2:3, type="regressor", data=frogs)
R output
RESET test

data:  VO2 ~ Body.mass + Gosner
RESET = 0.93401, df1 = 2, df2 = 7, p-value = 0.437
Our interpretation
Also a nonsignificant test — adding a power term to account for a nonlinear trend gained no model fit benefits, p-value much greater than 5%.
Bonferroni outlier test. Reports the Bonferroni p-values for testing each observation to see if it can be considered to be a mean-shift outlier (a method for identifying potential outlier values — each value is in turn replaced with the mean of its nearest neighbors, Lehhman et al 2020). Compare to results of VIF. The objective of outlier and VIF tests is to verify that the regression model is stable, insensitive to potential leverage (outlier) values.
R code:
outlierTest(LinearModel.3)
R output
No Studentized residuals with Bonferroni p < 0.05
Largest |rstudent|:
  rstudent unadjusted p-value Bonferroni p
7 1.958858        0.085809              NA
Our interpretation
We ran the outlierTest() function on LinearModel.3 to check for influential outliers using Studentized residuals with Bonferroni correction.
The output shows “No Studentized residuals with Bonferroni p < 0.05”, which means no data points were statistically flagged as outliers after adjusting for multiple comparisons. The largest Studentized residual was 1.96 (point 7), with an unadjusted p-value of 0.086. Although this is the largest deviation from the regression line, it is not statistically significant. Therefore, we conclude that no single observation is exerting undue influence on the model fit, and we can be confident that our regression results are not driven by outliers.
Response transformation… The concept of transformations of data to improve adherence to statistical assumptions was introduced in Chapters 3.2, 13.1, and 15.
R code:
summary(powerTransform(LinearModel.3, family="bcPower"))
R output
bcPower Transformation to Normality
    Est Power Rounded Pwr Wald Lwr Bnd Wald Upr Bnd
Y1     0.9987           1       0.2755       1.7218

Likelihood ratio test that transformation parameter is equal to 0
   (log transformation)
                           LRT df      pval
LR test, lambda = (0) 7.374316  1 0.0066162

Likelihood ratio test that no transformation is needed
                                LRT df    pval
LR test, lambda = (1) 0.00001289284  1 0.99714
Our interpretation
The Box-Cox analysis suggests that the response variable for LinearModel.3 can remain on its original scale. No power transformation was needed, and any standard linear regression inference is appropriate. The estimated transformation parameter was close to one, which suggests that the original response variable did not need a transformation. The LRT tests whether a log transformation (lambda = 0) would improve normality. The significant p-value, 0.0066, for the LRT indicates that a log transformation would not be the best choice, consistent with lambda ≈ 1. And last, the very high p-value, 0.99714, confirms that no transformation is necessary; the model residuals were close to normal.
Questions
- Write up three learning outcomes for this page. Hint: Point your favorite generative AI to this page and ask for help.
- Referring to Figures 1 – 4 on this page, which plot best suggests a regression line fits the data?
- Return to the electoral college data set and your linear models of Electoral vs. POP_2010 and POP_2019. Obtain the four basic diagnostic plots and comment on the fit of the regression line to the electoral college data.
- residual plot
- Q-Q plot
- Scale-location plot
- Leverage plot
- With respect to your answers in question 2, how well does the electoral college system reflect the principle of one person one vote?
Quiz Chapter 17.8
Assumptions and model diagnostics for Simple Linear Regression
Chapter 17 contents
- Introduction
- Simple Linear Regression
- Relationship between the slope and the correlation
- Estimation of linear regression coefficients
- OLS, RMA, and smoothing functions
- Testing regression coefficients
- Regression model fit
- Assumptions and model diagnostics for Simple Linear Regression
- References and suggested readings (Ch17 & 18)
17.4 – OLS, RMA, and smoothing functions
Introduction
OLS or ordinary least squares is the most commonly used estimation procedure for fitting a line to the data. For both simple and multiple regression, OLS works by minimizing the sum of the squared residuals. OLS is appropriate when the linear regression assumptions LINE apply. In addition, further restrictions apply to OLS including that the predictor variables are fixed and without error. OLS is appropriate when the goal of the analysis is to retrieve a predictive model. OLS describes an asymmetric association between the predictor and the response variable: the slope bX for Y ~ bXX will generally not be the same as the slope bY for X ~ bYY.
OLS is appropriate for assessing functional relationships (i.e., inference about the coefficients) as long as the assumptions hold. In some literature, OLS is referred to as a Model I regression.
Generalized Least Squares
Generalized linear regression is an estimation procedure related to OLS but can be used either when variances are unequal or multicollinearity is present among the error terms.
Weighted Least Squares
A conceptually straightforward extension of OLS can be made to account for situation where the variances in the error terms are not equal. If the variance of Yi varies for each Xi, then a weighting function based on the reciprocal of the estimated variance may be used.

then, instead of minimizing the squared residuals as in OLS, the regression equation estimates in weighted least squares minimizes the squared residuals summed over the weights.
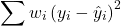
Weighted least squares is a form of generalized least squares. In order to estimate wi, however, multiple values of Y for each observed X must be available.
Reduced Major Axis
There are many alternative methods available when OLS may not be justified. These approaches, collectively, may be called Model II regression methods. These methods are invariably invoked in situations in which both Y and X variables have random error associated with them. In other words, the OLS assumption that the predictor variables are measured without error is violated. Among the more common methods is one called Reduced Major Axis or RMA.
Smoothing functions
data set: atmospheric carbon dioxide (CO2) readings Mauna Loa. Source: https://gml.noaa.gov/ccgg/trends/data.html
Fit curves without applying a known formula. This technique is called smoothing and, while there are several versions, the technique involves taking information from groups of observations — weighted averaged — and using these groups to estimate how the response variable changes with values of the independent variable. Smoothing is used to help reveal patterns, to emphasize trends by reducing noise — clearly, caution needs to be employed as smoothing necessarily hides outlier data, which can themselves be important. Smoothing techniques by name include kernel, loess, and spline. Default in the scatter plot command is loess.
CO2 in parts per million (ppm) plotted by year from 1958 to 2014 the first CO2 readings were recorded in April 1958 (Fig 1).
Note 1: When I worked on this set, the last data available for this plot was April 2014. CO2 421.86 ppm December 2023, 399.08 ppm December 2014 — a 5.7% increase. https://www.esrl.noaa.gov/gmd/ccgg/trends/
A few words of explanation for Figure 1. The green line shows the OLS line, the red line shows the loess smoothing with a smoothing parameter of 0.5 (in Rcmdr the slider value reads “5”).
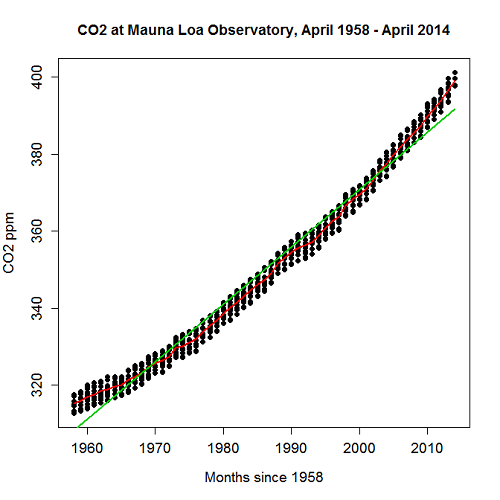
Figure 1. CO2 in parts per million (ppm) plotted by year from 1958 to 2014
R command was started with option settings available in Rcmdr context menu for scatterplot, then additional commands were added
scatterplot(CO2~Year, reg.line=lm, grid=FALSE, smooth=TRUE, spread=FALSE, boxplots=FALSE, span=0.05, lwd=2, xlab="Months since 1958", ylab="CO2 ppm", main="CO2 at Mauna Loa Observatory, April 1958 - April 2014", cex=1, cex.axis=1.2, cex.lab=1.2, pch=c(16), data=StkCO2MLO)
The next plot is for ppm CO2 by month for the year 2013. The plot shows the annual cycle of atmospheric CO2 in the northern hemisphere.
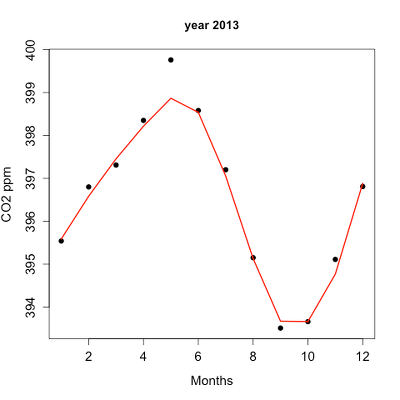
Figure 2. Plot of ppm CO2 by month for the year 2013.
Again, the smoothing parameter was set to 0.5 and the loess function is plotted in red (Fig 2).
Loess is an acronym short for local regression. Loess is a weighted least squares approach which is used to fit linear or quadratic functions of the predictors at the centers of neighborhoods. The radius of each neighborhood is chosen so that the neighborhood contains a specified percentage of the data points. This percentage of data points is referred to as the smoothing parameter and this parameter may differ for different neighborhoods of points. The idea of loess, in fact, any smoothing algorithm, is to reveal pattern within a noisy sequence of observations. The smoothing parameter can be set to different values, between 0 and 1 is typical.
Note 2: Noisy data in this context refers to data comes with random error independent of the true signal, i.e., noisy data has low signal-to-noise ratio. The concept is most familiar in communication.
To get a sense of what the parameter does, Figure 3 takes the same data as in Figure 2, but with different values of the smoothing parameter (Fig 3).
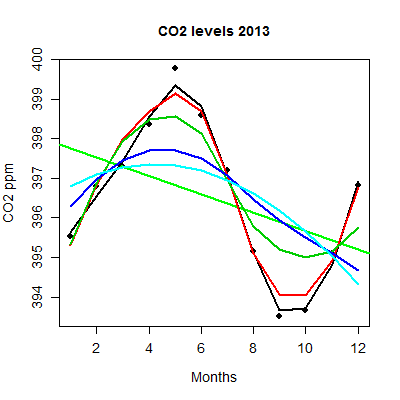
Figure 3. Plot with different smoothing values (0.5 to 10.0).
plot key:
| parameter | color |
| 0.5 | black |
| 0.75 | red |
| 1.0 | dark green |
| 2.0 | blue |
| 10.0 | light blue |
The R code used to generate Figure 3 plot was
spanList = c(0.5, 0.75, 1, 2, 10)
reg1 = lm(ppm~Month)
png(filename = "RplotCO2mo.png", width = 400, height = 400, units = "px", pointsize = 12, bg = "white")
plot(Month,ppm, cex=1.2, cex.axis=1.2, cex.lab=1.2, pch=c(16), xlab="Months", ylab="CO2 ppm", main="CO2 levels 2013")
abline(reg1,lwd=2,col="green")
for (i in 1:length(spanList))
{
ppm.loess <- loess(ppm~Month, span=spanList[i], Dataset)
ppm.predict <- predict(ppm.loess, Month)
lines(Month,ppm.predict,lwd=2,col=i)
}
Note 3: This is our first introduction to use of a “for” loop.
The CO2 data constitutes a time series. Instead of loess, a simple moving average would be a more natural way to reveal trends. In principle, take a set of nearby points (odd number of points best, keeps the calculation symmetric) and calculate the average. Next, shift the points by a specified time interval (eg, 7 days), and recalculate the average for the new set of points. See Chapter 20.5 for Time series analysis.
Questions
- Write up three learning outcomes for this page. Hint: Point your favorite generative AI to this page and ask for help.
- This is bio-statistics, so I gotta ask: What ecological/environmental process explains the shape of the relationship between ppm CO2 and months of the year as shown in Figure 2? Hint: NOAA Global Monitoring Laboratory responsible for the CO2 data is located at Mauna Loa Observatory, Hawaiʻi (lat: 19.52291, lon: -155.61586).
- As I wrote this question (January 2022), we were 22 months since WHO declared Covid-19 a pandemic (CDC timeline). Omicron variant is now dominant; Daily case counts State of Hawaiʻi from 1 November 2021 to 15 January 2022 reported in data set table.
- Make plot like Figure 2 (days instead of months)
- Apply different loess smoothing parameters and re-plot the data. Observe and describe the change to the trend between case reports and days.
Quiz Chapter 17.4
OLS, RMA, and smoothing functions
Data set
Covid-19 cases reported State of Hawaiʻi from 1 November 2021 to 15 January 2022 (data extracted from Wikipedia)
| Date | Cases reported |
|---|---|
| 11/01/21 | 69 |
| 11/02/21 | 38 |
| 11/03/21 | 176 |
| 11/04/21 | 112 |
| 11/05/21 | 124 |
| 11/06/21 | 97 |
| 11/07/21 | 134 |
| 11/08/21 | 94 |
| 11/09/21 | 79 |
| 11/10/21 | 142 |
| 11/11/21 | 130 |
| 11/12/21 | 138 |
| 11/13/21 | 81 |
| 11/14/21 | 0 |
| 11/15/21 | 146 |
| 11/16/21 | 93 |
| 11/17/21 | 142 |
| 11/18/21 | 226 |
| 11/19/21 | 206 |
| 11/20/21 | 218 |
| 11/21/21 | 107 |
| 11/22/21 | 92 |
| 11/23/21 | 52 |
| 11/24/21 | 115 |
| 11/25/21 | 77 |
| 11/26/21 | 27 |
| 11/27/21 | 135 |
| 11/28/21 | 169 |
| 11/29/21 | 71 |
| 11/30/21 | 79 |
| 12/01/21 | 108 |
| 12/02/21 | 126 |
| 12/03/21 | 125 |
| 12/04/21 | 124 |
| 12/05/21 | 148 |
| 12/06/21 | 90 |
| 12/07/21 | 55 |
| 12/08/21 | 72 |
| 12/09/21 | 143 |
| 12/10/21 | 170 |
| 12/11/21 | 189 |
| 12/12/21 | 215 |
| 12/13/21 | 150 |
| 12/14/21 | 214 |
| 12/15/21 | 282 |
| 12/16/21 | 395 |
| 12/17/21 | 797 |
| 12/18/21 | 707 |
| 12/19/21 | 972 |
| 12/20/21 | 840 |
| 12/21/21 | 707 |
| 12/22/21 | 961 |
| 12/23/21 | 1511 |
| 12/24/21 | 1828 |
| 12/25/21 | 1591 |
| 12/26/21 | 2205 |
| 12/27/21 | 1384 |
| 12/28/21 | 824 |
| 12/29/21 | 1561 |
| 12/30/21 | 3484 |
| 12/31/21 | 3290 |
| 01/01/22 | 2710 |
| 01/02/22 | 3178 |
| 01/03/22 | 3044 |
| 01/04/22 | 1592 |
| 01/05/22 | 2611 |
| 01/06/22 | 4789 |
| 01/07/22 | 3586 |
| 01/08/22 | 4204 |
| 01/09/22 | 4578 |
| 01/10/22 | 3875 |
| 01/11/22 | 2929 |
| 01/12/22 | 3512 |
| 01/13/22 | 3392 |
| 01/14/22 | 3099 |
| 01/15/22 | 5977 |
Chapter 17 contents
- Introduction
- Simple Linear Regression
- Relationship between the slope and the correlation
- Estimation of linear regression coefficients
- OLS, RMA, and smoothing functions
- Testing regression coefficients
- ANCOVA – analysis of covariance
- Regression model fit
- Assumptions and model diagnostics for Simple Linear Regression
- References and suggested readings (Ch17 & 18)