14.5 – Nested designs
Introduction
Crossed versus nested design
Factors are independent variables whose values we control and wish to study because we believe they have an effect on the dependent variable. While it is logical to think of factors and levels within factors as independent variables fully under our control, a moments reflection will come up with examples in which the groups (levels) depend on the factor.
Crossed – each level of a factor is in each level of the other factor. This was illustrated in Chapter 14.1 on Crossed, balanced, fully replicated two-way ANOVA.
Nested – levels of one factor are NOT the same in each of the levels of the other factor. Nested designs are an important experimental design in science, and they have some advantages over the 2-way ANOVA design (for one), but they also have limitations.
Classic examples of nesting: culturing and passage of cell lines in routine cell colony maintenance means that even repeated experiments are done on different experimental units. Cells derived from one vial are different from cells derived from a different vial. Similarly, although mice from an inbred strain are thought to be genetically identical, environments vary across time, so mice from the same strain but born or purchased at different times are necessarily different. These scenarios involving time create a natural block effect. Thus, cells are nested by block effect passage number and mice are nested by block effect colony time. We introduced randomized block design in the previous Chapter 14.4.
Statistical model
If Factor B is nested within Factor A, then a group or level within Factor B occurs only within a level of Factor A. Like the randomized block model, there will be no way to estimate the interaction in a nested two-way ANOVA. Our statistical model then is

Examples
Example 1. Three different drugs, 6 different sources of the drugs. The researcher obtains three different drugs from 6 different companies and wants to know if one of the drugs is better than another drug (Factor A) in lowering the blood cholesterol in women. There is always the possibility that different companies will be better or worse at making the drug. So the researchers also use the Factor Source (Factor B) to examine this possibility. Unfortunately they can not obtain all drugs from the same sources. This leads to a Nested ANOVA — notice that each drug is obtained from a different source.
We CANNOT perform the typical two-factor ANOVA because we cannot get a mean of the different drugs by combining the same levels of the Sources: the data is NOT crossed. The Sources of the drugs (Factor B) are NESTED within the type of Drug (Factor A): each source is only found in one of the Drug categories. So, we can’t calculate a mean for the Drug levels independent of the SOURCE from which the drug came.
Table 1. Example of a nested design
|
Drug A
|
Drug B
|
Drug C
|
|||
|
Source 1
|
Source 2
|
Source 3
|
Source 4
|
Source 5
|
Source 6
|
|
202.6
|
189.3
|
212.3
|
203.6
|
189.1
|
194.7
|
|
207.8
|
198.5
|
204.4
|
209.8
|
219.9
|
192.8
|
|
190.2
|
208.4
|
221.6
|
204.1
|
196.0
|
226.5
|
|
211.7
|
205.3
|
209.2
|
201.8
|
205.3
|
200.9
|
|
201.5
|
210.0
|
222.1
|
202.6
|
204.0
|
219.7
|
Scroll to end of this page to get the data set in stacked worksheet format, or click here.
Compare Table 1 to CROSSED data structure (Table 2) — a typical two-factor ANOVA — which would look like
Table 2. Contents of Table 1 presented as crossed design
|
Drug A
|
Drug B
|
Drug C
|
|||
|
Source 1
|
Source 2
|
Source 1
|
Source 2
|
Source 1
|
Source 2
|
|
202.6
|
189.3
|
?
|
?
|
?
|
?
|
|
207.8
|
198.5
|
?
|
?
|
?
|
?
|
|
190.2
|
208.4
|
?
|
?
|
?
|
?
|
|
211.7
|
205.3
|
?
|
?
|
?
|
?
|
|
201.5
|
210.0
|
?
|
?
|
?
|
?
|
We can take a mean of the different drugs by combining the same levels of the Sources. Here’s the nested design (Table 3).
Table 3. Group means, nested design
|
Drug A
|
Drug B
|
Drug C
|
|||
|
Source 1
|
Source 2
|
Source 3
|
Source 4
|
Source 5
|
Source 6
|
|
202.76
|
202.3
|
213.92
|
204.38
|
202.86
|
206.92
|
We can take a mean of the different drugs by combining the same levels of the Sources. Here’s the crossed design (Table 4).
Table 4. Groups means by crossed design.
|
Drug A
|
Drug B
|
Drug C
|
|||
|
Source 1
|
Source 2
|
Source 1
|
Source 2
|
Source 1
|
Source 2
|
|
202.76
|
202.3
|
?
|
?
|
?
|
?
|
Why the “?” in Table 2 and 4? Manufacturing source 1 & 2 do not sell Drug B and Drug C. So, there cannot be a crossed design.
Why can’t we just use a One-Way ANOVA? Can’t we just ANALYZE the three DRUGS separately, ignoring the source issue (after all, the drugs are not all made by the same manufacturer)? But it is not a one-way ANOVA problem… Here’s why.
The researcher suspects that the response of a particular drug might be dependent upon the particular source from which the drug was purchased. So, the type of source from which the drug was purchased is another FACTOR. Thus, drugs from one source might have more (less) affect compared to drugs from another source regardless of the type of drug. However, each drug is NOT available from each source. Thus the research design can NOT be crossed and Drug is NESTED within Source.
We can ask ONLY two questions (hypotheses) from this NESTED ANOVA research design:
HO: There is no difference in the average effect of the drugs on (tumor size, cholesterol level, blood pressure, etc.)
HA: There is a difference in the average effect of the drugs on (tumor size, cholesterol level, blood pressure, etc.)
HO: There is no difference in the average effect of the drugs on (tumor size, cholesterol level, blood pressure, etc.) purchased from different manufacturers.
HA: There is a difference in the average effect of the drugs on (tumor size, cholesterol level, blood pressure, etc.) purchased from different manufacturers.
Notice that we do NOT examine the effect of the interaction between Drug type and source of the drug. Why not?
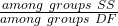
Table 5. Sources of Variation in Nested ANOVA
| Source of Variation |
Sum of Squares
|
DF
|
Mean Squares
|
| Total |  |
 |
|
| Among all subgroups |  |
 |
|
| Among Groups |  |
 |
 |
| Among Subgroups |  |
 |
 |
| Error |
Subtract all of the subgroup Sums of Squares from the Total Sums of Squares
|
 |
 |
Testing nested ANOVA with one main factor
Perhaps surprisingly given the number of terms above, there are only two hypothesis tests, and, only one of REAL interest to us. There are exceptions (eg, quantitative genetics provides many examples), but we are generally most interested in the among group test — this is the test of the main factor. In our example, the main factor was DRUG and whether the drugs differed in their effects on cholesterol levels. The second test is important in the sense that we prefer that it contributes little or no variation to the differences in cholesterol levels. But it might.
Table 6. F statistics for nested ANOVA
| F for the main effect is given as |  |
| F for the subgroup is given by |  |
| and of course, use the appropriate DF when testing the F values!! The Critical Value F0.05 (2), df numerator, df denominator | |
One way to look at this: it would not make sense to conclude that an effect of the main group was significant if the variation in the subgroups was much, much larger. That’s in part why we test the main effect with the subgroups MS and not the error MS. If variation due to the nested variable is not significant, then it is an estimate of the error variance, too.
The nested model we are describing is a two factor ANOVA, but it is incomplete (compared to the balanced, fully crossed 2-way design we’ve talked about before). We don’t have scores in every cell. Instead, each level of nested factor is paired with one and only one level of the other factor. In our example, Source is paired with only one other level of the other factor Drug (eg, Source 1 goes with Drug 1 only), but the main effect is paired with 2 levels of the nesting factor (eg, Drug 1 is manufactured at Source 1 and Source 2).
Note 1. Nesting is strictly one way. Drug is not nested within source, for example.
Some important points about testing the null hypotheses in a nested design. For one, the test of the effect of the nesting factor (Source) is confounded by the interaction between the main factor. We don’t actually know if the interaction is present, but we also get no way to test for it because of the incomplete design. We must therefore be cautious in our interpretation of the effect of the nested factor.
Consider our example. We want to interpret the effect of source as the contribution to the response based on variation among the different suppliers of the drugs. It might be good to know that some drug manufacturer is better (or worse) than others. However, differences among the sources for the different drugs are completely contained in the main effect factor (the test of effects of the different drugs themselves on the response). Therefore, the observed differences between sources COULD be entirely due to the effects of the different drugs and have nothing to do with variation among sources!!
Questions
- Identify the response variable and whether the described factor (in all caps) is suitable for crossed design or nested design
a. In a breeding colony of lab mice, BREEDERS are used to generate up to five LITTERS; effects on offspring REPRODUCTIVE SUCCESS.
b. Effects of individual TEACHERS at different SCHOOLS on STUDENT LEARNING in biology.
c. Lisinopril, an ACE-inhibitor drug prescribed for treatment of high blood pressure, is now a generic drug, meaning a number of COMPANIES can manufacture and distribute the medication. Millions of DOSES of lisinopril are made each year; drug companies are required by the FDA to record when a dose is made and to record these dates by LOT NUMBER. - Work the example data set provide in this page. After loading the data set into Rcmdr (R), use linear model. The command to nest requires use of the forward slash, /. For example, if factor b is nested within factor a, then a/b. The linear model formula then,
Model <- lm(Obs ~ a/b, data=source)
- Describe the problem, i.e., what is a? What is b? What are the hypotheses?
- What is the statistical model?
- Test the model.
- Conclusions?
Quiz Chapter 14.5
Nested designs
Data set used in this page
| Drug | Source | Obs |
| A | s1 | 202.6 |
| A | s1 | 207.8 |
| A | s1 | 190.2 |
| A | s1 | 211.7 |
| A | s1 | 201.5 |
| A | s2 | 189.3 |
| A | s2 | 198.5 |
| A | s2 | 208.4 |
| A | s2 | 205.3 |
| A | s2 | 210 |
| B | s3 | 212.3 |
| B | s3 | 204.4 |
| B | s3 | 221.6 |
| B | s3 | 209.2 |
| B | s3 | 222.1 |
| B | s4 | 203.6 |
| B | s4 | 209.8 |
| B | s4 | 204.1 |
| B | s4 | 201.8 |
| B | s4 | 202.6 |
| C | s5 | 189.1 |
| C | s5 | 219.9 |
| C | s5 | 196 |
| C | s5 | 205.3 |
| C | s5 | 204 |
| C | s6 | 194.7 |
| C | s6 | 192.8 |
| C | s6 | 226.5 |
| C | s6 | 200.9 |
| C | s6 | 219.7 |
Chapter 14 contents
14.2 – Sources of variation
Introduction
Sources of variation, or components of the two-way ANOVA include two factors, each with two or more levels (groups), and collectively, factors are often referred to as the main effects in these types of ANOVA. The other source of variation in a two-way ANOVA is the interaction between the two factors. Below, I have listed the important components, although I have not included how the sum of squares are calculated. You are expected to know the sources of variation for this most basic two-way ANOVA table (Fig 1). You should also be able to solve any missing elements in one of these tables by utilizing any included information.
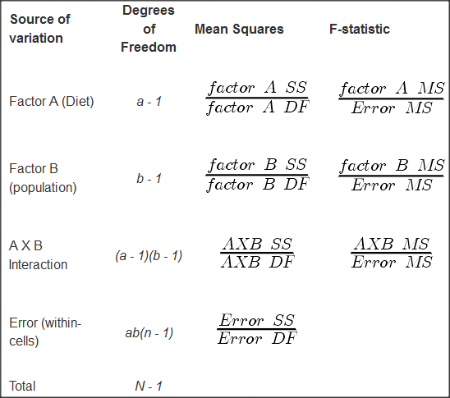
Figure 1. ANOVA table for two-way, balanced, replicated design.
Taking each row from Figure 1 one at a time we have
| Source | DF | Mean Squares | F-statistic |
| First Factor |  |
 |
 |
where Source refers to the source of variation, DF refers to Degrees of Freedom, a is the number of levels (groups) of the first factor, SS refers to Sum of Squares, and MS refers to the Mean Squares.
Next is the second factor
| Source | DF | Mean Squares | F-statistic |
| First Factor |  |
 |
 |
where b is the number of levels (groups) of the second factor. Next is the interaction between the first and second factors.
| Source | DF | Mean Squares | F-statistic |
| Interaction |  |
 |
 |
and lastly the Within-cell Error or residual source of variation
| Source | DF | Mean Squares | F-statistic |
| Error |  |
 |
 |
where n is the number of experimental units for each group. Note that if the sample size differs for one or more groups (levels),then the design would be unbalanced and this formula does not work to determine the degrees of freedom. The total degrees of freedom for the two-way ANOVA is simply N – 1, where N is the sample size for the entire problem; a little algebra shows that N may be calculated as

Unbalanced designs
An unbalanced design implies that observations are missing value for one or more groups. What to do if data are missing? Decision depends on how the data are missing (see Chapter 5). For example, if data are missing at random with respect to treatment, then this should not affect inference. If data are missing not at random, then inference, logically, must be impacted. Calculating the ANOVA, moreover, becomes a different matter. In the one-way ANOVA, no real problem arises although setting up contrasts among the levels requires a weighting term to be factored into the calculations. For higher-level ANOVA involving two or more factors the sums of squares for treatment effects are no longer simple partitioning into the different sources of variation. The sources overlap and the order by which the Factors enter into the statistical model now affects the calculations. Thus, while setting up the calculations for the balanced design is straight-forward, perhaps surprisingly, if group sizes differ, this simple relationship for calculating the degrees of freedom, sums of squares, and Mean squares become an unsolvable problem. This problem is largely solved by the general linear model.
Questions
- Based on the results of a two-way ANOVA, the error sums of squares (SSE) was computed to be 160. If we ignore one of the factors and perform a one-way ANOVA using the same data, will the SSE be the same as in the two-way ANOVA, or will it increase? Decrease? Explain your choice.
- While conducting a two-way ANOVA, you conclude that a statistically significant interaction exists between factor 1 and factor 2. What should be your next step? Do you drop the interaction term from the model and redo the analysis or do you report the results of factor effects including the non-significant interaction?
Quiz Chapter 14.2
Sources of variation
Chapter 14 contents
12.2 – One way ANOVA
Introduction
In ANalysis Of VAriance, or ANOVA for short, we likewise have tools to test the null hypothesis of no difference between between categorical independent variables — often called factors when there’s just a few levels to keep track of — and a single, dependent response variable. But now, the response variable is quantitative, not qualitative like the  tests.
Analysis of variance, ANOVA, is such an important statistical test in biology that we will take the time to “build it” from scratch. We begin by reminding you of where you’ve been with the material.
We already saw an example of this null hypothesis. When there’s only one factor (but with two or more levels), we call the analysis of means and “one-way ANOVA.” In the independent sample t-test, we tested whether two groups had the same mean. We made the connection between the confidence interval of the difference between the sample means and whether or not it includes zero (ie, no difference between the means). In ANOVA, we extend this idea to a test of whether two or more groups have the same mean. In fact, if you perform an ANOVA on only two groups, you will get the exact same answer as the independent two-sample t-test, although they use different distributions of critical values (t for the t-test, F for the ANOVA — a nice little fact for you square the t-test statistic, you’ll get the F-test statistic:  ).
Let’s say we have an experiment where we’ve looked at the effect of different three different calorie levels on weight change in middle-aged men.
I’ve created a simulated dataset which we will use in our ANOVA discussions. The data set is available at the end of this page (scroll down or click here).
We might graph the mean weight changes ( SEM); Below are two possible outcomes of our experiment (Fig 1).
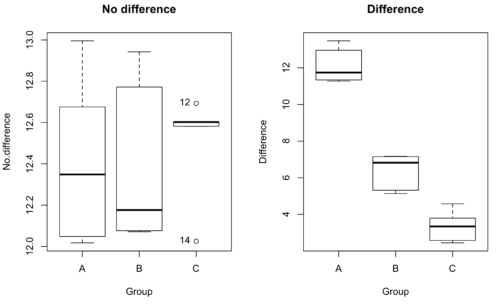
Figure 1. Hypothetical results of an experiment, box plots. Left, no difference among groups; Right, large differences among groups.
As statisticians and scientists, we would first calculate an overall or grand mean for the entire sample of observations; we know this as the sample mean whose symbol is  . But this overall mean is made up of the average of the sample means. If the null hypothesis is true, then the all of the sample means all estimate the overall mean. Put another way, being a member of a treatment group doesn’t matter, ie, there is no systematic effect, all differences among subjects are due to random chance.

The hypotheses among are three groups or treatment levels then are:

Null that there are no differences among the group means. And the alternative hypotheses include any (or all) of the following possibilities

or maybe

or… have we covered all possible alternate outcomes among three groups?
In either case, we could use one-way ANOVA to test for “statistically significant differences.”
Three important terms you’ll need for one-way ANOVA
FACTOR: We have one factor of interest. For example, a factor of interest might be
- Diet fed to hypertensive subjects (men and women)
- Distribution of coral reef sea cucumber species in archipelagos
- Antibiotic drug therapy for adolescents with Acne vulgaris (click see Webster 2002 for review).
Note 1: Character vs factor. In R programming, while it is true that a treatment variable can be a character vector like Gender*, such vectors are handled by R as string. In contrast, by claiming Gender as a factor, R handles the variable as a nominal data type. Hence, ANOVA and other GLM functions expect any treatment variable to be declared as a factor:
Gender <- c("Gender non-conforming", "Men", "Non-binary", "Transgender", "Women", "Declined"); Gender
[1] "Gender non-conforming" "Men" "Non-binary" "Transgender"
[5] "Women" "Declined"
# it’s a string vector, not a factor
is.factor(Gender)
[1] FALSE
Change string vector to a factor.
Gender <- as.factor(Gender); is.factor(Gender) [1] TRUE
* For discussions of ethics of language inclusivity and whether or not such information should be gathered, see Henrickson et al 2020.
LEVELS: We can have multiple levels (2 or more) within the single factor. Some examples of levels for the Factors listed:
- Three diets (DASH), diet rich in fruits & vegetables, control diet)
- Five archipelagos (Hawaiian Islands, Line Islands, Marshal Islands, Bonin Islands, and Ryukyu Islands)
- Five antibiotics (ciprofloxacin, cotrimoxazole, erythromycin, doxycycline, minocycline).
RESPONSE: There is one outcome or measurement variable. This variable must be quantitative (ie, on the ratio or interval scale). Continuing our examples then
- Reduction in systolic pressure
- Numbers of individual sea cucumbers in a plot
- number of microcomedo.
Note 2: A comedo is a clogged pore in the skin; a microcomedo refers to the small plug. Yes, I had to look that up, too.
The response variable can be just about anything we can measure, but because ANOVA is a parametric test, the response variable must be normally distributed!
Note on experimental design
As we discuss ANOVA, keep in mind we are talking about analyzing results from an experiment. Understanding statistics, and in particular ANOVA, informs how to plan an experiment. The basic experimental design is called a completely randomized experimental design, or CDR, where treatments are assigned to experimental units at random.
In this experimental design, subjects (experimental units) must be randomly assigned to each of these levels of the factor. That is, each individual should have had the same probability of being found in any one of the levels of the factor. The design is complete because randomization is conducted for all levels, all factors.
Thinking about how you would describe an experiment with three levels of some treatment, we would have
Table 1. Summary statistics of three levels for some ratio scale response variable.
| Level 1 |
sample mean1 |
sample standard deviation1 |
| Level 2 |
sample mean2 |
sample standard deviation2 |
| Level 3 |
sample mean3 |
sample standard deviation3 |


Note 3: Table 1 is the basis for creating the box plots in Figure 1.
ANOVA sources of variation
ANOVA works by partitioning total variability about the means (the grand mean, the group means). We will discuss the multiple samples and how the ANOVA works in terms of the sources of variation. There are two “sources” of variation that can occur:
- Within Group Variation
- Among Groups Variation
So let’s look first at the variability within groups, also called the Within Group Variation.
Consider and experiment to see if DASH diet reduces systolic blood pressure in USA middle-aged men and women with hypertension (Moore et al 2001). After eight weeks we have
We get the corrected sum of squares, SS, for within group

and the degrees of freedom, DF, for within groups

where i is the identity of the groups,  is the individual observations within group i,
 is the group i mean, ni is the sample size within each group, N is the total sample size of all subjects for all groups, and k is the number of groups.
Importantly, this value is also referred to as “error sums of squares” in ANOVA. It’s importance is as follows — In our example, the within group variability would be zero if and only if all subjects within the same diet lost exactly the same amount of weight. This is hardly ever the case of course in a real experiment. Because there are almost always some other unknown factors or measurement error that affect the response variable, there will be some unknown variation among individuals who received the same treatment (within the same group). Thus, the error variance will generally be larger than zero.
The first point to consider: your ANOVA will never result in statistical differences among the groups if the error variance is greater than the second type of variability, the variability between groups.
The second type of variability in ANOVA is that due to the groups or treatments. Individuals given a calorie-restricted diet will lose some weight; individuals allowed to eat a calorie-rich diet likely will gain weight, therefore there will be variability (a difference) due to the treatment. So we can calculate the variability among groups. We get the corrected sum of squares for among groups

and the degrees of freedom for among groups

where i is the identity of the groups, is the grand mean as defined in Measures of Central Tendency (Chapter 3.1), is the group i mean, ni is the sample size within each group, N is the total sample size of all subjects for all groups, and k is the number of groups.
The sums of squares here is simply subtracting the mean of each population from the overall mean.
- If the Factor is not important in explaining the variation among individuals then all the population means will be similar and the sums of squares among populations would be small.
- If the Factor is important in explaining some of the variation among the individuals then all the population means will NOT be the same and the sums of squares among populations would be large.
Finally, we can identify the total variation in the entire experiment. We have the total sum of squares.

Thus, the insight of ANOVA is that variation in the dataset may be attributed to a portion explained by differences among the groups and differences among individual observations within each group. The inference comes from recognizing that if the among group effect is greater than the within group effect, then there will be a difference due to the treatment levels.
Mean squares
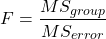
To decide whether the variation associated with the among group differences are greater than the within group variation, we calculate ratios of the sums of squares. These are called Mean Squares or MS for short. The ratio of the Mean Squares is called F, the test statistic for ANOVA.
For the one-way ANOVA we will have two Mean Squares and one F, tested with degrees of freedom for both the numerator  , and denominator
 ).
The Mean Square for (among) groups is

The Mean Square for error is

And finally, the value for F, the test statistic for ANOVA, is
Worked example with R
A factor with three levels, A, B, and C
group <- c("A", "A", "A", "B", "B", "B", "C", "C", "C")
and their responses, simulated
response <- c(10.8, 11.8, 12.8, 6.5, 7, 8, 3.8, 2.8, 3)
We create a data frame
all <- data.frame(group, response)
Of course, you could place the data into a worksheet and then import the worksheet into R. Regardless, we now have our dataset.
Now, call the ANOVA function, aov, and assign the results to an object (eg, Model.1)
Model.1 <- aov(response ~ group, data=all)
Now, visualize the ANOVA table
summary(Model.1)
and the output from R, the ANOVA table, is shown below
Note 4: Rcmdr: Statistics → Means → One-way ANOVA… see figures 2 and 3 below
Table 2. Output from aov() command, the ANOVA table, for the “Difference” outcome variable.
           Df   Sum Sq    Mean Sq   F value       Pr(>F)
group       2   111.16      55.58     89.49    0.0000341 ***
Residuals   6     3.73       0.62
---
Signif. codes: 0 '***' 0.001 '**' 0.01 '*' 0.05 '.' 0.1 ' ' 1
Let’s take the ANOVA table one row at a time
- The first row has subject headers defining the columns.
- The second row of the table “groups” contains statistics due to group, and provides the comparisons among groups.
- The third row, “Residuals” is the error, or the differences within groups.
Moving across the columns, then, for each row, we have in turn,
- the degrees of freedom (there were 3 groups, therefore 2 DF for group),
- the Sums of Squares, the Mean Squares,
- the value of F, and finally,
- the P-value.
R provides a helpful guide on the last line of the ANOVA summary table, the “Signif[icance] codes,” which highlights the magnitude of the P-value.
Note 5: On the use of “error” and “residuals.” Error refers to the difference between an observed value and the true population value. Residual is the difference between an observed value and a value predicted by a model. In ANOVA, the “error variance” or “residual variance” is the variation within groups unexplained by the tested factor. It is what remains after the effects of the model are accounted for.
What to report? ANOVA problems can be much more complicated than the simple one-way ANOVA introduced here. For complex ANOVA problems, report the ANOVA table itself! But for the one-way ANOVA it would be sufficient to report the test statistic, the degrees of freedom, and the p-value, as we have in previous chapters (eg, t-test, chi-square, etc.). Thus, we would report:
F = 89.49, df = 2 and 6, p = 0.0000341
where F = 89.49 is the test statistic, df = 2 (degrees of freedom for the among group mean square) and 6 (degrees of freedom for the within group mean square), and p = 0.0000341 is the p-value.
In Rcmdr, the appropriate command for the one-way ANOVA is simply
Rcmdr: Statistics → Means
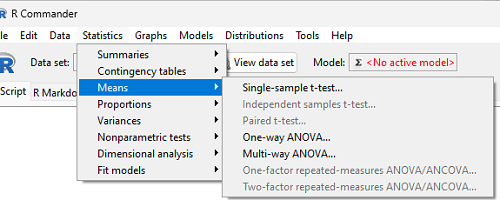
Figure 2. Screenshot Rcmdr select one-way ANOVA.
which brings up a simple dialog. R Commander anticipates factor (Groups) and Response variable. Optional, choose Pairwise comparisons of means for post-hoc test (Tukey’s) and, if you do not want to assume equal variances (see Chapter 13), select Welch F-test.
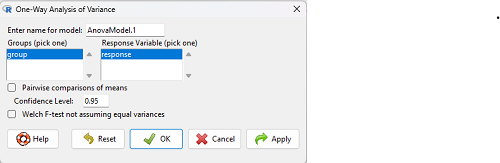
Figure 3. Screenshot Rcmdr select one-way ANOVA options.
Questions
1. Review the example ANOVA Table and confirm the following
- How many levels of the treatment were there?
- How many sampling units were there?
- Confirm the calculation of
 and using the formulas contained in the text.
- Confirm the calculation of F using the formula contained in the text.
- The degrees of freedom for the F statistic in this example were 2 and 6 (F2,6). Assuming a two-tailed test with Type I error rate of 5%, What is the critical value of the F distribution (see Appendix 20.4)
2. Repeat the one-way ANOVA using the simulated data, but this time, calculate the ANOVA problem for the “No.difference” response variable.
3. Leaf lengths from three strains of Arabidopsis thaliana plants grown in common garden are shown in Fig 2. Data are provided for you in the following R script.
arabid <- c("wt","wt","wt","AS1","AS1","AS1","AS2","AS2","AS2")
leaf <- c(4.909,5.736,5.108,6.956,5.809,6.888,4.768,4.209,4.065)
leaves <- data.frame(arabid,leaf)
- Write out a null and alternative hypotheses
- Conduct a test of the null hypothesis by one-way ANOVA
- Report the value of the test statistic, the degrees of freedom, and the P-value
- Do you accept or reject the null hypothesis? Explain your choice.
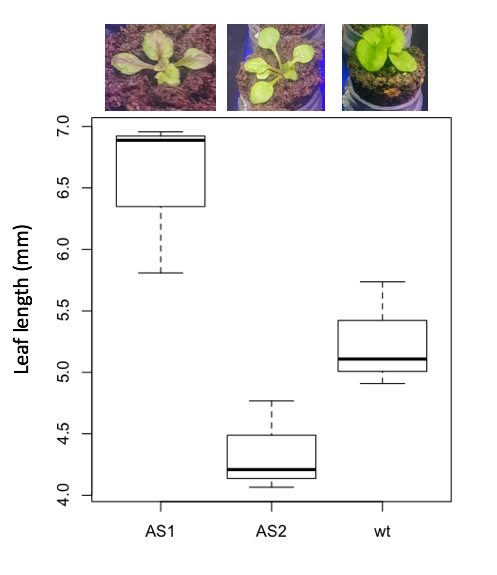
Figure 4. Box plot of lengths of leaves of a 10-day old plant from on of three strains of Arabidopsis thaliana.
4. Return to your answer to question 7 from Chapter 12.1 and review your answer and modify as appropriate to correct your language to that presented here about factors and levels.
5. Conduct the one-way ANOVA test on the Comet assay data presented question 7 from Chapter 12.1. Data are copied for your convenience to end of this page. Obtain the ANOVA table and report the value of the test statistics, degrees of freedom, and p-value.
a. Based on the ANOVA results, do you accept or reject the null hypothesis? Explain your choice.
Quiz Chapter 12.2
One-way ANOVA
Data used in this page
Difference, no difference
Table 12.2 Difference or No Difference
| Group | No.difference | Difference |
|---|---|---|
| A | 12.04822 | 11.336161 |
| A | 12.67584 | 13.476142 |
| A | 12.99568 | 12.96121 |
| A | 12.01745 | 11.746712 |
| A | 12.34854 | 11.275492 |
| B | 12.17643 | 7.167262 |
| B | 12.77201 | 5.136788 |
| B | 12.07137 | 6.820242 |
| B | 12.94258 | 5.318743 |
| B | 12.0767 | 7.153992 |
| C | 12.58212 | 3.344218 |
| C | 12.69263 | 3.792337 |
| C | 12.60226 | 2.444438 |
| C | 12.02534 | 2.576014 |
| C | 12.6042 | 4.575672 |
Comet assay, antioxidant properties of tea
Data presented in Chapter 12.1
Chapter 12 contents
12.1 – The need for ANOVA
Introduction
Moving from an experiment with two groups to multiple groups is deceptively simple: we move from one comparison to multiple comparisons. Consider an experiment in which we have randomly assigned patients to receive one of three doses of a statin drug (lower cholesterol), including a placebo (eg, Tobert and Newman 2015). Thus, we have three groups or levels of a single treatment factor and we’ll want to test the null hypothesis that the group (level) means are all equal as opposed to the alternative hypothesis in which one or more of the group means, eg, group A, Group B, group C, are different.

The correct procedure is to analyze multiple levels of a single treatment with a one-way analysis of variance followed by a suitable post-hoc (“after this”) test. Two common post-hoc tests are Tukey’s range test (aka Tukey’s HSD [honestly significant difference] test), which is for all pairwise comparisons, or the Dunnett’s test, which compares groups against the control group. Post-hoc tests are discussed in Chapter 12.6.
Note. To get the number of pairwise comparisons  of
 observations, let
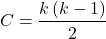
for more on pairwise comparisons, see 10.1 – Compare two independent sample means
For our three group experiment, how many pairwise comparisons can be tested? Therefore,  , and we have
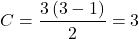
Thus, for our three groups, A, B, and C, there are three possible pairwise comparisons.
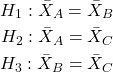
How many pairwise comparisons for a four group experiment? Check your work, you should get  .
The multiple comparison problem
Let’s say that we’re stubborn. We could do many single two-sample t-tests — certainly, your statistical software won’t stop you — this is a situation that calls for statistical reasoning. Here’s why we should not: we will increase the probability of rejecting a null hypothesis when the null hypothesis is true (eg, discussion in Jafari and Ansari-Pour 2019). That is, the chance we will commit a Type I error increases if we do not account for the lack of independence in these sets of pairwise tests evaluated by t-tests. This is multiplicity or the multiple comparison problem.
Review: when we perform a two-sample t-test we are willing to reject a true null hypothesis 5% of the time. This is what is meant by setting the critical probability value (alpha) = 0.05. By “willing” we mean that we know that our conclusions could be wrong because we ar3 working with samples, not the entire population. (Of course at the time, we have no way of actually knowing WHEN we are wrong, but we do want to know how likely we could be wrong!) However, if we compare three population means we have three separate null hypotheses.
HO: one or more of the means are different.
But if we conduct these as separate independent sample t-tests, then we are implicitly making the following null hypothesis statements:
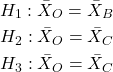
Thus, we have a 5% chance of being wrong for the first hypothesis and/or a 5% chance of being wrong for the second hypothesis and/or a 5% chance of being wrong for the third hypotheses. The chance that we will be wrong for at least one of these hypotheses must now be greater than 5%.
For three separate hypotheses there is a 14% chance of being wrong when we have the probability value for each individual t-test set at α = 0.05. How did we get this result? The point is that these tests are not independent, they are done on the same data set, therefore you can’t simply apply the multiplication probability rule.
Here’s how to figure this: for the set of three hypotheses, the probability of incorrectly rejecting at least one of the null hypotheses is

So, for three t-tests on the same experiment, the Type I error overall tests (experiment-wise) is actually 14% not 5%. It gets worse as the number of combinations (groups and therefore hypotheses) increases. For four groups, Type I error is actually

That’s 26.5%, not 5%.
If we have just five populations means to compare the probability of rejecting a null hypothesis when it is true climbs to 60%! How did this happen? The probability or correctly rejecting all of them is now

So, the probability of incorrectly rejecting one test (Type I error) is now

instead of the 5% we think we are testing.
The key argument for why you must use ANOVA to analyze multiple samples instead of a combination of t-tests!! ANOVA guarantees that the overall error rate is the specified 5%.
Why is the Type I error not 5% for each test? Because we conducted ONE experiment, we can conduct only ONE test (we could be right, we could be wrong 5% of the time). If we conduct the experiment over again, on new subjects, each time resulting in new and therefore independent data sets, then Type I error = 5% for each of these independent experiments.
Now, I hope I have introduced you to the issue of Type I error at the level of a single comparison and the idea of an experiment, holding Type I error-rates at 5% across all hypotheses to be evaluated in an experiment. You may wonder why anyone would make this mistake now. Actually, people make this “mistake” all the time and in some fields like evaluating gene expression for microarray data, this error was the norm, not the exception (see for example discussion of this in Jeanmougin et al 2010).
To conclude, if one does multiple tests on the same experiment, whether it is t-tests or some other test for that matter, then our subsequent tests are related. This is what we mean by independence in statistics — and there are many ways that nonindependence may occur in experimental research. For example, we introduced the concept of pseudoreplication, when observations are treated as if they are independent, but they are not (see Chapter 5.2). The “multiple comparison problem” specifically refers to the lack of independence when all the data set from a single experiment is parsed into lots of separate tests. Philosophically, there must be a logical penalty — and that is reflected in the increase in Type I error.
Clearly something must be done about this!
Corrections to account for the multiple comparisons problem
The family-wise (aka experiment-wise) error rate for multiple comparisons is kept at 5%, and each individual-wise comparison is compared against a more strict (ie, smaller Type I error rate). Put another way, the family-wise error rate is the chance of a number of false positives: making a mistake when we consider many tests simultaneously. The simplest correction for the individual-wise error rate is the Bonferroni correction: test each individual comparison at Type I error equal to  , where C is the number of comparisons. The Šidák correction,
 , and the Holm-Bonferroni method are alternatives with reportedly better statistical properties (eg, reduced Type II error rates; Ludbrook 1998, Sauder and DeMars 2019).
ANOVA is a solution
One possible solution for getting the correct experiment-wise error rate: adjust for differences in probability for multiple comparisons with the t-test. We used post-hoc tests presented above: you could evaluate the tests after accounting for the change in Type I error. This is what is done in many cases. For example, in genomics. In the early days of gene expression profiling by microarray, it was common to see researchers conduct t-tests for each gene. Since microarrays can have thousands of genes represented on the chip, then these researchers were conducting thousands of t-tests, arranging the t-tests by P-value and counting the number of P-values less than 5% and declaring that the differences were statistically significant.
This error didn’t stand long, and there are now many options available to researchers to handle the “multiple comparisons” problem (some probably better than others, research on this very much an ongoing endeavor in biostatistics). The Bonferroni correction was an available solution, largely replaced by the Holm (aka Holm-Bonferroni) method (Holm 1979). Recall that the Bonferroni correction judged individual p-values statistically significant only if they were less than , where, again, α is the family-wise error rate (eg, α = 5%) and C was the number of comparisons. The Holm method orders the C p-values from lowest to highest rank. The method then evaluates lowest p-value, if less than , then reject hypothesis for that comparison. Proceed to next p-value, if less than , then reject hypothesis for that comparison, and so on until no more comparisons are less than .
A MUCH better alternative is to perform a single analysis that takes the multiple-comparisons problem into account: Single Factor ANOVA, also called the one-way ANOVA, plus the post-hoc tests with error correction. We introduce one-way ANOVA in the next section. Post-hoc tests are discussed in Chapter 12.6.
Questions
- You should be able to define and distinguish how Bonferoni correction, Dunnett’s test, and Tukey’s test methods protect against inflation of Type I error.
- What will be the experiment-wise error rate for an experiment in which there are only two treatment groups?
- Experiment-wise error rate may also be called _______________ error rate.
- List and compare the three described posthoc approaches to correct for multiple comparison problem,
- Glycophosphate-tolerant soybean is the number one GMO (genetically modified organism) crop plant worldwide. Glycophosphate is the chief active ingredient in Roundup, the most widely used herbicide. A recent paper examined “food quality” of the nutrient and elemental composition of plants drawn from fields which grow soy by organic methods (no herbicides or pesticides) and GMO plants subject to herbicides and pesticides. A total of 28 individual t-tests were used to compare the treatment groups for different levels of nutrients and elements (eg, vitamins, amino acids, etc.,); the authors concluded that 10 of these t-tests were statistically significant at Type I error rate of 5%. Discuss the approach to statistical inference by the authors of this report; include correct use of the terms experiment-wise and individual-wise in your response and suggest an alternative testing approach if it is appropriate in your view.
- In Chapter 4.2 we introduced a data set from an experiment. The experiment looked at DNA damage quantified by measuring qualities in a Comet Assay including the Tail length, the percent of DNA in the tail, and olive moment. The data set is copied to end of this page. In the next chapter I’ll ask you to conduct the ANOVA on this experiment. For now, answer the following questions.
a. What is the response variable? Defend your choice(s).
b. Why is this an ANOVA problem? Include as part of your explanation a statement of the null hypothesis.
Quiz Chapter 12.1
The need for ANOVA
Data used in this page
comet assay dataset
| Treatment | Tail | TailPercent | OliveMoment* |
|---|---|---|---|
| Copper-Hazel | 10 | 9.7732 | 2.1501 |
| Copper-Hazel | 6 | 4.8381 | 0.9676 |
| Copper-Hazel | 6 | 3.981 | 0.836 |
| Copper-Hazel | 16 | 12.0911 | 2.9019 |
| Copper-Hazel | 20 | 15.3543 | 3.9921 |
| Copper-Hazel | 33 | 33.5207 | 10.7266 |
| Copper-Hazel | 13 | 13.0936 | 2.8806 |
| Copper-Hazel | 17 | 26.8697 | 4.5679 |
| Copper-Hazel | 30 | 53.8844 | 10.238 |
| Copper-Hazel | 19 | 14.983 | 3.7458 |
| Copper | 11 | 10.5293 | 2.1059 |
| Copper | 13 | 12.5298 | 2.506 |
| Copper | 27 | 38.7357 | 6.9724 |
| Copper | 10 | 10.0238 | 1.9045 |
| Copper | 12 | 12.8428 | 2.5686 |
| Copper | 22 | 32.9746 | 5.2759 |
| Copper | 14 | 13.7666 | 2.6157 |
| Copper | 15 | 18.2663 | 3.8359 |
| Copper | 7 | 10.2393 | 1.9455 |
| Copper | 29 | 22.6612 | 7.9314 |
| Hazel | 8 | 5.6897 | 1.3086 |
| Hazel | 15 | 23.3931 | 2.8072 |
| Hazel | 5 | 2.7021 | 0.5674 |
| Hazel | 16 | 22.519 | 3.1527 |
| Hazel | 3 | 1.9354 | 0.271 |
| Hazel | 10 | 5.6947 | 1.3098 |
| Hazel | 2 | 1.4199 | 0.2272 |
| Hazel | 20 | 29.9353 | 4.4903 |
| Hazel | 6 | 3.357 | 0.6714 |
| Hazel | 3 | 1.2528 | 0.2506 |
Tail refers to length of the comet tail, TailPercent is percent DNA damage in tail, and OliveMoment refers to Olive's (1990), defined as the fraction of DNA in the tail multiplied by tail length