7.2 – Epidemiology basics
Introduction
A principle aim of epidemiology is to identify frequency and causes of illnesses. Kinds of evidence gathered range from case studies to randomized controlled trials, to meta-analysis and systematic reviews. In turn, how these kinds of evidence are evaluated and turned into policy recommendations generally accounts for additional concerns eg, GRADE – Grading of Recommendations Development, Assessment and Evaluation Schünemann et al 2023). Learning about conditional probability in biostatistics is essential for discussing evidence because it provides a rigorous framework for updating strength of evidence based on new, specific information. It allows for the objective assessment of how new evidence — results from a clinical test — influences the likelihood of a hypothesis — presence/absence of disease for a patient. Conditional probability analysis allows interpretation of a positive test result in the context of disease prevalence, which may lead to the paradoxical conclusion that a test with high sensitivity applied to a person belonging to a low at risk group is more likely a false positive than evidence of a true positive.
Thus, to introduce conditional probability, I have elected to push you into epidemiology and risk analysis. We introduced epidemiology definitions and here, we build on basic terminology of epidemiology. Epidemiology is the study of the causes and distribution of health-related events in a population. It is has been called the basic science of public health (p. 16, Decker 2008).
Prevalence rate
Prevalence of a disease (condition), is defined as the proportion of the population that has the disease (condition) at a point or duration in time. The prevalence statistic is the ratio of the number of existing cases divided by the total population.
For example, prevalence of Type 2 diabetes in Hawai`i. The 2020 populations was about 1.4 million. A survey was conducted on a random of 1000 individuals and 80 were reported to have Type 2 diabetes. What is the estimated prevalence of Type 2 diabetes in Hawai`i?
Start from perspective — what if we actually have something close to a census count? For the actual estimates, see the report at the Hawaii State DOH website. With every estimate of a statistic, we need a confidence interval (CI). An approximate (good for large samples) formula for the 95% CI of prevalence is

where  is the 2010 prevalence in the population (8.3%), N is the population size (1,360,301), and z is the standard normal probability. For a 95% CI, then we want z95%.
If you recall, we can get this from our standard normal probability table, or directly from R. We want to know z that is in the ± 2.5% tails of the distribution (that’s 0.05 ÷ 2, see Ch 8.4 – Tails of a test). Our R code then is
qnorm(c(0.025), mean=0, sd=1, lower.tail=FALSE)
which returns
[1] 1.959964
You should confirm that setting lower-tail = TRUE yields -1.96 (rounded).
Alternately, if using Rcmdr: Distributions → Continuous distributions → Normal distribution → Normal quantiles… (Fig 1).
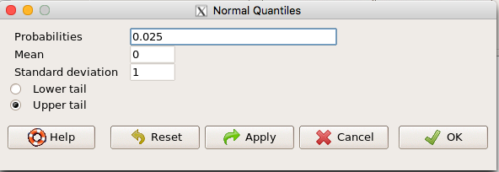
Figure 1. R Commander popup menu for Normal quantiles.
Thus, for our example, the 95% CI was ( ; our confidence in our estimate of the prevalence of diabetes in Hawaii is between 8.25% and 8.35%. Again, note that for our purposes it is OK to calculate the approximate confidence interval, replace
 with
 (for large N, the differences are observed in the 0.001 decimal).
Prevalence: R code
Rather than census counts, more likely we have results of smaller surveys. We use the epi.conf() function from the epiR package. Code adapted from example provided in epiR_descriptive vignette.
Note 1: Many R packages include vignettes, which, together with the package manual, is often helpful to understand what a function is intended to do and how to get the most from the function. R code to call all vignettes available for a package, eg, epiR:
vignette(package="epiR")
which will return names of available vignettes. For epiR, these are
epiR_descriptive Descriptive epidemiology (source, html)
epiR_surveillance Disease surveillance (source, html)
epiR_measures_of_association Measures of association (source, html)
epiR_sample_size Sample size calculations (source, html)
To call up the vignette we need for this example,
vignette("epiR_descriptive", package="epiR")
which brings up the page (assuming you installed the html help files during installation of base R).
library(epiR)
pop.Hawaii = 1.4e06
pop.Survey = 1000
type2.Survey = 80
Table.2 <- as.matrix(cbind(type2.Survey, pop.Survey))
epi.conf(Table.2, ctype = "prevalence", method = "exact", N = pop.Hawaii, design = 1, conf.level = 0.95) * 100
R output
   est    lower    upper
1    8 6.394198 9.857978
Thus, estimated Type 2 diabetes prevalence from the survey was 8, with 95% confidence interval 6.4 to 9.9 cases per 100 individuals. From 2020 U.S. Census, Hawai`i population was 1,455,271.
Note 2: Type 2 diabetes is one of many conditions for which prevalence is greater among Native Hawaiian and Pacific Islander populations compared to other groups in Hawai’i (Galinski et al 2016); these are called health disparitiess.
Incidence rate
Incidence of a disease (or condition) is defined as the occurrence of new cases of a disease. The simplest way to view incidence is that if everyone was followed for the same period of time, then incidence rate is the number of new cases since the start of the study divided by the total population. This is too simplistic, so we define a better metric called person-time. Incidence rate (IR) is then the ratio of the number of new cases divided by total person-time.
Again, incidence rate is an estimate. Therefore, we need a confidence interval. Assuming the population is large, then confidence interval can be calculated as

where IR is the incidence rate, T is the person-time, N is the number of events or cases, and z again is the standard normal probability (z ± 1.96 for 95% confidence interval).
For our example, N = 3 cases, T = 236 p-d, so 95% CI is (11.3%, 14.1%).
Person-time
Person-time can be days, months, years. Person-time is best defined with an example.
Five men join a study that will last 70 days. These men were selected because they had suffered a myocardial infarction (MI) and at the start of the study, they receive the same treatment. The outcome of the study is whether or not the subjects suffer a second MI.
The results are shown below
Subject A, 53 days
Subject B, 70 days
Subject C, 24 days
Subject D, 70 days
Subject E, 19 days
Add up the person days,

Now calculate the incidence rate,

that’s 3 cases (A, C, E) divided by 236 p-d = 0.0127. Multiply this by 1000 and we get our final answer for the incidence rate, 12.7 per person-days.
Incidence rate: R code
Incidence rate of myocardial infarction (MI) study. Code adapted from example provided in epiR_descriptive vignette.
ncas = 3
ntar = 236
tmp <- as.matrix(cbind(ncas, ntar))
epi.conf(tmp, ctype = "inc.rate", method = "exact", N = 1000, design = 1, conf.level = 0.95) * 1000
R output
          est    lower    upper
ncas 12.71186 2.621492 37.14946
The incidence rate of myocardial infarction was 12.7 (95% CI 2.6 to 37.2) cases per 1000 person-days.
Age-specific rates
Incidence or prevalence rates may be reported for specific age groups. For example, we can distinguish between number of live births in Hawaii in 2017, and numbers of live births by age group of the mother.
Age-adjusted rates
If populations with different age demographics, then the convention is to adjust the populations to a standard reference population with known age and other demographic properties. For example, the CDC uses the 2000 census as the standard population (CDC definitions, age adjustment, retrieved January 2023).
Questions
- Calculate the confidence interval of type 2 prevalence in Hawai`i with the 2020 census population value. How much did it change?
- Recalculate the confidence interval for a 99% confidence interval. Which estimate communicates greater confidence in the estimate?
Quiz
Quiz Chapter 7.2
Epidemiology basics
Chapter 7 contents
7.1 – Epidemiology definitions
Introduction
This subchapter may lack for drama, but let’s start by providing a list of key terms with definitions as you start our introduction to epidemiology. More definitions will follow in the sections as well.
Definitions
Absolute risk: The probability that a specified event will occur in a specified population. See Ch07.4 – Epidemiology: Relative risk and absolute risk, explained.
Absolute risk reduction (ARR): the decrease in risk of an event in an exposed (treatment) group compared to an unexposed (control) group. Also called the risk difference.  , see Contingency table. See Ch07.4 – Epidemiology: Relative risk and absolute risk, explained.
 : Control Event Rate and Experimental Event Rate. In observational studies, transition from “control” and “experimental” to exposure terms. For example, prospective or retrospective cohort studies,
 is Exposed Event Rate and its partner
 , Unexposed Event Rate. Equivalently, you will encounter
 for Incidence in the Exposed and
 forIncidence in the Unexposed. For Case-Control studies, where the direct event (incidence) rates over time are unavailable, then becomes Exposure Rate in Cases — the proportion of people with the condition who were exposed to the risk factor and
 is now Exposure Rate in Controls.
Contingency table, also called cross tabulation or crosstab, is a display of counts of variables in a matrix format. We briefly introduced the contingency table in Chapter 5.1. In epidemiology, rows of contingency table represent treatment or exposure groups, columns represent outcomes.
Table 1. A 2 X 2 contingency table
| Outcome | ||
| Yes | No | |
| Treatment or exposed group | a | b |
| Control or nonexposed group | c | d |
The 2X2 contingency table is referred to frequently in this chapter and again in Chapter 9.
R code
a = 4; b = 46; c = 5; d = 45

Table1 <- matrix(c(a,b,c,d), 2, 2, byrow=TRUE, dimnames = list(c("Treatment", "Control"), c("Yes", "No"))); Table1
R output
          Yes  No
Treatment   4  46
Control     5  45
In statistical classification, a field dedicated to establishing algorithms for correctly identifying and predicting classes of data, eg, correct disease diagnosis or , the 2X2 contingency table is often called a confusion or error matrix (Greene 2003). Machine learning methods are often built on developments from statistical classification findings (Michie et al 1995). We expand on contingency tables in Chapter 7.4 and Chapter 9.2.
Note 1: First discussed in Chapter 5.1, by convention, the standard format for an epidemiological 2×2 contingency table organizes exposure on the rows and disease outcome on the columns as follows:
- Rows (Exposure): The top row represents Exposed / Treatment (Yes), and the bottom row represents Non-exposed / Control (No).
- Columns (Outcome): The left column represents Disease / Case (Yes), and the right column represents No Disease / Control (No). See Chapter 7.
Control event rate (CER): How often an event occurs in the control group.  , see Contingency table.
Diagnosis: identification of the nature of a disease or condition.
Event: From probability theory, an event is a set of one or more outcomes to which a probability is assigned to each outcome.
Experimental event rate (EER): How often an event occurs in the treatment group.  , see Contingency table.
Exposure risk: the potential for harm from contact with or vulnerability to a hazard or risk factor.
Hazard: anything that can cause harm.
Incidence: the number of newly diagnosed individuals in a population having a condition, disease or other characteristic. Compare to prevalence.
Likelihood: In every-day English, the term likelihood and probability mean the same thing — the chance that an event will occur. In statistics, however, probability refers to possible outcomes in the future — a prediction for an event to occur, whereas likelihood is associated with the possible explanation (hypothesis) for the outcome that has already occurred, the past. Put another way, likelihood quantifies how likely is the data we observe, given the hypothesis (cf. excellent discussion by Gallistel 2015)? We will look at likelihood methods in practice in subsequent chapters.
Negative predictive value of a test (NPV), defined as the probability that a negative test result identifies a person who truly does not have the disease. Calculated as the total number of individuals without the disease divided by the total that tested negative. 
Number needed to treat (NNT): the inverse of the absolute risk reduction. 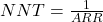 . See Ch07.4 – Epidemiology: Relative risk and absolute risk, explained.
Odds, the ratio (OR) of two probabilities: the probability of getting a one on throwing a dice is  , the probability of not getting a one is
 , therefore the odds of getting a one are 1 to 5.
 . See Ch07.5 – Odds ratio.
Outcome, the single result from a random experiment. For example, result of a single coin toss is “heads.” Results of a birth, the outcome is the child born is a singleton, single birth.
Per capita rate, Latin phrase, for each head, meaning per person.
Positive predictive value of a test (PPV), defined as the probability that a positive test result identifies a person who truly has the disease. Calculated as the total number of individuals with the disease divided by the total that tested positive. 
Posttest probability refers to the probability that the patient has the disease after the results of the test are known.
Pretest probability is the prevalence of the disease, ie, the chance that the a randomly selected person from the population has the disease.
Prevalence: The proportion of individuals in a population having a condition, disease, or characteristic. Compare to incidence.
Probability, defined in Chapter 6.1.
Prognosis, how a disease plays out.
Relative risk: Ratio of the risk of an event among those exposed to the risk factor to the risk among those not exposed to the risk factor. See Ch07.4 – Epidemiology: Relative risk and absolute risk, explained.
Relative risk reduction (RRR): is a measure calculated by dividing the absolute risk reduction by the control event rate. See Ch07.4 – Epidemiology: Relative risk and absolute risk, explained.
Risk: Probability of an event. Risk is not restricted to just bad events, but refers to the uncertainty of a particular event (eg, the risk that a child will be born male seems a melodramatic statement, but it is accurate as far as this definition goes).
Therapy, treatment intended to treat, relieve, or cure a disorder of condition.
Questions
- Compare and contrast ARR and RRR.
- What’s the difference between event, hazard, and risk?
- What’s the difference between incidence and prevalence?
- What’s the difference between diagnosis and prognosis?
- What’s the implication of a NNT greater than 100 in terms of the utility of a proposed therapy or treatment?
Quiz
Quiz Chapter 7.1
Epidemiology definitions
Chapter 7 contents
- Introduction
- Epidemiology definitions
- Epidemiology basics
- Conditional Probability and Evidence Based Medicine
- Epidemiology: Relative risk and absolute risk, explained
- Odds ratio
- Confidence intervals
- References and suggested readings