13.4 – Tests for Equal Variances
Introduction
In order to carry out statistical tests correctly, we must test our data first to see if our sample conforms to the assumptions of the statistical test. If our data do not meet these assumptions, then inferences drawn may be incorrect. How far off our inferences may be depends on a number of factors, but mostly it depends on how far from the expectations our data are.
One assumption we make with parametric tests involving ratio scale data is that the data could be from a normally distributed population. The other key assumption introduced, but not described in detail for the two-sample t-test, was that the variability in the two groups must be the same, ie, homoscedasticity. Thus, in order to carry out the independent sample t-test, we must assume that the variances are equal.
There are two general reasons we may want to concern ourselves with a test for the differences between two variances
- The t-test (and other tests like one-way ANOVA) requires that the two samples compared have the same variances. If the Variances are Not Equal we need to perform a modified t-test (see Welch’s formula).
- We may also be interested in the differences between the variances in two populations.
Example 1: In genetics we might be interested in the difference between the variability of response of inbred lines (little genetic variation but environmental variation) versus an outbred populations (lots of genetic and environmental variation).
Example 2: Environmental stress can cause organisms to have developmental instability. This might cause organisms to be more variable in morphology or the two sides (right & left) of an organism may develop non-symmetrically. Therefore, polluted environments might cause organisms to have greater variability compared to non-polluted environments.
The first way to test the variances is to use the F test. This works for two groups.

For more than two groups, we’ll use different tests (eg, Bartlett’s test, Levene’s test).
Remember that the formula for the sample variance is
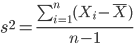
The Null Hypothesis is that the two samples have the same variances:

The Alternative Hypothesis is that the two samples do not have the same variances:

Note: I prefer to evaluate this as a one-tailed test: identify the larger of the two variances and take that as the numerator Then, the null hypothesis is that

and therefore, the alternative hypothesis is that (ie, a one-tailed test).

Another way to state equal variance test is that we are testing for homogeneity of variances. You may run across the term homoscedasticity; it is the same thing, just a different three dollar word for “equal variances.”
Stated yet another way, if we reject the null hypothesis, then the variances are unequal or show heterogeneity. An additional and equivalent $3 word for inequality of variances is called heteroscedasticity.
More about the F-test
For the F-test, the null hypothesis is that the variances are equal. This means that the “expected” F value will be one: F = 1.0. (The F-distribution differs from t-distribution because it requires 2 values for DF, and ranges from 1 to infinity for every possible combination of v1 and v2).
To evaluate the null hypothesis we need the degrees of freedom. For the F test we need two different degrees of freedom, one set for each group): from Table 2, Appendix – F distribution, look up 5% Type I error line in this table because we make it one tailed.
I need the F-test statistic at 
Examples of difference between two variances, Table 1.
Sample 1: Aggressiveness of Inbred Mice (number of bites in 30 minutes)
Sample 2: Aggressiveness of Outbred Mice (number of bites in 30 minutes)
Table 1. Aggression by inbred and outbred mice.
| Sample 1
Aggressiveness of Inbred Mice |
Sample 2
Aggressiveness of Outbred Mice |
| 3 | 4 |
| 5 | 10 |
| 4 | 4 |
| 3 | 7 |
| 4 | 7 |
| 5 | 10 |
| 4 = mean | 7 = mean |
- Identify the null and alternative hypotheses
- Calculate Variances
- Calculate F-test
- The “test statistic” for this hypothesis test was F = 7.2 / 0.8 = 9.0
- Determine Critical Value of the F table (Table 2, Appendix – F distribution)
Example of how to find the critical values of the F distribution for  and numerator
 and denominator
 .
Table 2. Portion of F distribution, see Appendix – F distribution.
| α = 0.05 | v1 | ||||||||
| 1 | 2 | 3 | 4 | 5 | 6 | 7 | 8 | ||
| v2 | 1 | 230 | |||||||
| 2 | 19.3 | ||||||||
| 3 | 9.01 | ||||||||
| 4 | 6.26 | ||||||||
| 5 | 6.61 | 5.79 | 5.41 | 5.19 | 5.05 | 4.95 | 4.88 | 4.82 | |
| 6 | |||||||||
Or, instead of using tables, use R
Rcmdr: Distributions → F distribution → F probabilities
and enter the numbers as shown below (Fig 1).
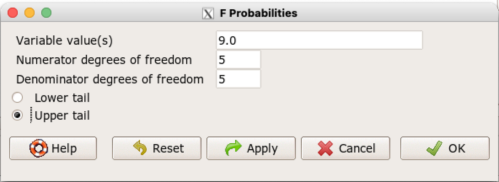
Figure 1. Screenshot R Commander F distribution probabilities.
This will return the p-value, and you would interpret this against your Type I error rate of 5% as you do for other tests.
From Table 2, Appendix – F distribution we find 
And the p-value = 0.015
pf(c(9), df1=5, df2=5, lower.tail=FALSE)
[1] 0.01537472
Question: Reject or Accept null hypothesis?
Question: What is the biological interpretation or conclusion from this result?
R code
Rather than play around with the tables of critical values, which are awkward and old-school (and I am showing you these stats tables so that you get a feel for the process, not so you’d actually use them in real practice), use Rcmdr to generate the F test and therefore return the F distribution probability value. As you may expect, R provides a number of options for testing the equal variances assumption, including the F test. The F test is limited to only two groups and, because it is a parametric test, it also makes the assumption of normality, so the F test should not be viewed as necessarily the best test for the equal variances assumption among groups. We present it here because it is a logical test to understand and because of its relevance to the Mean Square ratios in the ANOVA procedures.
So, without further justification, here is the presentation on how to get the F test in Rcmdr. At the end of this section I present a better procedure than the F test for evaluating the equal variance assumption called the Levene test.
Return to the bite data in the table above and enter the data into an R data frame. Note that the data in the table above are unstacked; R expects the data to be stacked, so either create a stacked worksheet and transcribe the data appropriately into the cells of the worksheet, or, go ahead and enter the values into two separate columns then use the Stack variables in active data set… command from the Data menu in Rcmdr.
Then, proceed to perform the F test.
Rcmdr: Statistics → Variances → Two variances F-test…
The first context menu popup is where you enter the variables (Fig 2).
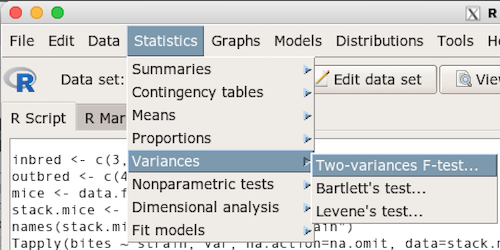
Figure 2. Screenshot data options R Commander F test
Because there are only two variables in the data set and because Strain contains the text labels of inbred or outbred whereas the other variable is numeric data type, R will correctly select the variables for you by default. Select the “Options” tab to set the parameters of the F test (Fig 3).
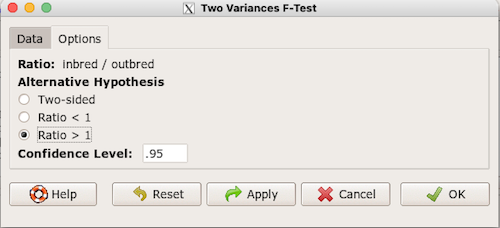
Figure 3. Screenshot menu options R Commander F test.
When you are finished setting the alternative hypothesis and confidence levels, proceed with the F test by clicking the OK button.
    F test to compare two variances

data:  mice.aggression
F = 0.1111, num df = 5, denom df = 5, p-value = 0.03075
alternative hypothesis: true ratio of variances is not equal to 1
95 percent confidence interval:
 0.01554788 0.79404243
sample estimates:
ratio of variances
         0.1111111
End of R output.
Levene’s test of equal variances
We will discuss this test in more detail following our presentation on ANOVA. For now, we note that the test works on two or more groups and is a conservative test of the equal variance assumption. Nonparametric tests in general make fewer assumptions about the data and in particular make no assumption of normality like the F test. It is in this context that the Levene’s test would be preferable over the F test. Below we present only how to calculate the statistic in R and Rcmdr and provide the output for the same mouse data set.
Assuming the data are stacked, obtain the Levene’s test in Rcmdr by clicking on (Fig 4).
Rcmdr: Statistics → Variances → Levene’s test…
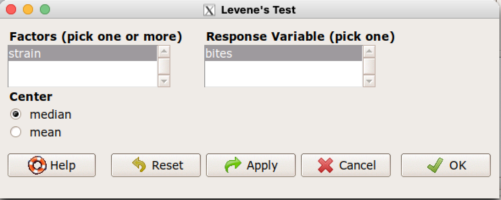
Figure 4. Screenshot menu options R Commander Levene’s test.
Select the median and the factor variable (in our case “Strain”) and the numeric outcome variable (“Bites”), then click OK button.
Tapply(bites ~ strain, var, na.action=na.omit, data=mice.aggression) # variances by group
inbred outbred
   0.8     7.2

leveneTest(bites ~ strain, data=mice.aggression, center="median")
Levene's Test for Homogeneity of Variance (center = median)
      Df F value  Pr(>F)
group  1       4 0.07339 .
      10
---
Signif. codes:  0 '***' 0.001 '**' 0.01 '*' 0.05 '.' 0.1 ' ' 1
End of R output
Compare the p-values. In both cases — F test and Levene’s test — we’re testing the same hypothesis (equal variances), but the p-values do not agree between the parametric F test and the nonparametric Levene’s test! If we were to go by the results of the F test, p-value was 0.031, less than out Type I error of 5% and we would tentatively conclude that the assumption of equal variances may not apply. On the other hand, if we go with the Levene’s test the p-value was 0.074, which is greater than our Type I error rate of 5% and we would therefore conclude the opposite, that the assumption of equal variances might apply! Both conclusions can’t hold, so which test result of equal variances do we prefer, the parametric F test or the nonparametric Levene’s test? Answer — we’d go with Levene’s because the F test is parametric and, therefore, also assumes normality.
Cahoy’s bootstrap method
Draft. Cahoy (2010). Variance-based statistic bootstrap test of heterogeneity of variances. we discuss bootstrap methods in Chapter 19.2; in brief, bootstrapping involves resampling the dataset and computing a statistic on each sample. This method may be more powerful, that is, more likely to correctly reject the null hypothesis when warranted, compared to Levene’s test.
for now, install package testequavar.
Function for testing two samples.
equa2vartest(inbred, outbred, 0.05, 999)
R output
[[1]]
[1] "Decision: Reject the Null"
$Alpha
[1] 0.05
$NumberOfBootSamples
[1] 999
$BootPvalue
[1] 0.006
The output “Decision: Reject the Null” reflects output from a box-type acceptance region.
Compare results from Levene’s test: p-value 0.07339 suggests accept hypothesis of equal variances, whereas bootstrap method indicates variances heterogenous, ie, reject equal variance hypothesis. However, re-running the test without setting the seed for R’s pseudorandom number generator will result in different p-values. For example, I re-ran Cahoy’s test five times with the following results:
0.008
0.006
0.002
0.01
0.004
Questions
- Test assumption of equal variances by Bartlett’s method and by Levene’s test on
OliveMomentvariable from the Comet tea data set introduced in Chapter 12.1. Do the methods agree? If not, which test result would you choose?- BONUS. Retest homogeneous variance hypothesis by
equa3vartest(Copper.Hazel, Copper, Hazel, 0.05, 999). Reject or fail to reject the null hypothesis by bootstrap method?
- BONUS. Retest homogeneous variance hypothesis by
- Test assumption of equal variances by Bartlett’s method and by Levene’s test on
Heightfrom the O’hia data set introduced in Chapter 12.7. Do the methods agree? If not, which result would you choose?- BONUS. Retest homogeneous variance hypothesis by
equa3vartest(M.1, M.2, M.3, 0.05, 999). Reject or fail to reject the null hypothesis by bootstrap method?
- BONUS. Retest homogeneous variance hypothesis by
Quiz Chapter 13.4
Tests for Equal Variances
R code reminders
The bootstrap method expects the variables in unstacked format. A simple method to extract the variables from the stacked data is to use a command like the following. For example, extract OliveMoment values for Copper-Hazel treatment.
Copper.Hazel <- cometTea$OliveMoment[1:10]
For Copper, Hazel, replace above with [11:20], and [21-30] respectively. Note: changed variable name from Copper-Hazel to Copper.Hazel. The hyphen is a reserved character in R.
Chapter 13 contents
8.1 – The null and alternative hypotheses
Introduction
Classical statistical parametric tests — t-test (one sample t-test, independent sample-t-test), analysis of variance (ANOVA), correlation, and linear regression— and nonparametric tests like  (chi-square: goodness of fit and contingency table), share several features that we need to understand. It’s natural to see all the details as if they are specific to each test, but there’s a theme that binds all of the classical statistical inference in order to make claim of “statistical significance.”
- a calculated test statistic
- degrees of freedom associated with the calculation of the test statistic
- a probability value or p-value which is associated with the test statistic, assuming a null hypothesis is “true” in the population from which we sample.
- Recall from our previous discussion (Chapter 8.2) that this is not strictly the interpretation of p-value, but a short-hand for how likely the data fit the null hypothesis. P-value alone can’t tell us about “truth.”
- in the event we reject the null hypothesis, we provisionally accept the alternative hypothesis.
Statistical Inference in the NHST Framework
By inference we mean to imply some formal process by which a conclusion is reached from data analysis of outcomes of an experiment. The process at its best leads to conclusions based on evidence. In statistics, evidence comes about from the careful and reasoned application of statistical procedures and the evaluation of probability (Abelson 1995).
Formally, statistics is rich in inference process (Bzdok et al, 2018). We begin by defining the classical frequentist, aka Neyman-Pearson approach, to inference, which involves the pairing of two kinds of statistical hypotheses: the null hypothesis (HO) and the alternative hypothesis (HA). The null hypothesis assumes that any observed difference between the groups are the results of random chance (introduced in Ch 2.3 – A brief history of (bio)statistics ), where “random chance” implies that outcomes occur without order or pattern (Eagle 2021). Whether we reject or accept the null hypothesis — a short-hand for the more appropriate “provisionally reject” in light of the humility that our results may reflect a rare sampling event — based on the outcome of our statistical inference, the inference is evaluated against a decision criterion (cf discussion in Christiansen 2005), a fixed statistical significance level (Lehmann 1992). Significance level refers to the setting of a p-value threshold before testing is done. The threshold is often set to Type I error of 5% (Cowles & Davis 1982), but researchers should always consider whether this threshold is appropriate for their work (Benjamin et al 2017).
This inference process is referred to as Null Hypothesis Significance Testing, NHST. Additionally, a probability value will be obtained for the test outcome or test statistic value. In the Fisherian likelihood tradition, the magnitude of this statistic value can be associated with a probability value, the p-value, of how likely the result is given the null hypothesis is “true.” (Again, keep in mind that this is not strictly the interpretation of p-value, it’s a short-hand for how likely the data fit the null hypothesis. P-value alone can’t tell us about “truth”, per our discussion, Chapter 8.2.)
Note 1: About reporting p-values, -logP. A Google search will likely reveal “logP,” which is a measure in chemistry. In contrast, “-logP” pertains to how to report p-values in statistics. P-values are traditionally reported as a decimal, like 0.000134, in the closed (set) interval (0,1) — p-values can never be exactly zero or one. The smaller the value, the less the chance our data agree with the null prediction. Small numbers like this can be confusing, particularly if many p-values are reported, like in many genomics works, eg, GWAS studies. In the past, small p-values would be reported as “less than,” eg, < 0.001. This was done in part because of the misleading impression of precision that many significant figures can represent (see discussion in Lang and Altman 2014).
-logP is an alternative, particularly for GWAS studies where the significance level may be much smaller than 5%. Thus, instead of reporting vanishingly small p-values, studies may report the negative log10 p-value, or -logP. Instead of small numbers, large numbers are reported, the larger, the more against the null hypothesis. Thus, our p-value becomes 3.87 -logP.
R code
-1*log(0.000134,10)
[1] 3.872895
Why log10 and not some other base transform? Just that log10 is convenience — powers of 10.
The antilog of 3.87 returns our p-value
> 10^(-1*3.872895)
[1] 0.0001340001
For convenience, a partial p-value -logP transform table
| P-value | -logP |
| 0.1 | 1 |
| 0.01 | 2 |
| 0.001 | 3 |
| 0.0001 | 4 |
On your own, complete the table up to -logP 5 – 10. See Question 7 below.
NHST Workflow
We presented in the introduction to Chapter 8 without discussion a simple flow chart to illustrate the process of decision (Fig 1, Chapter 8). Here, we repeat the flow chart diagram and follow with descriptions of the elements.
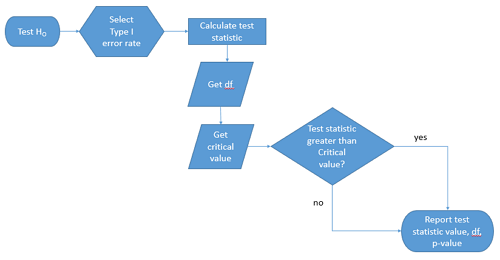
Figure 1. Flow chart of inductive statistical reasoning.
What’s missing from the flow chart is the very necessary caveat that interpretation of the null hypothesis is associated with two kinds of error, Type I error and Type II error. These points and others are discussed in the following sections.
We start with the hypothesis statements. For illustration we discuss hypotheses in terms of comparisons involving just two groups, also called two sample tests. One sample tests in contrast refer to scenarios where you compare a sample statistic to a population value. Extending these concepts to more than two samples is straightforward, but we leave that discussion to Chapters 12 – 18.
Null hypothesis
By far the most common application of the null hypothesis testing paradigm involves the comparisons of different treatment groups on some outcome variable. These kinds of null hypotheses are the subject of Chapters 8 through 12.
The Null hypothesis (HO) is a statement about the comparisons, eg, between a sample statistic and the population, or between two treatment groups. The former is referred to as a one tailed test whereas the latter is called a two-tailed test. The null hypothesis is typically “no statistical difference” between the comparisons.
For example, a one sample, two tailed null hypothesis.

and we read it as “there is no statistical difference between our sample mean and the population mean.” For the more likely case in which no population mean is available, we provide another example, a two sample, two tailed null hypothesis.

Here, we read the statement as “there is no difference between our two sample means.” Equivalently, we interpret the statement as both sample means estimate the same population mean.

Under the Neyman-Pearson approach to inference we have two hypotheses: the null hypothesis and the alternative hypothesis. The hull hypothesis was defined above.
Note 2: Tails of a test are discussed further in chapter 8.4.
Alternative hypothesis
Alternative hypothesis (HA): If we conclude that the null hypothesis is false, or rather and more precisely, we find that we provisionally fail to reject the null hypothesis, then we provisionally accept the alternative hypothesis. The view then is that something other than random chance has influenced the sample observations. Note that the pairing of null and alternative hypotheses covers all possible outcomes. We do not, however, say that we have evidence for the alternative hypothesis under this statistical regimen (Abelson 1995). We tested the null hypothesis, not the alternative hypothesis. Thus, it is incorrect to write that, having found a statistical difference between two drug treatments, say aspirin and acetaminophen for relief of migraine symptoms, it is not correct to conclude that we have proven the case that acetaminophen improves improves symptoms of migraine sufferers.
For the one sample, two tailed null hypothesis, the alternative hypothesis is

and we read it as “there is a statistical difference between our sample mean and the population mean.” For the two sample, two tailed null hypothesis, the alternative hypothesis would be

and we read it as “there is a statistical difference between our two sample means.”
Alternative hypothesis often may be the research hypothesis.
It may be helpful to distinguish between technical hypotheses, scientific hypothesis, or the equality of different kinds of treatments. Tests of technical hypotheses include the testing of statistical assumptions like normality assumption (see Chapter 13.3) and homogeneity of variances (Chapter 13.4). The results of inferences about technical hypotheses are used by the statistician to justify selection of parametric statistical tests (Chapter 13). The testing of some scientific hypothesis like whether or not there is a positive link between lifespan and insulin-like growth factor levels in humans (Fontana et al 2008), like the link between lifespan and IGFs in other organisms (Holtzenberger et al 2003), can be further advanced by considering multiple hypotheses and a test of nested hypotheses and evaluated either in Bayesian or likelihood approaches (Chapter 16 and Chapter 17). The advantage of the Bayesian approach is that it returns evidence for or against this hypothesis: if the posterior probability is greater than the prior probability, we can we say that we have evidence for the hypothesis. This is very appealing — the challenge is that the prior probability is inherently subjective (Chapter 6.4), limited by the amount and quality of existing information pertaining to the hypothesis (Prelec 2004).
Note 3: In Bayesian statistics, hypotheses and their parameters are treated as random variables and we can assign them probabilities. The prior probability is your initial belief about the likelihood of an event before adding new data. The posterior probability is the updated probability after new data has been added. Thus, the posterior combines your prior belief with the new information (the likelihood).
In the frequentis approach, the null hypothesis is no difference (no effect); in the Bayesian context, we’d treat this as a point estimate of zero and have to assign it a probability. In the absence of empirical evidence, one option is to set the probability as 50%, equal prior odds. Use of the spike and slab prior is likely a better approach. There’s a lot of work on these points; I refer interested readers to Campbell and Gustafson (2024) for additional readings and discussion.
How to interpret the results of a statistical test.
Any number of statistical tests may be used to calculate the value of the test statistic. For example, a one sample t-test may be used to evaluate the difference between the sample mean and the population mean (Chapter 8.5) or the independent sample t-test may be used to evaluate the difference between means of the control group and the treatment group (Chapter 10). The test statistic is the particular value of the outcome of our evaluation of the hypothesis and it is associated with the p-value. In other words, given the assumption of a particular probability distribution, in this case the t-distribution, we can associate a probability, the p-value, that we observed the particular value of the test statistic and the null hypothesis is true in the reference population.
By convention, we determine statistical significance (Cox 1982; Whitley & Ball 2002) by assigning ahead of time a decision probability called the Type I error rate, often given the symbol α (alpha). The practice is to look up the critical value that corresponds to the outcome of the test with degrees of freedom like your experiment and at the Type I error rate that you selected. The Degrees of Freedom (DF, df, or sometimes noted by the symbol v), are the number of independent pieces of information available to you. Knowing the degrees of freedom is a crucial piece of information for making the correct tests. Each statistical test has a specific formula for obtaining the independent information available for the statistical test. We first were introduced to DF when we calculated the sample variance with the Bessel correction, n – 1, instead of dividing through by n. With the df in hand, the value of the test statistic is compared to the critical value for our null hypothesis. If the test statistic is smaller than the critical value, we fail to reject the null hypothesis. If, however, the test statistic is greater than the critical value, then we provisionally reject the null hypothesis. This critical value comes from a probability distribution appropriate for the kind of sampling and properties of the measurement we are using. In other words, the rejection criterion for the null hypothesis is set to a critical value, which corresponds to a known probability, the Type I error rate.
Before proceeding with yet another interpretation, and hopefully less technical discussion about test statistics and critical values, we need to discuss the two types of statistical errors. The Type I error rate is the statistical error assigned to the probability that we may reject a null hypothesis as a result of our evaluation of our data when in fact in the reference population, the null hypothesis is, in fact, true. In Biology we generally use Type I error α = 0.05 level of significance. We say that the probability of obtaining the observed value AND HO is true is 1 in 20 (5%) if α = 0.05. Put another way, we are willing to reject the Null Hypothesis when there is only a 5% chance that the observations could occur and the Null hypothesis is still true. Our test statistic is associated with the p-value; the critical value is associated with the Type I error rate. If and only if the test statistic value equals the critical value will the p-value equal the Type I error rate.
The second error type associated with hypothesis testing is, β, the Type II statistical error rate. This is the case where we accept or fail to reject a null hypothesis based on our data, but in the reference population, the situation is that indeed, the null hypothesis is actually false. We must also keep in mind that, as we evaluate the p-value relative to the magnitude of the Type I error rate, and if we reject the null hypothesis, we still do not say that we have evidence for the alternative hypothesis.
Thus, we end with a concept that may take you a while to come to terms with — there are four, not two possible outcomes of an experiment.
Outcomes of an experiment
What are the possible outcomes of a comparative experiment\? We have two treatments, one in which subjects are given a treatment and the other, subjects receive a placebo. Subjects are followed and an outcome is measured. We calculate the descriptive statistics aka summary statistics, means, standard deviations, and perhaps other statistics, and then ask whether there is a difference between the statistics for the groups. So, two possible outcomes of the experiment, correct\? If the treatment has no effect, then we would expect the two groups to have roughly the same values for means, etc., in other words, any difference between the groups is due to chance fluctuations in the measurements and not because of any systematic effect due to the treatment received. Conversely, then if there is a difference due to the treatment, we expect to see a large enough difference in the statistics so that we would notice the systematic effect due to the treatment.
Actually, there are four, not two, possible outcomes of an experiment, just as there were four and not two conclusions about the results of a clinical assay. The four possible outcomes of a test of a statistical null hypothesis are illustrated in Table 1.
Table 1. When conducting hypothesis testing, four outcomes are possible.
| HO in the population | |||
| True | False | ||
| Result of statistical test | Reject HO | Type I error with probability equal to
α (alpha) |
Correct decision, with probability equal to
1 – β (1 – beta) |
| Fail to reject the HO | Correct decision with probability equal to
1 – α (1 – alpha) |
Type II error with probability equal to
β (beta) |
|
In the actual population, a thing happens or it doesn’t. The null hypothesis is either true or it is not. But we don’t have access to the reference population, we don’t have a census. In other words, there is truth, but we don’t have access to the truth. We can weight, assigned as a probability or p-value, our decisions by how likely our results are given the assumption that the truth is indeed “no difference.”
If you recall, we’ve seen a table like Table 1 before in our discussion of conditional probability and risk analysis (Chapter 7.3). We made the point that statistical inference and the interpretation of clinical tests are similar (Browner and Newman 1987). From the perspective of ordering a diagnostic test, the proper null hypothesis would be the patient does not have the disease. For your review, here’s that table (Table 2).
Table 2. Interpretations of results of a diagnostic or clinical test.
| Does the person have the disease\? | |||
| Yes | No | ||
| Result of the diagnostic test |
Positive | sensitivity of the test (a) | False positive (b) |
| Negative | False negative (c) | specificity of the test (d) | |
Thus, a positive diagnostic test result is interpreted as rejecting the null hypothesis. If the person actually does not have the disease, then the positive diagnostic test is a false positive.
Questions
- Match the corresponding entries in the two tables. For example, which outcome from the inference/hypothesis table matches specificity of the test \?
- Find three sources on the web for definitions of the p-value. Write out these definitions in your notes and compare them.
- In your own words distinguish between the test statistic and the critical value.
- All of our discussions have been about testing the null hypothesis, about accepting or rejecting, provisionally, the null hypothesis.
- What are the p-values for -logP of 5, 6, 7, 8, 9, and 10 \? Complete the p-value -logP transform table.
- Instead of log10 transform, create a similar table but for negative natural log transform. Which is more convenient? Hint:
log(x, base=exp(1))
Quiz Chapter 8.1
The null and alternate hypothesis