9.5 – Fisher exact test
Introduction
We mentioned that chi-square tests for contingency tables are fine as long as two conditions are met. These are the assumptions of a  test.
- No cell should have expected values less than 5%.
- The test performs poorly at DF = 1 because we are approximating an infinite distribution with an exact test.
You will note that any time you have a 2X2 table, the second condition is always an issue because 2X2 tables have DF=1. Thus, in biomedical research, it is common to have an experiment that may be appropriate for a contingency analysis but the data may suffer from one or both of these limitations. Fisher’s exact test is always an option for these types of problems, but with the advantage that it always returns the exact p-value.
A reminder, the 2×2 table looks like
Table 1. 2×2 table reporting numbers of subjects who have (Yes) or do not have (No) the event.
| Column 1 | Column 2 | ||
| Subjects | Yes | No | |
| Row 1 | Treatment 1 | a | b |
| Row 2 | Treatment 2 | c | d |
where a is the count of Treatment 1 – treated subjects who have the event, b is the count of Treatment 1 – treated subjects who do not have the event, c is the count of Treatment 2 – treated subjects who have the event, d is the count of Treatment 2 – treated subjects who do not have the event. Note the row and column totals:
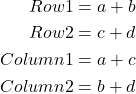
For example, a fairly common, “Gee, that’s curious,” fact is the seven left-handed US Presidents since 1901 (21), is higher than the proportion of left-handers in the general population (about 10%). For comparison, we could ask the same question about Vice Presidents.†
Table 2. U.S. Presidents and Vice-Presidents handedness.
| Subjects | Yes | No |
| Presidents | 7 | 14 |
| Vice presidents | 5 | 20 |
†Seven Vice-Presidents went on to become President, four right-handers, three left-handers.
Ronald A. Fisher came up with a test that is now called “Fisher’s Exact test” that circumvents this problem. It is an extremely useful test to know about because it provides a way to get an exact probability of the outcome compared to all other possible outcomes. Thus, when asked for a possible alternate to the chi-square contingency test for a 2X2 table, you can respond “Fisher’s Exact test.”
Although tedious to calculate by hand, and resource demanding when done by computer because of the multiple factorial expressions, the major advantage of the test is that it does not rely on the assumption that an underlying distribution applies. The Fisher Exact test can be used to calculate the exact probability of the observed outcome (P).
The equation for the Fisher Exact test can be written as
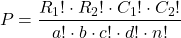
where R stands for row total, C stands for column total, n is the sample size, ! is the factorial, and a, b, c, and d are defined as in Table 1.
How does Fisher’s Exact test work? The data are setup in the usual way for a contingency problem, but now, we calculate the probability for all possible outcomes that we COULD have seen from our experiment, and ask if the actual outcome is unusual (low p-value). The trick is recognizing that you have to keep the totals constrained (note row and column totals stay the same).
Table 3. Original 2X2 contingency table (bold), with the next two more extreme outcomes.
| original data |  |
more extreme | |
next more extreme still | |
| Yes | No | Yes | No | Yes | No |
| 10 | 5 | 11 | 4 | 12 | 3 |
| 4 | 12 | 3 | 13 | 2 | 14 |
 |
 |
 |
I’ve shown just the one-tailed outcomes, so the p-values are for one-tailed tests of hypothesis. The essence of the test is to find all outcomes MORE extreme than the original, in one direction. The one-tailed P-value then is the sum of all probabilities from those more extreme tables of outcomes.
To get the two-tailed probability, remember that you multiply the one-tailed probability by two. More accurate methods are also available (Agresti 1992).
Calculation of Fisher’s test involves using all possible combinations and factorials. Rcmdr has Fisher’s 2X2 built in via the Contingency table and as part of some Rcmdr plugins (eg, RcmdrPlugin.EBM, the Evidence Based Medicine plugin). Here we illustrate Fisher Exact test from the context menu in the main Statistics menu.
Alternatively, there are many web sites out there that provide an online calculator for Fisher’s Exact test. Here’s a link to one such calculator on GraphPad’s web site, cookies must be enabled to run this calculator).
To get the Fisher Exact test, your data must already be summarized into a 2X2 table, in which case you can use R Commander via the Contingency tables… menu selection (Fig 1).
Table 4. 2X2 table smokers vs vitamin use.
| Smoker: No | Smoker: Yes | |
| Vitamin use: No | 14 | 26 |
| Vitamin use: Yes | 19 | 15 |
With the data summarized as in Table 4, we can proceed directly via R Commander to analyze the contingency table, either by Chi-square test of Fisher exact test. First, bring up menu to enter the data (Fig 1):
Rcmdr: Statistics → Contingency tables… → Enter and analyze two-way table…
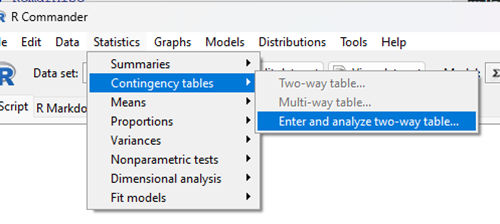
Figure 1. Screenshot Rcmdr menu, Contingency tables.
The image of the R worksheet below contains two columns: Smoker (No, Yes) and Vitamin use (No, Yes). Complete the form (Fig 2).
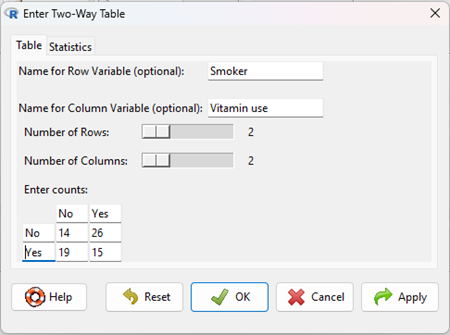
Figure 2. Screenshot Rcmdr menu, Enter Two-Way Table.
Alternatively, if the original data are available, do not tally the counts, let R do the work for you. The worksheet would be stacked like so (Table 5).
Table 5. Portion of subject and row entries in stacked worksheet for smokers vs vitamin use.
| Subject | Vitamin.use | Smoking |
| 1 | No | No |
| 2 | No | No |
| 3 | No | No |
| 4 | No | No |
| 5 | No | No |
| . | . | . |
| 71 | Yes | Yes |
| 72 | Yes | Yes |
| 73 | Yes | Yes |
| 74 | Yes | Yes |
And from the R Commander menu select as before
Rcmdr: Statistics → Contingency tables… → Two way table … (Fig 3).
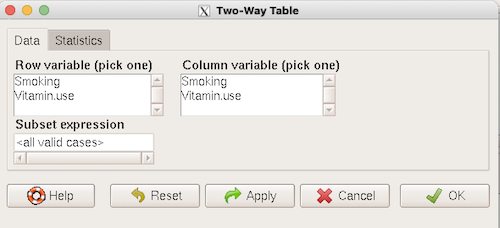
Figure 3. Screenshot Rcmdr two-way table menu, load the data from stacked worksheet.
Data is now ready.
R code
To carry out contingency table analysis on the entered data (Fig 2 or Fig 3), select the Statistics option tab (Fig 4, green arrow).
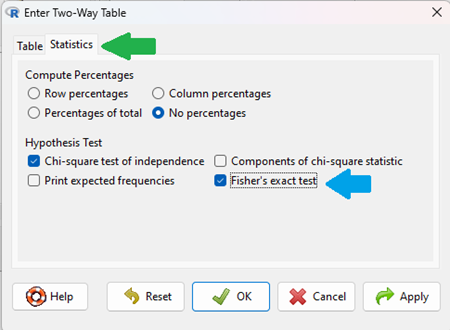
Figure 4. Screenshot Rcmdr menu Statistics option. Select Chi-square test of independence, Fisher’s exact test, or both.
Check the box next to the Fisher’s exact test (Fig 4, blue arrow).
Click OK, and here is the R output.
> fisher.test(.Table)
Fisher's Exact Test for Count Data

data: .Table
p-value = 0.1008
alternative hypothesis: true odds ratio is not equal to 1
95 percent confidence interval:
0.1496417 1.1985775
sample estimates:
odds ratio
0.4302094
We accepted the defaults Is this a one or two-tailed test of hypothesis?
What can we conclude about the null hypothesis? Do we accept or reject?
Want to know what the “odds ratio” is? Follow the link to the next subchapter.
When to use the Fisher Exact Test?
Here’s the take-home message: the Fisher exact test is an alternate and better choice over the contingency table chi-square for 2X2 tables if one or more of the cells has expected values less than 5%. It is also appropriate for cases in which you have only 1 degree of freedom (as do all 2X2 tables!), but it doesn’t make sense if each cell has more than 5% expected values (the calculation is too tedious), but rather, apply the Yate’s correction. As the sample sizes get larger, the different methods converge to virtually identical answers.
Some examples.
Is there an association between final grades and attendance on a randomly selected day?
Table 6. First 2X2 scenario.
| cc | Yes | No |
| Letter grade A | 2 | 3 |
| Other letter grade | 1 | 6 |
Table 7. Second 2X2 scenario.
| cc | Yes | No |
| Letter grade A | 5 | 6 |
| Other letter grade | 2 | 12 |
Table 8. Third 2X2 scenario.
| cc | Yes | No |
| Letter grade A | 10 | 12 |
| Other letter grade | 4 | 24 |
Code hints for tests with direct 2X2 entry with matrix() are
grades.Table <- matrix(c(2,3,1,6), 2, 2, byrow=TRUE)
Chi-square test of independence
chisq.test(grades.Table, correct=FALSE)
Fisher Exact test
fisher.test(grades.Table, alternative = "greater")
Questions
1. Apply Fisher exact test on the four contingency tables (a – d) introduced in section 9.3, question 2. Make note of the p-value from Fisher exact test and from analyses used to complete question 2. Note any trends. (Hint: make sure you are testing the same null hypothesis.)
(a)
| Yes | No | |
| A | 18 | 6 |
| B | 3 | 8 |
(b)
| Yes | No | |
| A | 10 | 12 |
| B | 3 | 14 |
(c)
| Yes | No | |
| A | 5 | 12 |
| B | 12 | 18 |
(d)
| Yes | No | |
| A | 8 | 12 |
| B | 3 | 3 |
Quiz Chapter 9.5
Fisher Exact Test
Chapter 9 contents
9.3 – Yates continuity correction
Introduction
Yates continuity correction: Most statistical textbooks at this point will note that critical values in their table (or any chi-square table for that matter) are approximate, but don’t say why. We’ll make the same directive — you may need to make a correction to the for low sample numbers. It’s not a secret, so here’s why.
We need to address a quirk of the test: the chi-square distribution is a continuous function (if you plotted it, all possible values between, say, 4 and 3 are possible). But the calculated statistics we get are discrete. In our HIV-HG co-infection problem from the previous subchapter, we got what appears to be an exact answer for P, but it is actually an approximation.
We’re really not evaluating our test statistic at the alpha levels we set out. This limitation of the goodness of fit statistic can be of some consequence — increases our chance to commit a Type I error — unless we make a slight correction for this discontinuity. The good news is that the does just fine for most df, but we do get concerned with it’s performance at df = 1 and for small samples.
Therefore, the advice is to use a correction if your calculated is close to the critical value for rejection/acceptance of the null hypothesis and you have only one df. Use the Yate’s continuity correction to standard calculation,  .
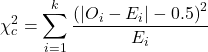
For the 2×2 table (Table 1), we can rewrite Yates correction

Our concern is this: without the correction, Pearson’s test statistic will be biased (eg, the test statistic will be larger than it “really” is), so we’ll end up rejecting the null hypothesis when we shouldn’t (that’s a Type I error). This becomes an issue for us when p-value is close to 5%, the nominal rejection level: what if p-value is 0.051? Or 0.049? How confident are we in concluding accept or reject null hypothesis, respectively?
I gave you three examples of goodness of fit and one contingency table example. You should be able to tell me which of these analyses it would be appropriate to apply to correction.
More about continuity corrections
Yates suggested his correction to Pearson’s back in 1934. Unsurprisingly, new approaches have been suggested (eg, discussion in Agresti 2001). For example, Nicola Serra (Serra 2018; Serra et al 2019) introduced
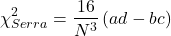
Serra reported favorable performance when sample size was small and the expected value in any cell was 5 or less.
R code
When you submit a 2X2 table with one or more cells less than five, you could elect to use a Fisher exact test, briefly introduced here (see section 9.5 for additional development), or, you may apply the Yates correction. Here’s some code to make this work in R.
Let’s say the problem looks like Table 1.
Table 1. Example 2X2 table with one cell with low frequency.
| Yes | No | |
| A | 8 | 12 |
| B | 3 | 22 |
At the R prompt type the following
library(abind, pos=15)
#abind allows you to combine matrices into single arrays
.Table <- matrix(c(8,12,3,22), 2, 2, byrow=TRUE)
rownames(.Table) <- c('A', 'B')
colnames(.Table) <- c('Yes', 'No') # when you submit, R replies with the following table
.Table  # Counts
 Yes No
A  8 12
B  3 22
Here’s the command; the default is no Yates correction (ie, correct=FALSE); to apply the Yates correction, set correct=TRUE.
.Test <- chisq.test(.Table, correct=TRUE)
Output from R follows
.Test
    Pearson's Chi-squared test with Yates' continuity correction
data:  .Table
X-squared = 3.3224, df = 1, p-value = 0.06834
Compare without the Yates correction
.Test <- chisq.test(.Table, correct=FALSE)
.Test
    Pearson's Chi-squared test
data:  .Table
X-squared = 4.7166, df = 1, p-value = 0.02987
Note that we would reach different conclusions! If we ignored the potential bias of the un-corrected we would be tempted to reject the null hypothesis, when in fact, the better answer is not to reject because Yates-corrected p-value is greater than 5%.
Just to complete the work, what does the Fisher Exact test results look like (see section 9.5)?
fisher.test(.Table)
    Fisher's Exact Test for Count Data
data:  .Table
p-value = 0.04086
alternative hypothesis: true odds ratio is not equal to 1
95 percent confidence interval:
0.9130455 32.8057866
sample estimates:
odds ratio
  4.708908
Which to use? The Fisher exact test is just that, an exact test of the hypothesis. All possible outcomes are evaluated and we interpret the results as likely as p=0.04086 if there is actually no association between the treatment (A vs B) and the outcome (Yes/No) (see section 9.5).
Questions
- With respect to interpreting results from a test for small samples, why use the Yates continuity correction?
- Try your hand at the following four contingency tables (a – d). Calculate the test, with and without the Yates correction. Make note of the p-value from each and note any trends.
(a)
| Yes | No | |
| A | 18 | 6 |
| B | 3 | 8 |
(b)
| Yes | No | |
| A | 10 | 12 |
| B | 3 | 14 |
(c)
| Yes | No | |
| A | 5 | 12 |
| B | 12 | 18 |
(d)
| Yes | No | |
| A | 8 | 12 |
| B | 3 | 3 |
3. Ch09.1, Question 1 provided an example of a count from a small bag of M&Ms. Apply the Yates correction to obtain a better estimate of p-value for the problem. The data were four blue, two brown, one green, three orange, four red, and two yellow candies.
- Construct a table and compare p-values obtained with and without the Yates correction. Note any trend in p-value
Quiz Chapter 9.3
Yates continuity correction
Chapter 9 contents
6.5 – Discrete probability distributions
Binomial distribution
Discrete refers to particular outcomes — data that take on only specific separate values. Discrete data types include all of the categorical types we introduced earlier, including binary, ordinal, and nominal.
The binomial probability distribution is a discrete distribution for the number of successes, k, in a sequence of n independent trials, where the outcome of each trial can take on only one of two possible outcomes. For cases of 0 or 1, yes or no, “heads” or “tails,” male or female, pass or fail, we talk about the binomial distribution, because the outcomes are discrete and there can be only two possible (binary) outcomes.
Note 1: The biological definition of sex is binary — whether sexually reproducing organism produces male (sperm) or female (ovum) gametes (cf discussion in Goymann et al 2022). For the argument that sex is a continuum held by some biomedical and social scientists, see Ainsworth 2015.
The mathematical function of the binomial is written as

where the binomial coefficient is given by
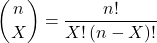
and X refers to the number of ways to choose “success” from n observations.
Consider an example.
We have to define what we mean by success. For coin toss, this might be the number of heads.
The mean for the binomial this is given simply as

where X is “Heads” (the category of successes for our example), and p corresponds to the probability the selected event occurs, in this case, “Heads.”
The variance of the binomial distribution is given by

Here’s a density plot of two trials with success 2% with n (x) equal to 20 (Fig 1).
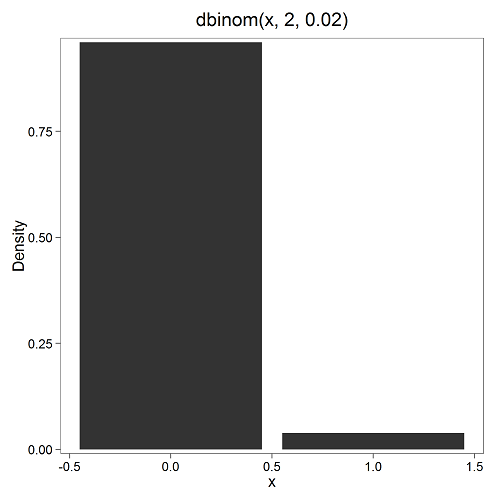
Figure 1. Plot generated with KMggplot2 Rcmdr plugin.
Here’s the R code
Create the trials, 1 through 20, then create an object to hold the number of trials
nSize=1:20
Size <- length(nSize); Size
R returns
[1] 20
Assign the probability value to an object
prob <- 0.02
Next, calculate the mean, mu, and the variance, var, for the binomial with prob = 0.02 and number of trials Size = 20
mu <- Size*prob
var <- Size*prob*(1-prob)
Print the mean and variance; lets assign them to an object then print the object
stats <- c(mu, var); stats
And R returns
[1] 0.400 0.392
And here’s a real-world example. Twinning in humans is rare. In Hawaiʻi in the 1990’s the rate of twin births (monozygotic and dizygotic) was about 20 for every 1000 births or 2%. “Success” here then is twin births.
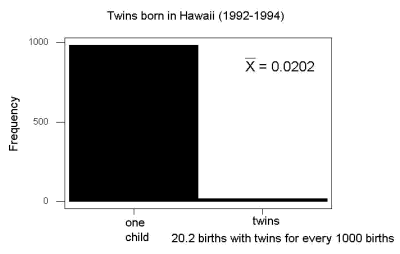
Figure 2. Example of binomial-like distribution: reported twins born in Hawaiʻi.
Interestingly, rates of twins have since increased in Hawaiʻi (31 out of 1000 births) and in the United States overall (33 out of 1000 births) (Table 2, NCHS Data Brief No. 80, 2012). Data for Fig 2 were for year 2009.
Out of ten births, what is the probability of two twin births in Hawaiʻi?

You can solve this with your calculator (yikes!), or take advantage of online calculators (GraphPad QuickCalcs), or use R and Rcmdr.
In R, simply type at the prompt
dbinom(2,10,0.031)
[1] 0.03361446
Try in R Commander.
Rcmdr → Distributions → Discrete distributions → Binomial distribution → Binomial probabilities …

Figure 3. Rcmdr menu to get binomial probability.
Note I used p = 0.033 the rate for entire USA. Here’s the output
> .Table <- data.frame(Pr=dbinom(0:10, size=10, prob=0.033))
> rownames(.Table) <- 0:10
> .Table
Pr
0  7.149320e-01
1  2.439789e-01
2  3.746728e-02 ← Answer, 0.0375 or 3.75%
3  3.409639e-03
4  2.036263e-04
5  8.338782e-06
6  2.371422e-07
7  4.624430e-09
8  5.918028e-11
9  4.487991e-13
10 1.531579e-15
And here is the output for our example from Hawaiʻi (p = 0.031).
> .Table <- data.frame(Pr=dbinom(0:10, size=10, prob=0.031))
> rownames(.Table) <- 0:10
> .Table
Pr
0  7.298570e-01
1  2.334940e-01
2  3.361446e-02 ← Answer, 0.0336 or 3.36%
3  2.867694e-03
4  1.605494e-04
5  6.163507e-06
6  1.643178e-07
7  3.003893e-09
8  3.603741e-11
9  2.561999e-13
10 8.196283e-16
We use the binomial distribution as the foundation for the binomial test, ie, the test of an observed proportion against an expected population level proportion in a Bernoulli trial.
Hypergeometric distribution
The binomial distribution is used for cases of sampling with replacement from a population. When sampling without replacement is done, the hypergeometric distribution is used. It is the number of successes, k, in a sequence of n independent trials drawn from a fixed population.
Note 2: A fixed population in epidemiology refers to a group of individuals, defined by set of characteristics. Examples include individuals selected because they all share a common life event, eg, giving birth. The population is “fixed” because, once an individual is included in the population, they remain a member of the population even if their characteristics change during the duration of the study. The opposite of a fixed population is an dynamic or open population. Definitions from Chapter 2 in Aschengrau and Seage (2003).
This sampling scheme means that each draw is no longer independent — with each draw you decrease the remaining number of observations and thus change the proportion.
The P-value from the hypergeometric distribution is often used to study if genes from a list of Gene Ontology (eg, biological process functional terms like “cell cycle,” or “apoptosis”) are enriched in the sets of genes with expression differences across the treatment groups (cf, discussion in Cao and Zhang 2014). The R package gprofiler2, which links to a Cloud service at g:Profiler, the can be used to do gene enrichment analyses with stunning visualizations (eg, Manhattan plot) suitable for publication.
The mathematical function of the hypergeometric is written as

where N is the population size, K is the number of successes in that population, and n and k are defined as above. Lets look apply this to the twinning problem.
In 2009, 2200 women gave birth in Hawaiʻi County, Hawaiʻi. Out of 10 births, what is the probability of 2 twin births in Hawaiʻi?
Assuming “risk” of twinning is the same rate as in rest of USA, then we have expected 72 successes in this population (0.033 * 2200).
Here’s the graph (Fig 4).
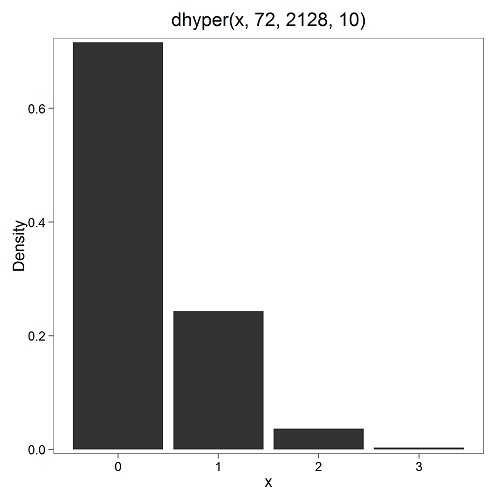
Figure 4. Plot of hypergeometric distribution twinning Hawaiʻi.
where the X axis values shows the number of events with successes (twin births). Taking the bin 2 (we wanted to know about probability of 2 out of ten), we can draw a line back to the Y-axis to get our probability — looks like about 5% roughly. Plot drawn with KMggplot2
To get the actual probability,
Rcmdr → Distributions → Discrete distributions → Hypergeometric distribution → Hypergeometric probabilities …
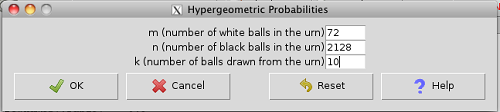
Figure 5. Rcmdr menu to get hypergeometric probability.
where m is the number of successes, n is the number of “failures,” and k is the number of trials.
> .Table
Pr
0 0.716453457
1 0.243438645
2 0.036688041 ← Answer, 0.0367 or 3.67%
3 0.003228871
The reference to white and black balls and urns is a device described by Bernoulli himself and has been used by others ever since to discuss probability problems (called the urn problem) and so I apply it here to be consistent. The urn contains a number of white (x) and a number of black (y) balls mixed together. One ball is drawn randomly from the urn — what color is it? The ball is then is either returned into the urn (replacement) or it is left out (without replacement) as in the hypergeometric problem, and the selection process is repeated.
Besides applications in gambling and balls-in-urns problems, this distribution is the basis for many tests of gene enrichment from microarray analyses. The hypergeometric forms the basis of the Fisher Exact test (see Chapter 9.5).
Discrete uniform distribution
For discrete cases of “1,” “2,” “3,” “4,” “5,” or “6,” on the single toss of fair dice, we can talk about the discrete uniform distribution because all possible outcomes are equally likely. If you are branded as a “card-counter” in Las Vegas, all you’ve done is reached an understanding of the uniform distribution of card suits!
One biological example would be the fate of a random primary oocyte in the human (mammal) female — three out of four will become polar bodies, eventually reabsorbed, whereas one in four will develop into a secondary oocyte (egg); the uniform distribution has to do with the counts of the products — each of the four primary oocytes has the same (apparently) chance (25%) of becoming the egg (Edwards and Beard 1997).
Analyses in biological research often use a uniform distribution as a baseline or null model (Gotelli and Ulrich 2011). For DNA sequencing, the uniform distribution provides a baseline for assessing coverage bias, eg, GC bias (Ross et al 2013). The uniform distribution underlies the Jukes–Cantor evolutionary model. The Jukes–Cantor model assumes equal substitution rates among all four nucleotides (A, T, C, G) and equal base frequencies (Felsenstein 2003).
The uniform distribution exists also for continuous data types, where every value within a specified interval has equal probability density. For example, DNA shearing — by endonucleases, proteases, or tansposases — during initial library prep for sequencing reactions, breakpoints may be modeled as uniformly distributed along fragment length. Non-uniform distributions reveal cleavage bias. Sequence-dependent cleavage bias is concluded when certain DNA fragments or sequences are generated or detected more (or less) frequently than would be expected by chance (Meyer and Liu 2014). This generates many false positives — that is, identifying a biological signal or molecule that isn’t actually there (Nix et a; 2008).
Poisson distribution
An extension from the binomial case is that, rather than following success or failure, you may have the following scenario. Consider a wind-dispersed seed released from a plant. If we markup the area around the plant in grids, we could then count the number of seeds within each grid. Most grids will have no seeds, some grids will have one seed, a few grids may have two seeds, etc. Multiple seeds in grids is a rare event. The graph might look like
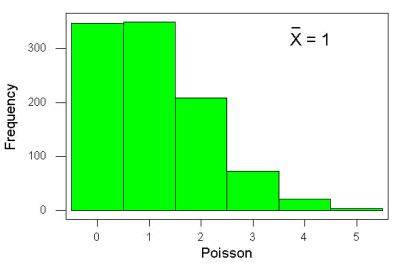
Figure 6. Example, poisson-like graph: the number of wind-dispersed seeds within each grid.
In molecular biology, use of Poisson distribution is common. In digital PCR for example, a DNA sample is diluted and divided into thousands of small reaction volumes or partitions. Thus, each partition contains either zero molecules, one molecule, or more than one molecule, where the loading of molecules into partitions is assumed to be independent, random, and rare per partition. In sequencing, Poisson models are used to describe random sampling of molecules and reads, especially when coverage is generated by non-deterministic processes like shotgun sequencing.
The Poisson has interesting properties, one being that the expected mean, λ, is equal to the variance. Lambda is, with respect to the Poisson distribution, the average number of times an event happens over a specific period or area.
An equation is

where μ is the mean (or could substitute with variance!), e is the natural logarithm, and X is number of successes you are interested in. For example, if μ = 1, what is the probability of observing a grid with five seeds? Simple enough to do this by hand, but let’s use Rcmdr instead. Here’s the graph (Fig 7) from Rcmdr (KMggplot2 plugin).
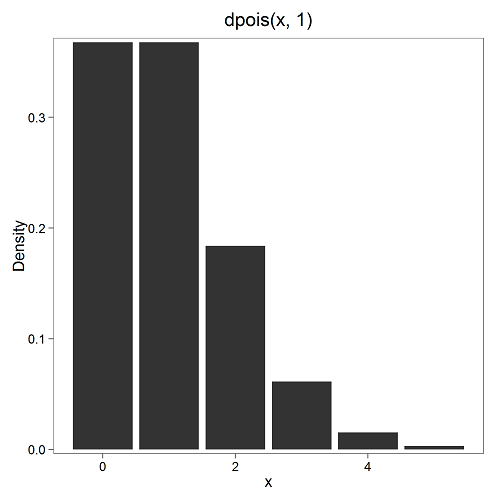
Figure 7. The probability of observing a grid with five seeds, poisson μ = 1 (ggplot2).
and for the actual probability we have from R
dpois(5, lambda = 1)
[1] 0.003065662
Rcmdr → Distributions → Discrete distributions → Poisson distribution → Poisson probabilities … (Fig 8)
The only thing to enter is the mean (some call μ lambda with symbol λ).
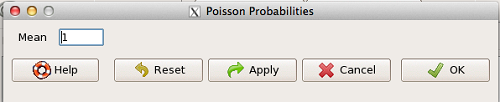
Figure 8. Rcmdr menu, poisson probability.
Here’s the output from R. For intervals 0, 1, 2, 3, …, 6 (Rcmdr just enters this range for you!
> .Table <- data.fram(Pr=dpois(0:6, lambda = 1))
> rownames(.Table) <- 0:6
> .Table
Pr
0 0.3678794412
1 0.3678794412
2 0.1839397206
3 0.0613132402
4 0.0153283100
5 0.0030656620 ← Answer, 0.0307 or 3.07%
6 0.0005109437
Next — Continuous distributions
And finally, for ratio (continuous) scale data, which can take on any value, we can express the chance that probability of a given point as a continuous function, with the normal distribution being one of the most important examples (there are others, like the F-distribution). Many statistical procedures assume that the data we use can be viewed as having come from a “normally distributed population.” See Chapter 6.6.
Questions
1.2. Quarterback sacks by game for the NFL team Seahawks, years 2011 through 2022 are summarized below (data extracted from https://www.pro-football-reference.com/ ).
| Sacks | How many games? |
| 0 | 25 |
| 1 | 46 |
| 2 | 49 |
| 3 | 39 |
| 4 | 25 |
| 5 | 14 |
| 6 | 8 |
| 7 | 2 |
| 8 | 1 |
| 9 | 0 |
a) Assuming a Poisson distribution, what are the mean (lambda) and variance?
b) The table covers a total of 112 games. How many sacks (events) were observed?
c) What is the probability of the Seahawks getting zero sacks in a game (in 2022, a season was 17 games; prior years a season was 16 games)?
Quiz Chapter 6.5
Discrete probability
Chapter 6 contents
- Introduction
- Some preliminaries
- Ratios and proportions
- Combinations and permutations
- Types of probability
- Discrete probability distributions
- Continuous distributions
- Normal distribution and the normal deviate
- Moments
- Chi-square distribution
- t distribution
- F distribution
- References and suggested readings