7.4 – Epidemiology: Relative risk and absolute risk, explained
Risk communication.
Epidemiology is the study of patterns of health and illness of populations. An important task in an epidemiology study is to identify risks associated with disease. Epidemiology is a crucial discipline used to inform about possible effective treatment approaches, health policy, and about the etiology of disease.
Please review terms presented in section 7.1 before proceeding. RR and AR are appropriate for cohort-control and cross-sectional studies (see 2.4 and 5.4) where base rates of exposure and unexposed or numbers of affected and non-affected individuals (prevalence) are available. Calculations of relative risk (RR) and relative risk reduction (RRR) are specific to the sampled groups under study whereas absolute risk (AR) and absolute risk reduction (ARR) pertain to the reference population. Relative risks are specific to the study, absolute risks are generalized to the population. Number needed to treat (NNT) is a way to communicate absolute risk reductions.
An example of ARR and RRR risk calculations using natural numbers.
Clinical trials are perhaps the essential research approach (Sibbald and Roland 1998; Sylvester et al 2017); they are often characterized with a binary outcome. Subjects either get better or they do not. There are many ways to represent risk of a particular outcome, but where possible, using natural numbers is generally preferred as a means of communication, particularly to the general public. Consider the following example (pp 34-35, Gigerenzer 2015): What is the benefit of taking a cholesterol-lowering drug, Pravastatin, on the risk of deaths by heart attacks and other causes of mortality? Press releases (eg, Maugh 1995), from the study stated the following:
“… the drug pravastatin reduced … deaths from all causes 22%”
A subsequent report (Skolbekken 1998) presented the following numbers (Table 1).
Table 1. Reduction in total mortality (5 year study) for people who took Pravastatin compared to those who took placebo.
| Deaths per 1000 people with high cholesterol (> 240 mg/dL) |
No deaths | Cumulative incidence |
||
| Treatment | Pravastatin
(n = 3302) |
a= 32 |
b= 3270 |
CIe |
| Placebo
(n = 3293) |
c= 41 |
d= 3252 |
CIu | |
where cumulative incidence refers to the number of new events or cases of disease divided by the total number of individuals in the population at risk.
Do the calculations of risk
The risk reduction (RR), or the number of people who die without treatment (placebo) minus those who die with treatment (Pravastatin), 
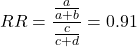
and the cumulative incidence in the exposed (treated) group, CIe, is  , and cumulative incidence in the unexposed (control) group, CIu, is
 . We can calculate another statistic called the risk ratio,
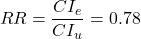
because the risk ratio is less than one, we interpret that statins reduce the risk of mortality from heart attack. In other words, statins lowered the risk by 0.78.
But is this risk reduction meaningful?
Now, consider the absolute risk reduction (ARR) is 
Relative risk reduction, or the absolute risk reduction divided by the proportion of patients who die without treatment, is 
Conclusion: high cholesterol may contribute to increased risk of mortality, but the rate is very low in the population as a whole (the ARR).
Another useful way to communicate benefit is to calculate the Number Needed to Treat (NNT), or the number of people who must receive the treatment to save (benefit) one person. The ideal NNT is a value of one (1), which would be interpreted as everyone improves who receives the treatment. By definition, NNT must be positive; however, a resulting negative NNT would suggest the treatment may cause harm, ie, number needed to harm (NNH).
For this example, the NNT is

therefore, to benefit one person, 111 need to be treated. The flip side of the implications of NNT, although one person may benefit by taking the treatment, 110 ( ) will take the treatment, but will NOT RECEIVE THE BENEFIT, but do potentially get any side effect of the treatment.
Confidence interval for NNT is derived from the Confidence interval for ARR.
For a sample of 100 people drawn at random from a population (which may number in the millions), then repeat the NNT calculation for a different sample of 100 people, do we expect the first and second NNT estimates to be exactly the same number? No, but we do expect them to be close and we can define what we mean by close as we expect each estimate to be within certain limits. While we expect the second calculation to be close to the first estimate, we would be surprised if it was exactly the same. And so, which is the correct estimate, the first or the second? They both are, in the sense that they both estimate the parameter NNT (a property of a population).
We use confidence interval to communicate where we believe the true estimate for NNT to be. Confidence Intervals (CI) allow us to assign a probability to how certain we are about the statistic and whether it is likely to be close to the true value (Altman 1998, Bender 2001). We will calculate the 95% CI for the ARR using the Wald method, then take the inverse of these estimates for our 95% CI. The Wald method assumes normality.
For CI of ARR, we need sample size for control and treatment groups; like all confidence intervals, we need to calculate the standard error of the statistic, in this, case, the standard error (SE) for ARR is approximately

where SE is the standard error for ARR. For our example, we have

The 95% CI for ARR is approximately 
For the Wald estimate, replace the 2 with  , which comes from the normal table for z at

(why the 2 in the equation? Because it is plus or minus so we divide the frequency 0.95 in half) and for our example, we have 
and the inverse for NNT CI is 
Our example exemplifies the limitation of the Wald approach (cf. Altman 1998): our confidence interval includes zero, and doesn’t even include our best estimate of NNT (111).
Note 1: By now I trust you can see differences for results by direct input of the numbers into R and what you get by the natural numbers approach. In part this is because we round in our natural number calculations — remember, while it makes more sense to communicate about whole numbers (people) and not fractions (fractions of people!), rounding through the calculations adds error to the final value. As long as you know the difference and the relevance between approximate and exact solutions, this shouldn’t cause concern.
Software: epiR.
R has many epidemiology packages, epiR and epitools are two. Most of the code presented stems from epiR.
We need to know about our study design in order to tell the functions which statistics are appropriate to estimate. For 2X2 tables, we will use epi.2by2() command, which allows four kinds of studies (Table 2).
Table 2. The method argument in epi.2by2 chooses how to analyze your data based on your study design.
| Method | Description | Notes |
|---|---|---|
| cohort.count | Use this when you follow a set number of people over time and count how many get sick. | This design directly calculates Relative Risk Reduction (RRR) and Absolute Risk Reduction (ARR) because you track baseline risk over time. |
| cohort.time | Use this when you follow people over time and track exactly how long each person was monitored before getting sick. | This calculates rate reductions instead of ARR or RRR because it deals with person-time data rather than raw counts. |
| case.control | Use this when you start with sick people and healthy people and look backwards at their past exposures. | You cannot calculate ARR or RRR here because you do not know the actual baseline risk of the population. |
| cross.sectional | Use this when you take a snapshot of a population at a single point in time to see who is currently exposed and sick. | This calculates prevalence reductions rather than true ARR or RRR because you are not tracking changes over time. |
For our statin example, the design was prospective cohort (ie, cohort.count in epiR package language), not case-control or cross-sectional (review in Chapter 5.4).
library(epiR)
Table1 <- matrix(c(32,3270,41,3252), 2, 2, byrow=TRUE, dimnames = list(c("Statin", "Placebo"), c("Died", "Lived")))
Table1
        Died Lived
Statin    32  3270
Placebo   41  3252
epi.2by2(Table1, method="cohort.count", outcome = "as.columns")
R output
           Outcome + Outcome - Total           Inc risk *
Exposed +         32      3270  3302 0.97  (0.66 to 1.37)
Exposed -         41      3252  3293 1.25  (0.89 to 1.69)
Total             73      6522  6595 1.11  (0.87 to 1.39)

Point estimates and 95% CIs:
-------------------------------------------------------------------
Inc risk ratio                          0.78 (0.49, 1.23)
Inc odds ratio                          0.78 (0.49, 1.24)
Attrib risk in the exposed *           -0.28 (-0.78, 0.23)
Attrib fraction in the exposed (%)    -28.48 (-103.47, 18.88)
Attrib risk in the population *        -0.14 (-0.59, 0.32)
Attrib fraction in the population (%) -12.48 (-37.60, 8.05)
-------------------------------------------------------------------
Uncorrected chi2 test that OR = 1: chi2(1) = 1.147 Pr>chi2 = 0.284
Fisher exact test that OR = 1: Pr>chi2 = 0.292
Wald confidence limits
CI: confidence interval
* Outcomes per 100 population units
The risk ratio we calculated by hand is shown in green in the R output, along with other useful statistics (see ?epi2x2 for help with these additional terms) not defined in our presentation.
We explain results of chi-square goodness of fit (Ch 9.1) and Fisher exact (Ch 9.5) tests in Chapter 9. Suffice to say here, we interpret the p-value (Pr) = 0.284 and 0.292 to indicate that there is no association between mortality from heart attacks with or without the statin (ie, the Odds Ratio, OR, not statistically different from one).
Wait! Where’s NNT and other results?
Use another command in epiR package, epi.tests(), to determine the specificity, sensitivity, and positive (or negative) predictive value.
epi.tests(Table1)
and R returns
          Outcome + Outcome - Total
Test +           32      3270  3302
Test -           41      3252  3293
Total            73      6522  6595

Point estimates and 95% CIs:
--------------------------------------------------------------
Apparent prevalence *                    0.50 (0.49, 0.51)
True prevalence *                        0.01 (0.01, 0.01)
Sensitivity *                            0.44 (0.32, 0.56)
Specificity *                            0.50 (0.49, 0.51)
Positive predictive value *              0.01 (0.01, 0.01)
Negative predictive value *              0.99 (0.98, 0.99)
Positive likelihood ratio                0.87 (0.67, 1.13)
Negative likelihood ratio                1.13 (0.92, 1.38)
False T+ proportion for true D- *        0.50 (0.49, 0.51)
False T- proportion for true D+ *        0.56 (0.44, 0.68)
False T+ proportion for T+ *             0.99 (0.99, 0.99)
False T- proportion for T- *             0.01 (0.01, 0.02)
Correctly classified proportion *        0.50 (0.49, 0.51)
--------------------------------------------------------------
* Exact CIs
Additional statistics are available by saving the output from epi2x2() or epitests() to an object, then using summary(). For example save output from epi.2by2(Table1, method="cohort.count", outcome = "as.columns") to object myEpi, then
summary(myEpi)
look for NNT in the R output
$massoc.detail$NNT.strata.wald
       est    lower    upper
1 -362.377 -128.038  436.481
Thus, the NNT was 362 (compared to 111 we got by hand) with 95% Confidence interval between -436 and +128 (make it positive because it is a treatment improvement).
Note 2: Strata (L. layers), refer to subgroups, for example, sex or age categories (see discussion in Ch05.4). Our examples here are not presented as subgroup analysis, but epiR reports by name strata.
epiR reports a lot of additional statistics in the output and for clarity, I have not defined each one, just the basic terms we need for BI311. As always, see help pages (eg, ?epi.2x2 or ?epitests)for more information about structure of an R command and the output.
We’re good, but we can work the output to make it more useful to us.
Improve output from epiR.
For starters, if we set interpret=TRUE instead of the default, interpret=FALSE, epiR will return a richer response.
fit <- epi.2by2(dat = as.table(Table1), method = "cohort.count", conf.level = 0.95, units = 100, interpret = TRUE, outcome = "as.columns")
fit
R output. In addition to the table of coefficients (above), interpret=TRUE provides more context, shown below
Measures of association strength:
The outcome incidence risk among the exposed was 0.78 (95% CI 0.49 to 1.23) times less than the outcome incidence risk among the unexposed.

The outcome incidence odds among the exposed was 0.78 (95% CI 0.49 to 1.24) times less than the outcome incidence odds among the unexposed.

Measures of effect in the exposed:
Exposure changed the outcome incidence risk in the exposed by -0.28 (95% CI -0.78 to 0.23) per 100 population units. -28.5% of outcomes in the exposed were attributable to exposure (95% CI -103.5% to 18.9%).

Number needed to treat for benefit (NNTB) and harm (NNTH):
The number needed to treat for one subject to be harmed (NNTH) is 362 (NNTH 128 to infinity to NNTB 436).

Measures of effect in the population:
Exposure changed the outcome incidence risk in the population by -0.14 (95% CI -0.59 to 0.32) per 100 population units. -12.5% of outcomes in the population were attributable to exposure (95% CI -37.6% to 8.1%).
That’s quite a bit. Another trick is to get at the table of results. We install a package called broom, which includes a number of ways to handle output from R functions, including those in the epiR package. Broom takes from the TidyVerse environment; tables are stored as tibbles.
Note 3: A tibble (package tibble) is a modified R data frame optimized for the tidyverse that enforces strict data handling and cleaner console printing. Unlike standard data frames, tibbles refuse to automatically simplify into vectors when sliced or guess column names using partial matching. Because of these intentional design choices, tibbles often don’t play well with R functions not written explicitly with the TidyVerse environment in mind.
To convert a data.frame to a tibble,
my_tibble <- as_tibble(my_dataframe)
To convert a tibble back to a standard data.frame
my_dataframe <- as.data.frame(my_tibble)
library(broom)

# Test statistics
tidy(fit, parameters = "stat")
R output
# A tibble: 3 × 4
term statistic df p.value
<chr> <dbl> <dbl> <dbl>
1 chi2.strata.uncor 1.15 1 0.284
2 chi2.strata.yates 0.909 1 0.340
3 chi2.strata.fisher NA NA 0.292
We can convert the tibbles into our familiar data.frame format, and then select only the statistics we want.
# Measures of association
fitD <- as.data.frame(tidy(fit, parameters = "moa")); fitD
R output, all 15 measures of association!
                  term     estimate     conf.low    conf.high
1       RR.strata.wald    0.7783605    0.4914679   1.23272564
2     RR.strata.taylor    0.7783605    0.4914679   1.23272564
3      RR.strata.score    0.8742994    0.6584540   1.10340173
4       OR.strata.wald    0.7761915    0.4876209   1.23553616
5     OR.strata.cfield    0.7761915           NA           NA
6      OR.strata.score    0.7761915    0.4894450   1.23093168
7        OR.strata.mle    0.7762234    0.4718655   1.26668220
8    ARisk.strata.wald   -0.2759557   -0.7810162   0.22910484
9   ARisk.strata.score   -0.2759557   -0.8000574   0.23482532
10     NNT.strata.wald -362.3770579 -128.0383246 436.48140194
11    NNT.strata.score -362.3770579 -124.9910314 425.84844829
12  AFRisk.strata.wald   -0.2847517   -1.0347210   0.18878949
13  PARisk.strata.wald   -0.1381661   -0.5933541   0.31702189
14  PARisk.strata.piri   -0.1381661   -0.3910629   0.11473067
15 PAFRisk.strata.wald   -0.1248227   -0.3760279   0.08052298
We can call out just the statistics we want from this table by calling to the specific elements in the data.frame (rows, columns).
fitD[c(1,4,7,9,12),]
R output
                 term   estimate   conf.low  conf.high
1      RR.strata.wald  0.7783605  0.4914679  1.2327256
4      OR.strata.wald  0.7761915  0.4876209  1.2355362
7       OR.strata.mle  0.7762234  0.4718655  1.2666822
9  ARisk.strata.score -0.2759557 -0.8000574  0.2348253
12 AFRisk.strata.wald -0.2847517 -1.0347210  0.1887895
Software: epitools.
Another useful R package for epidemiology is epitools, but it comes with it’s own idiosyncrasies. We have introduced the standard 2X2 format, with a, b, c, and d cells defined as in Table 1, above. However, epitools does it differently, and we need to update the matrix. By default, epitools has the unexposed group (control) in the first row and the non-outcome (no disease) is in the first column. To match our a,b,c, and d matrix, use the epitools command to change this arrangement with the rev() argument. Now, the analysis will use the contingency table on the right where the exposed group (treatment) is in the first row and the outcome (disease) is in the first column (h/t M. Bounthavong 2021). Once that’s accomplished, epitools returns what you would expect.
Calculate relative risk
risk1 <- 32 / (3270 + 32)
risk2 <- 41 / (3525 + 41)
risk1 - risk2
and R returns
-0.00180638
odds ratio
library(epitools)
oddsratio.wald(Table1, rev = c("both"))
and R returns
$data
              Outcome
Predictor Disease2 Disease1 Total
 Exposed2      517       36   553
 Exposed1      518       11   529
Total         1035       47  1082

$measure
           odds ratio with 95% C.I.
Predictor   estimate      lower      upper
 Exposed2  1.0000000        NA         NA
 Exposed1  0.3049657 0.1535563  0.6056675

$p.value
two-sided
Predictor  midp.exact  fisher.exact    chi.square
Exposed2           NA            NA            NA
Exposed1 0.0002954494  0.0003001641  0.0003517007
odds ratio highlighted in green.
Software: OpenEpi.
R is fully capable of delivering the calculations you need, but sometimes you just want a quick answer. Online, the OpenEpi tools at https://www.openepi.com/ can be used for homework problems. For example, working with count data in 2 X 2 format, select Counts > 2X2 table from the side menu to bring up the data form (Fig 1).
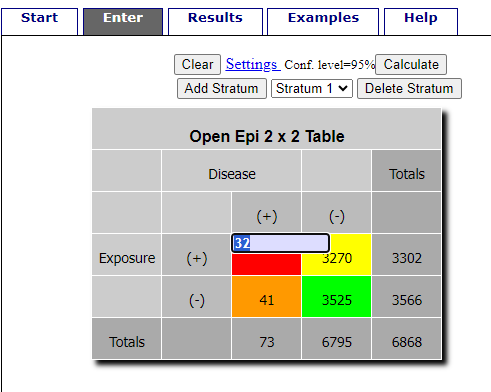
Figure 1. Data entry for 2X2 table at openepi.com.
Once the data are entered, click on the Calculate button to return a suite of results (Fig 2).
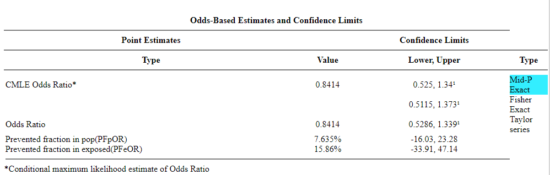
Figure 2. Results for 2X2 table at openepi.com.
Software: RcmdrPlugin.EBM
Note 4: Fall 2023 — I have not been able to run the EBM plugin successfully! The package is still active at CRAN, but looks like it hasn’t been updated since 2015. Simply returns an error message — — on data sets which have in the past performed perfectly. Thus, until further notice, do not use the EBM plugin. Instead, use commands in the epiR package.
This isn’t the place nor can I be the author to discuss what evidence based medicine (EBM) entails (cf. Masic et al. 2008), or what its shortcomings may be (Djulbegovic and Guyatt 2017). Rcmdr has a nice plugin, based on the epiR package, that will calculate ARR, RRR and NNT as well as other statistics. The plugin is called RcmdrPlugin.EBM
install.packages("RcmdrPlugin.EBM", dependencies=TRUE)
After acquiring the package, proceed to install the plug-in. Restart Rcmdr, then select Tools and Rcmdr Plugins (Fig 3).
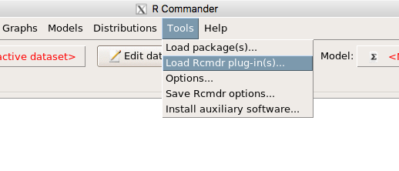
Figure 3. Rcmdr: Tools → Load Rcmdr plugins…
Find the EBM plug-in, then proceed to load the package (Fig 4).
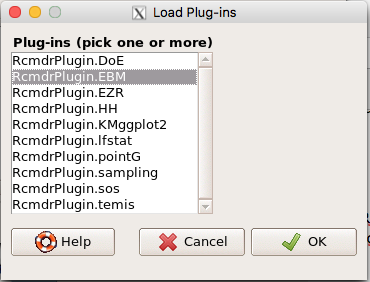
Figure 4. Rcmdr plug-ins available (after first download the files from an R mirror site).
Restart Rcmdr again and the menu “EBM” should be visible in the menu bar. We’re going to enter some data, so choose the Enter two-way table… option in the EBM plug-in (Fig 5)
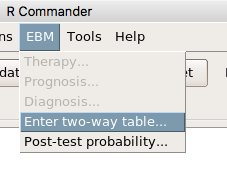
Figure 5. R Commander EBM plug-in, enter 2X2 table menus.
To review, we have the following problem, illustrated with natural numbers and probability tree (Fig 6).
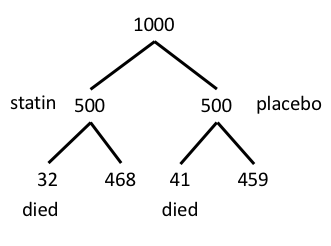
Figure 6. Illustration of probability tree for the statin problem.
Now, let’s enter the data into the EBM plugin. For the data above I entered the counts as
| Lived | Died | |
| Statin | 468 | 32 |
| Placebo | 459 | 41 |
and selected the “Therapy” medical indicator (Fig 7).
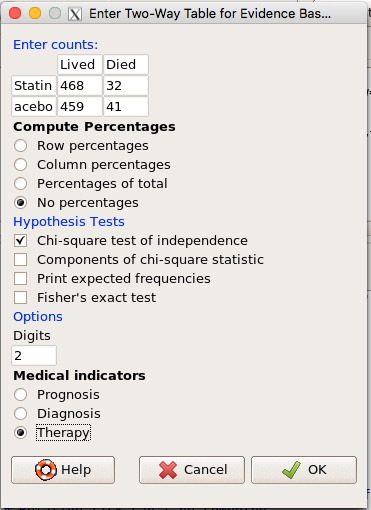
Figure 7. EBM plugin with two-way table completed for the statin problem.
The output from EBM plugin was as follows. I’ve added index numbers in brackets so that we can point to the output that is relevant for our worked example here.
(1) .Table <- matrix(c(468,32,459,41), 2, 2, byrow=TRUE, dimnames = list(c('Drug', 'Placebo'), c('Lived', 'Dead')))
(2) fncEBMCrossTab(.table=.Table, .x='', .y='', .ylab='', .xlab='', .percents='none', .chisq='1', .expected='0', .chisqComp='0', .fisher='0', .indicators='th', .decimals=2)
R output begins by repeating the commands used, here marked by lines (1) and (2). The statistics we want follow in the next several lines of output.
(3) Pearson's Chi-squared test data: .Table X-squared = 1.197, df = 1, p-value = 0.2739
(4) # Notations for calculations Event + Event -Treatment "a" "b" Control "c" "d"
(5)# Absolute risk reduction (ARR) = -1.8 (95% CI -5.02 - 1.42) %. Computed using formula: [c / (c + d)] - [a / (a + b)]
(6)# Relative risk = 1.02 (95% CI 0.98 - 1.06) %. Computed using formula: [c / (c + d)] / [a / (a + b)]
(7)# Odds ratio = 1.31 (95% CI 0.81 - 2.11). Computed using formula: (a / b) / (c / d)
(8) # Number needed to treat = -55.56 (95% CI 70.29 - Inf). Computed using formula: 1 / ARR
9)# Relative risk reduction = -1.96 (95% CI -5.57 - 1.53) %. Computed using formula: { [c / (c + d)] - [a / (a + b)] } / [c / (c + d)]
(10)# To find more about the results, and about how confidence intervals were computed, type ?epi.2by2 . The confidence limits for NNT were computed as 1/ARR confidence limits. The confidence limits for RRR were computed as 1 - RR confidence limits.
end R output
In summary, we found no difference between statin and placebo (P-value = 0.2739) and ARR of -1.8%
Questions.
Data from a case-control study on alcohol use and esophageal cancer (Tuyns et al (1977), example from Gerstman 2014). Cases were men diagnosed with esophageal cancer from a region in France. Controls were selected at random from electoral lists from the same geographical region.
| Esophageal cancer | |||
|
Alcohol grams/day |
Cases | Noncases |
Total |
| > 80 | 96 | 109 |
205 |
|
< 80 |
104 |
666 |
770 |
| Total | 200 | 775 | 975 |
- What was the null hypothesis? Be able to write the hypothesis in symbolic form and as a single sentence.
- What was the alternative hypothesis? Be able to write the hypothesis in symbolic form and as a single sentence.
- What was the observed frequency of subjects with esophageal cancer in this study? And the observed frequency of subjects without esophageal cancer?
- Estimate Relative Risk, Absolute Risk, NNT, and Odds ratio?
- Which is more appropriate, RR or OR? Justify your decision.
- The American College of Obstetricians and Gynecologists recommends that women with an average risk of breast cancer (BC) over 40 get an annual mammogram. Nationally, the sensitivity of mammography is about 68% and specificity of mammography is about 75%. Moreover, mammography involves exposure of women to radiation, which is known to cause mutations. Given that the prevalence of BC in women between 40 and 49 is about 0.1%, please evaluate the value of this recommendation by completing your analysis.
A) In this age group, how many women are expected to develop BC?
B) How many False negative would we expect?
C) How many positive mammograms are likely to be true positives? - “Less than 5% of women with screen-detectable cancers have their lives saved,” (quote from BMC Med Inform Decis Mak. 2009 Apr 2;9:18. doi: 10.1186/1472-6947-9-18): Using the information from question 5, What is the Number Needed to Treat for mammography screening?
Quiz Chapter 7.4
Epidemiology: Relative risk and absolute risk, explained
Chapter 7 contents
- Probability, Risk Analysis
- Epidemiology definitions
- Epidemiology basics
- Conditional Probability and Evidence Based Medicine
- Epidemiology: Relative risk and absolute risk, explained
- Odds ratio
- Confidence intervals
- References and suggested readings
7.3 – Conditional Probability and Evidence Based Medicine
- Conditional probability and risk communication
- Probability and independent events
- Example of multiple, independent events
- Probabilistic risk analysis
- Conditional probability of non-independent events
- Diagnosis from testing
- Standard million
- Per capita rate
- Practice and introduce PPV and test decision criteria
- Evidence Based Medicine
- Software
- Example
- Questions
- Quiz
- Chapter 7 contents
Conditional probability and risk communication.
Conditional probabilities can be used to accurately and effectively convey the risk of specific health outcomes to patients and the public. Tools introduced in this chapter help move from an initial assessment of disease risk to a revised probability after a test result is returned. Although there are other interpretations, here we frame EBM — evidence-based-medicine — as a form of Bayesian decision-making.
This sub-chapter covers a lot of ground. We begin by addressing how probability of multiple events are calculated assuming each event is independent. The assumption of independence is then relaxed, and how to determine probability of an event happening given another event has already occurred, conditional probability, is introduced. Use of conditional probability to interpret results of a clinical test are also introduced, along with the concept of EBM. We also introduce Bayes’ rule and Bayesian probability.
Probability and independent events.
Probability distributions are mathematical descriptions of the probabilities of how often different possible outcomes occur. We also introduced basic concepts related to working with the probabilities involving more than one event.
For review, for independent events, you multiply the individual chance that each event occurs to get the overall probability.
Example of multiple, independent events.
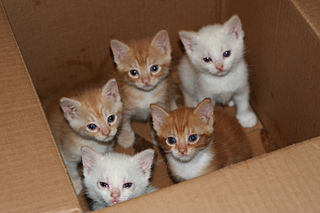
Figure 1. Now that’s a box full of kittens. Creative Commons License, source: https://www.flickr.com/photos/83014408@N00/160490011.
What is the chance of five kittens in a litter of five to be of the same sex? In feral cat colonies, siblings in a litter share the same mother, but not necessarily the same father, superfecundation. Singleton births are independent events, thus the probability of the first kitten is female is 50%; the second kitten is female, also 50%; and so on. We can multiply the independent probabilities (hence, the multiplicative rule), to get our answer:
kittens <- c(0.5, 0.5, 0.5, 0.5, 0.5)
prod(kittens)
[1] 0.03125
Probabilistic risk analysis.
Risk analysis is the use of information to identify hazards and to estimate the risk. A more serious example. Consider the 1986 Space Shuttle Challenger Disaster (Hastings 2003). Among the crew killed was Ellison Onizuka, the first Asian American to fly in space (Fig 2, first on left back row). Onizuka was born and raised on Hawai`i and graduated from Konawaena High School in 1964.

Figure 2. STS-51-L crew: (front row) Michael J. Smith, Dick Scobee, Ronald McNair; (back row) Ellison Onizuka, Christa McAuliffe, Gregory Jarvis, Judith Resnik. Image by NASA – NASA Human Space Flight Gallery, Public Domain.
The shuttle was destroyed just 73 seconds after lift off (Fig 3).

Figure 3. Space Shuttle Challenger launches from launchpad 39B Kennedy Space Center, FL, at the start of STS-51-L. Hundreds of shorebirds in flight. Image by NASA – NASA Human Space Flight Gallery, Public Domain.
This next section relies on material and analysis presented in the Rogers Commission Report June 1986. NASA had estimated that the probability of one engine failure would be 1 in 100 or 0.01; two engine failures would mean the shuttle would be lost. Thus, the probability of two rockets failing at the same time was calculated as 0.01 X 0.01, which is 0.0001 or 0.01%.
NASA had planned to fly the fleet of shuttles 100 times per year, which would translate to a shuttle failure once in 100 years. The Challenger launch on January 28, 1986, represented only the 25th flight of the shuttle fleet.
One difference on launch day was that the air temperature at Cape Canaveral was quite low for that time of year, as low as 22 °F overnight.
Attention was pointed at the large O-rings in the boosters (engines). In all, there were six of these O-rings. Testing suggested that, at the colder air temperatures, the chance that one of the rings would fail was 0.023. Thus, the chance of success was only 0.977. Assuming independence, what is the chance that the shuttle would experience O-ring failure?
shuttle <- c(0.977, 0.977, 0.977, 0.977, 0.977, 0.977)
#probability of success then was
prod(shuttle)
[1] 0.869

#and therefore probability of failure was
1 - prod(shuttle)
[1] 0.1303042
Conditional probability of non-independent events.
But in many other cases, independence of events cannot be assumed. The probability of an event given that another event has occurred is referred to as conditional probability. Conditional probability is used extensively to convey risk. We’ve touched on some of these examples already:
- the risk of subsequent coronary events given high cholesterol;
- the risk of lung cancer given a person smokes tobacco;
- the risk of mortality from breast cancer given that regular mammography screening was conducted.
There are many, many examples in medicine, insurance, you name it. It is even an important concept that judges and lawyers need to be able to handle (eg, discussion in Berry 2008).
A trigger warning: what follows is emotional, traumatic material, provided to emphasize the importance of these concepts, and the far-reaching implications understanding conditional probability can have for us.
A now famous example of conditional probability in the legal arena came from arguments over the chance that a husband or partner who beats his wife will subsequently murder her — this was an argument raised by the prosecution during pre-trial in the 1995 O.J. Simpson trial (The People of the State of California v. Orenthal James Simpson), and successfully argued by O.J. Simpson’s attorneys… judge ruled in favor of the defense and evidence of O.J. Simpson’s prior abuse were not included in trial. Gigerenzer (2002, following discussions by others, eg, Good 1995) and others (eg, Skorupski and Wainer 2015), have called this the Defendent’s Fallacy, the reverse of the Prosecutor’s Fallacy, where the more typical scenario is that the prosecution provides a list of probabilities about characteristics of the defendant, leaving the jury to conclude that no one else could have possibly fit the description ( and 1987).
In the O.J. Simpson case, the argument went something like this. From the CDC we find that the chance of an average woman being murdered by a stranger or an unrelated party was about 1 in 20,000. CDC statistics indicate 1.3 million women are abused each year by their partner or former partner; each year about 1000 women are murdered. One thousand divided by 1.3 million is a small number, so even when there is abuse the argument goes, 99% of the time there is not murder. The Simpson judge ruled in favor of the defense and much of the evidence of prior abuse was excluded.
Something is missing from the defense’s argument. Nicole Brown Simpson did not belong to a population of battered women — she belonged to the population of murdered women. When we ask, if a woman is murdered, what is the chance that she knew her murderer, we find that more than 55% knew their murderer — and of that 55%, 93% were killed by a partner who had a history of prior abuse against the victim.
Instead of looking at all 1.3 million abused women, we isolate a representative cohort of 100,000 abused women to see what mathematically happens to them in a given year:
Group 1: Murdered by their abuser. According to the defense’s rate of 1 in 2,500:
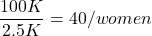
Group 2: Murdered by someone else:
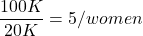
Given that an abused woman was murdered, what is the probability it was done by her abuser?

or 89%.
This is a huge difference from how the Defense portrayed the chance, where they wanted the judge to assume every single one of those 2500 abusers is equally likely to have committed the crime. In reality, we must condition the match on all other available evidence.
The key — Nicole Simpson (and Ron Goldman) were murdered; O.J. Simpson was an ex-partner who had been guilty of assault against Nicole Simpson. Now, it goes from an impossibly small chance, to a much greater chance. Conditional probability, and specifically Bayes’ rule, is used for these kinds of problems. The defense successfully masked a probability that was heavily stacked against their client.
Bayes’ rule provides guidance for how to update the probability of an event based on new evidence. Named after Thomas Bayes (1701- 1761), more generally, Bayes’ rule, described below, is used to quantify conditional probability. Bayesian probability, where probability is interpreted as reasonably expectation instead of frequency of some event. We discuss Bayesian and Frequentist approaches to hypothesis testing in Chapter 8.2.
Note 1: Following our epidemilogy definitions, women murdered by their abuser (Group 2), epidemiology terms, that would be  , the exposure rate in controls, whereas abused woman murdered by her abuser (Group 1), that would be
 , the exposure rate in cases.
Diagnosis from testing.
Let’s turn our attention to medicine. A growing practice in medicine is to claim that decision making in medicine should be based on approaches that give us the best decisions. A search of PubMed texts for “evidence based medicine” found more than 91,944 (13 October 2021, and increase of thirteen thousand since last I looked (10 October, 2019). Evidence based medicine (EBM) is the “conscientious, explicit, judicious and reasonable use of modern, best evidence in making decisions about the care of individual patients” (Masic et al 2008). By evidence, we may mean results from quantitative, systematic reviews, meta-analysis, of research on a topic of medical interest, eg, Cochrane Reviews.
Note 2: Primary research refers to generating or collecting original data in pursuit of tests of hypotheses. Both systematic reviews and meta-analysis are secondary research or “research on research.” As opposed to a literature review, systematic review make explicit how studies were searched for and included; if enough reasonably similar quantitative data are obtained through this process, the reviewer can combine the data and conduct an analysis to assess whether a treatment is effective (De Vries 2018).
As you know, no diagnostic test is 100% fool-proof. For many reasons, test results come back positive when the person truly does not have the condition — this is a false positive result. Correctly identifying individuals who do not have the condition, 100% – false positive rate, is called the specificity of a test.
Think of specificity in this way — provide the test 100 true negative samples (eg, 100 samples from people who do not have cancer) — how many times out of 100 does the test correctly return a “negative”? If 99 times out of 100, then the specificity rate for this test is 99%. Which is pretty good. But the test results mean more if the condition/disease is common; for rare conditions, even 99% is not good enough. Incorrect assignments are rare, we believe, in part because the tests are generally quite accurate. However, what we don’t consider is that detection and diagnosis from tests also depend on the base rate — how frequent the incidence of the condition is in the population. Paradoxically, the lower the base rate, the poorer diagnostic value even a sensitive test may have.
Note 3: This concept, that the base rate effects clinical relevance of interpreting testing — has really important, real-world consequences. It directly bears on clinical testing of cancer and other relatively rare diseases; it also dramatically influences applicability of highly sensitive tests for drug use in clinical samples.
To summarize our jargon for interpreting a test or assay, so far we have
- True positive (a), the person has a disease and the test correctly identifies the person as having the disease.
- False positive (b), test result incorrectly identifies disease; the person does not have the disease, but the test classifies the person as having the disease.
- False negative (c), test result incorrectly classifies person does not have disease, but the person actually has the disease.
- True negative (d), the person does not have the disease and the test correctly categorizes the person as not having the disease.
- Positive predictive value (PPV), the proportion of patients with a positive test result who actually have the disease,
 .
- Negative Predictive Value (NPV), the probability that a person who receives a negative test result really does not have the disease,
 .
- Negative Predictive Value (NPV), the probability that a person who receives a negative test result really does not have the disease,
- Sensitivity of test (Se), the proportion of persons who test positive and do have the disease (true positives):
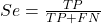
If a test has 75% sensitivity, then out of 100 individuals who do have the disease, then 75 will test positive (TP = true positive). - Specificity of a test (Sp), refers to the rate that a test correctly classifies a person that does not have the disease (TN = true negatives):
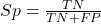
If a test has 90% specificity, then out of 100 individuals who truly do not have the disease, then 90 will test negative (= true negatives).
A worked example. A 50 year old male patient is in the doctor’s office. The doctor is reviewing results from a diagnostic test, eg, a FOBT — fecal occult blood test — a test used as a screening tool for colorectal cancer (CRC). The doctor knows that the test has a sensitivity of about 75% and specificity of about 90%. Prevalence of CRC in this age group is about 0.2% (cf NCI SEER). The prevalence is also the prior probability — the baseline rate of the condition in the population before a test is taken. Figure 4 shows our probability tree using our natural numbers approach (Fig 4).
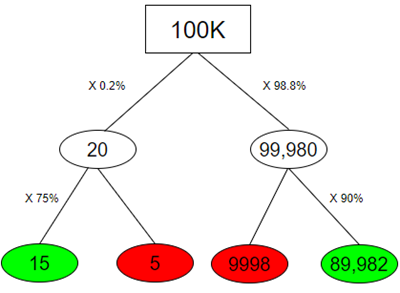
Figure 4. Probability tree for FOBT test; Good test outcomes shown in green: TP stands for true positive and TN stands for true negative. Poor outcomes of a test shown in red: FN stands for false negative and FP stands for false positive.
Note 4: Since U.S. Preventative Task Force (2021), FOBT has largely been replaced by Fecal Immunochemical Test (FIT): sensitivity 74%, specificity 95%, and Multitarget Stool DNA Test: sensitivity 76%, specificity 90%. Cologuard combines both: sensitivity 92%, specificity 97% (cf discussion in Imperiale et al 2014).
- The U.S. Supreme Court (Kennedy v. Braidwood Management, Inc) supported USPSTF’s authority to recommend preventive services covered by insurers (see 2025 article by R. Payerchin in Medical Economics).
The associated probabilities for the four possible outcomes of these kinds of tests (eg, what’s the probability of a person who has tested positive in screening tests actually has the disease?) are shown in Table 1.
Table 1. A 2 X 2 table of possible outcomes of a diagnostic test.
| Person really has the disease | ||
| Test Result | Yes | No |
| Positive | a TP |
b FP |
| Negative | c FN |
d TN |
We want the posterior probability — the chance that a positive test result is a true positive. Bayes’ rule is often given in probabilities,

Bayes’ rule, where truth is represented by either D (the person really does have the disease”) or ND (the person really does not have the disease”) and ⊕ is symbol for “exclusive or” and reads “not D” in this example.
An easier way to see this is to use frequencies and our table instead (Table 1, numbers in Figure 4).
Now, the formula is

Simplified Bayes’ rule, where a is the number of people who test positive and DO HAVE the disease and b is the number of people who test positive and DO NOT have the disease. Thus,  , the posterior probability was

or 0.15%. Because the condition is so rare (0.2% prior) and the test generates a very high number of False Positives (9,998), getting a positive result actually lowers oour confidence slightly from the base rate (from 0.2% down to 0.15%). This occurs because the test is highly unreliable in screening this specific population — it’s known as the base rate fallacy. Thus, the chance that a positive FOBT test for our 50 year old male patient is 99.85% likely wrong.
Standardized million.
Where did the 100,000 come from? We discussed this in chapter 2: it’s a simple trick to adjust rates to the same population size. We use this to work with natural numbers instead of percent or frequencies. You choose to correct to a standardized population based on the raw incidence rate. A rough rule of thumb:
Table 2. Relationship between standard population size and incidence rate.
| Raw IR rate about | IR | Standard population |
| 1/10 | 10% | 1000 |
| 1/100 | 1% | 10,000 |
| 1/1000 | 0.1% | 100,000 |
| 1/10,000 | 0.01% | 1,000,000 |
| 1/100,000 | 0.001% | 10,000,000 |
| 1/1,000,000 | 0.0001% | 100,000,000 |
The raw incident rate is simply the number of new cases divided by the total population.
Per capita rate.
Yet another standard manipulation is to consider the average incidence per person, or per capita rate. The Latin “per capita” translates to “by head” (Google translate), but in economics, epidemiology, and other fields it is used to reflect rates per person. Tuberculosis is a serious infectious disease of primarily the lungs. Incidence rates of tuberculosis in the United States have trended down since the mid 1900s: 52.6 per 100K in 1953 to 2.7 per 100K in 2019 (CDC). Corresponding per capita values are 5.26 x 10⁻⁴ and 2.7 x 10⁻⁵, respectively. Divide the rate by 100,000 to get per person rate.
Practice and introduce PPV and test decision criteria.
Let’s break these problems down, and in doing so, introduce some terminology common to the field of “risk analysis” as it pertains to evaluating assay and diagnotistc tests in biology and epidemiology. Our first example considers the fecal occult blood test, FOBT, test. Blood in the stool may (or may not) indicate polys or colon cancer (Park et al 2010).
A table like the one shown above (Table 1) will appear again and again throughout this and subsequent chapters, but in different forms. We start with Table 3.
Table 3. A 2 X 2 table of possible outcomes of FOBT test.
| Person really has the disease | |||
| Yes | No | ||
| Positive | 15 | 9998 | PPV = 15/(15+9998) = 0.15% |
| Negative | 5 | 89,982 | NPV = 89982/(89982+5) = 99.99% |
We want to know how good is the test, particularly if the goal is early detection? This is conveyed by the PPV, positive predictive value of the test. Unfortunately, the prevalence of a condition is also at play: the lower the prevalence, the lower the PPV must be, because most positive tests will be false when population prevalence is low.
Youden (1950) proposed a now widely adopted index that summarizes how effective a test is. Youden’s J is the sum of specificity and sensitivity minus one.

where Se stands for sensitivity of the test and Sp stands for sensitivity of the test.
Youden’s J takes on values between 0, for a terrible test, and 1, for a perfect test. For our FOBT example, Youden’s J was 0.65. This statistic looks like it’s independent of prevalence, but it’s use as a decision criterion (eg, a cutoff value, above which test is positive, below test is considered negative), assumes that the cost of misclassification (false positives, false negatives) are equal. Prevalence affects number of false positives and false negatives for a given diagnostic test, so any decision criterion based on Youden’s J will also be influenced by prevalence (Smits 2010).
Youden’s J is insensitive to base rates and therefore may be of little practical use in the field. Unsurprisingly, other tools are available, including Matthew’s Correlation Coefficient (MCC),

and the positive and negtive Clinical Utility Index (CUI+, CUI-),

or the F1-score,

epiR will calculate Youden’s J, but the others are either calculated by hand or by way of additional packages. So, we’ll provide a function.
R code to calculate testing decision criteria — code genereated with Gemini AI assistance.
run_screening_wizard <- function() {
# 1. Sequential user prompts starting with cell a
cat("--- 2x2 Matrix Entry Wizard ---\n")
a <- as.numeric(readline(prompt = "Enter cell a (True Positives, TP): "))
b <- as.numeric(readline(prompt = "Enter cell b (False Positives, FP): "))
c <- as.numeric(readline(prompt = "Enter cell c (False Negatives, FN): "))
d <- as.numeric(readline(prompt = "Enter cell d (True Negatives, TN): "))

# 2. Map cells to short variables for calculation
tp <- a
fp <- b
fn <- c
tn <- d

# 3. Construct and print the visual 2x2 matrix
user_matrix <- matrix(
c(tp, fp, fn, tn),
nrow = 2,
byrow = TRUE,
dimnames = list(Test = c("+", "-"), Disease = c("+", "-"))
)
cat("\n[+] Captured Matrix:\n")
print(user_matrix)

# 4. Run background metrics math
sensitivity <- tp / (tp + fn)
specificity <- tn / (tn + fp)
ppv <- tp / (tp + fp)
if (is.nan(ppv)) ppv <- 0

youden_j <- sensitivity + specificity - 1
cui_pos <- sensitivity * ppv

f1_score <- 2 * ((ppv * sensitivity) / (ppv + sensitivity))
if (is.nan(f1_score)) f1_score <- 0

mcc_num <- (tp * tn) - (fp * fn)
mcc_den <- sqrt(as.numeric(tp + fp) * as.numeric(tp + fn) *
as.numeric(tn + fp) * as.numeric(tn + fn))
mcc <- if (mcc_den == 0) 0 else mcc_num / mcc_den

# 5. Compile into the copy/paste ready console matrix
output_matrix <- matrix(
c(round(youden_j, 4), "No", "Good (Overly optimistic baseline)",
round(mcc, 4), "Yes", "Poor (Correctly captures imbalance)",
round(cui_pos, 4), "Yes", "Unacceptable clinical utility",
round(f1_score, 4), "Yes", "Near-total prediction failure"),
nrow = 4, byrow = TRUE
)

dimnames(output_matrix) <- list(
c("Youden's J Index", "MCC", "CUI+", "F1-Score"),
c("Value", "Base_Rate_Dep", "Console_Interpretation")
)

final_df <- as.data.frame(output_matrix)

# 6. Print and invisibly return the dataframe
cat("\n[+] Resulting Metrics Table (Copy/Paste Ready):\n")
print(final_df)
return(invisible(final_df))
}

# Run the function at the R command prompt.
run_screening_wizard()
End R code.
Thus, using a metric sensitive to low base rate, our FOBT tests are (modified from R output)
Table 4. Decision criteria.
| Value | Base rate dependent? | Interpretation | |
 |
0.65 | No | Good |
 |
0.0306 | Yes | Poor |
 |
0.0011 | Yes | Unacceptable clinical utility |
 |
0.0030 | Yes | Near-total prediction failure |
Another worked example. A study on cholesterol-lowering drugs (statins) reported a relative risk reduction of death from cardiac event by 22%. This does not mean that for every 1000 people fitting the population studied, 220 people would be spared from having a heart attack. In the study, the death rate per 1000 people was 32 for the statin versus 41 for the placebo — recall that a placebo is a control treatment offered to overcome potential patient psychological bias (see Chapter 5.4). The absolute risk reduction due to statin is only 41 – 32 or 9 in 1000 or 0.9%. By contrast, relative risk reduction is calculated as the ratio of the absolute risk reduction (9) divided by the proportion of patients who died without treatment (41), which is 22% (LIPID Study Group 1998).
Note that risk reduction is often conveyed as a relative rather than as an absolute number. The distinction is important for understanding arguments based in conditional probability. Thus, the question we want to ask about a test is summarized by absolute risk reduction (ARR) and number needed to treat (NNT), and for problems that include control subjects, relative risk reduction (RRR). We expand on these topics in the next section, 7.4 – Epidemiology: Relative risk and absolute risk, explained.
Evidence Based Medicine.
One culture change in medicine is the explicit intent to make decisions based on evidence (Masic et al 2008). Of course, the joke then is, well, what were doctors doing before, diagnosing without evidence? The comic strip xkcd offers one possible answer (Fig 5).
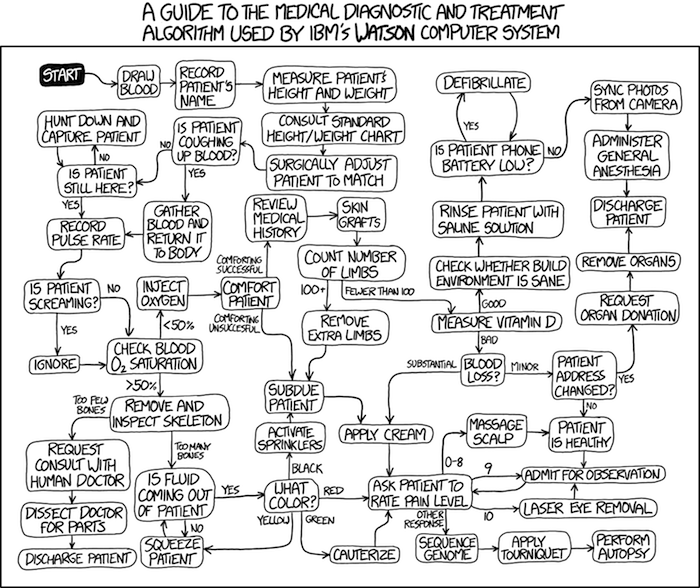
Figure 5. A summary of “evidence based medical” decisions, perhaps? “Watson Medical Algorithm,” https://xkcd.com/1619/.
As you can imagine, there’s considerable reflection about the EBM movement (see discussions in response to Accad and Francis 2018, eg, Goh 2018). More practically, our objective is for you to be able to work your way through word problems involving risk analysis. You can expect to be asked to calculate, or at least set up for calculation, any of the statistics listed above (eg, False negative, false positive, etc.). Practice problems are listed at the end of this section, and additional problems are provided to you (Homework 4). You’ll also want to check your work, and in any real analysis, you’d most likely want to use R.
Software.
R has several epidemiology packages, and with some effort, can save you time. Another option is to run your problems in OpenEpi, a browser-based set of tools. OpenEpi is discussed with examples in the next section, 7.4.
Here, we illustrate some capabilities of the epiR package, expanded more also in the next section, 7.4. We’ll use the example from Table 3.
R code
library(epiR)
Table3 <- matrix(c(15, 5, 9998, 89982), nrow = 2, ncol = 2)
epi.tests(Table3)
R output
         Outcome + Outcome -   Total
Test +          15      9998   10013
Test -           5     89982   89987
Total           20     99980  100000

Point estimates and 95% CIs:
--------------------------------------------------------------
Apparent prevalence *                      0.10 (0.10, 0.10)
True prevalence *                          0.00 (0.00, 0.00)
Sensitivity *                              0.75 (0.51, 0.91)
Specificity *                              0.90 (0.90, 0.90)
Positive predictive value *                0.00 (0.00, 0.00)
Negative predictive value *                1.00 (1.00, 1.00)
Positive likelihood ratio                  7.50 (5.82, 9.67)
Negative likelihood ratio                  0.28 (0.13, 0.59)
False T+ proportion for true D- *          0.10 (0.10, 0.10)
False T- proportion for true D+ *          0.25 (0.09, 0.49)
False T+ proportion for T+ *               1.00 (1.00, 1.00)
False T- proportion for T- *               0.00 (0.00, 0.00)
Correctly classified proportion *          0.90 (0.90, 0.90)
--------------------------------------------------------------
* Exact CIs
Oops! I wanted PPV, which by hand calculation was 0.15%, but R reported “0.00?” This is a significant figure reporting issue. The simplest solution is to submit options(digits=6) before the command, then save the output from epi.tests() to an object and use summary(). For example
options(digits=6)
myEpi <- epi.tests(Table3)
summary(myEpi)
And R returns
     statistic           est        lower        upper
1           ap  0.1001300000 0.0982761568  0.102007072
2           tp  0.0002000000 0.0001221693  0.000308867
3           se  0.7500000000 0.5089541283  0.913428531
4           sp  0.9000000000 0.8981238085  0.901852950
5      diag.ac  0.8999700000 0.8980937508  0.901823014
6      diag.or 27.0000000000 9.8110071871 74.304297826
7         nndx  1.5384615385 1.2265702376  2.456532054
8       youden  0.6500000000 0.4070779368  0.815281481
9       pv.pos  0.0014980525 0.0008386834  0.002469608
10      pv.neg  0.9999444364 0.9998703379  0.999981958
11      lr.pos  7.5000000000 5.8193604069  9.666010707
12      lr.neg  0.2777777778 0.1300251423  0.593427490
13      p.rout  0.8998700000 0.8979929278  0.901723843
14       p.rin  0.1001300000 0.0982761568  0.102007072
15      p.tpdn  0.1000000000 0.0981470498  0.101876192
16      p.tndp  0.2500000000 0.0865714691  0.491045872
17      p.dntp  0.9985019475 0.9975303919  0.999161317
18      p.dptn  0.0000555636 0.0000180416  0.000129662
There we go — pv.pos reported as 0.0014980525, which, after turning to a percent and rounding, we have 0.15%. Note also the additional statistics provided — a good rule of thumb — always try to save the output to an object, then view the object, eg, with summary(). Refer to help pages for additional details of the output (?epi.tests).
What about R Commander menus?
Note 3: Confirmed Fall 2026 — I have not been able to run the EBM plugin successfully! Simply returns an error message — — on data sets which have in the past performed perfectly. Thus, until further notice, do not use the EBM plugin. Instead, use commands in the epiR package. I’m leaving the text here on the chance the error with the plugin is fixed.
Rcmdr has a plugin that will calculate ARR, RRR and NNT. The plugin is called RcmdrPlugin.EBM (Leucuta et al 2014) and it would be downloaded as for any other package via R.
Download the package from your selected R mirror site, then start R Commander.
install.packages("RcmdrPlugin.EBM")
From within R Commander (Fig 6), select
Tools → Load Rcmdr plug-in(s)…
Figure 6. To install an Rcmdr plugin, first go to Rcmdr → Tools → Load Rcmdr plug-in(s)…
Next, select from the list the plug-in you want to load into memory, in this case, RcmdrPlugin.EBM (Fig 7).
Figure 7. Select the Rcmdr plugin, then click the “OK” button to proceed.
Restart Rcmdr again (Fig 8),
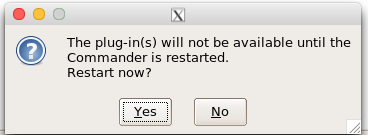
Figure 8. Select “Yes” to restart R Commander and finish installation of the plug-in.
and the menu “EBM” should be visible in the menu bar (Fig 9).
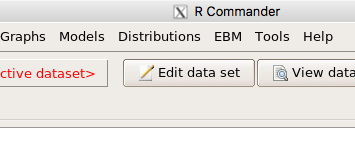
Figure 9. After restart of R Commander the EBM plug-in is now visible in the menu.
Note that you will need to repeat these steps each time you wish to work with a plug-in, unless you modify your .RProfile file. See
Rcmdr → Tools → Save Rcmdr options…
Clicking on the EBM menu item brings up the template for the Evidence Based Medicine module. We’ll mostly work with 2 X 2 tables (eg, see Table 1) , so select the “Enter two-way table…” option to proceed (Fig 10).
Figure 10. Select “Enter two-way table…”.
And finally, Figure 11 shows the two-way table entry cells along with options. We’ll try a problem by hand then use the EBM plugin to confirm and gain additional insight.
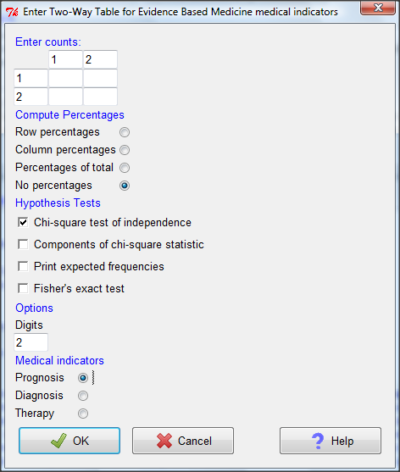
Figure 11. Two-way table Rcmdr EBM plug-in.
For assessing how good a test or assay is, use the Diagnosis option in the EBM plugin. For situations with treated and control groups, use Therapy option. For situations in which you are comparing exposure groups (eg, smokers vs non-smokers), use the Prognosis option.
Example.
Here’s a simple one (problem from Gigerenzer 2002).
About 0.01% of men in Germany with no known risk factors are currently infected with HIV. If a man from this population actually has the disease, there is a 99.9% chance the tests will be positive. If a man from this population is not infected, there is a 99.9% chance that the test will be negative. What is the chance that a man who tests positive actually has the disease?
Start with the reference, or base population (Figure 12). It’s easy to determine the rate of HIV infection in the population if you use numbers. For 10,000 men in this group, exactly one man is likely to have HIV (0.0001X10,000), whereas 9,999 would not be infected.
For the man who has the disease it’s virtually certain that his results will be positive for the virus (because the sensitivity rate = 99.9%). For the other 9,999 men, one will test positive (the false positive rate = 1 – specificity rate = 0.01%).
Thus, for this population of men, for every two who test positive, one has the disease and one does not, so the probability even given a positive test is only 100*1/2 = 50%. This would also be the test’s Positive Predictive Value.
Note that if the base rate changes, then the final answer changes! For example, if the base rate was 10%
It also helps to draw a tree to help you determine the numbers (Fig 12)
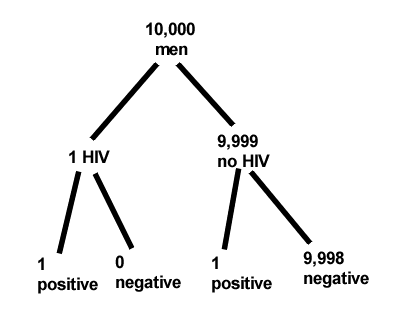
Figure 12. Draw a probability tree to help with the frequencies.
From our probability tree in Figure 12 it is straight-forward to collect the information we need.
- Given this population, how many are expected to have HIV? Two.
- Given the specificity and sensitivity of the assay for HIV, how many persons from this population will test positive? Two.
- For every positive test result, how many men from this population will actually have HIV? One.
Thus, given this population with the known risk associated, the probability that a man testing positive actually has HIV is 50% (=1/(1+1)).
Use the EBM plugin. Select two-way table, then enter the values as shown in Fig 13.
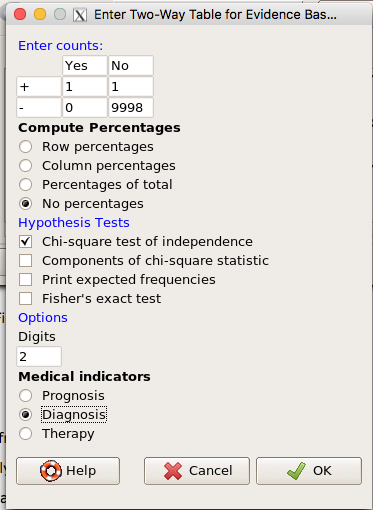
Figure 13. EBM plugin with data entry.
Select the “Diagnosis” option — we are answering the question: How probable is a positive result given information about sensitivity and specificity of a diagnosis test. The results from the EBM functions are given below
Rcmdr> .Table
      Yes No
   +  1    1
   -  0 9998
Rcmdr> fncEBMCrossTab(.table=.Table, .x='', .y='', .ylab='', .xlab='',
Rcmdr+ .percents='none', .chisq='1', .expected='0', .chisqComp='0', .fisher='0',
Rcmdr+ .indicators='dg', .decimals=2)
# Notations for calculations
        Disease + Disease -
Test +      "a"         "b"
Test -      "c"         "d"
# Sensitivity (Se) = 100 (95% CI 2.5 - 100) %. Computed using formula: a / (a + c)
# Specificity (Sp) = 99.99 (95% CI 99.94 - 100) %. Computed using formula: d / (b + d)
# Diagnostic accuracy (% of all correct results) = 99.99 (95% CI 99.94 - 100) %. Computed using formula: (a + d) / (a + b + c + d)
# Youden's index = 1 (95% CI 0.02 - 1). Computed using formula: Se + Sp - 1
# Likelihood ratio of a positive test = 9999 (95% CI 1408.63 - 70976.66). Computed using formula: Se / (Sp - 1)
# Likelihood ratio of a negative test = 0 (95% CI 0 - NaN). Computed using formula: (1 - Se) / Sp
# Positive predictive value = 50 (95% CI 1.26 - 98.74) %. Computed using formula: a / (a + b)
# Negative predictive value = 100 (95% CI 99.96 - 100) %. Computed using formula: d / (c + d)
# Number needed to diagnose = 1 (95% CI 1 - 40.91). Computed using formula: 1 / [Se - (1 - Sp)]
Note that the formulas used to calculate Sensitivity, Specificity, etc., follow our Table 1 (compare to “Notations for calculations”). The use of EBM provides calculations of our confidence intervals.
Questions.
- The sensitivity of the fecal occult blood test (FOBT) is reported to be 0.68. What is the False Negative Rate?
- The specificity of the fecal occult blood test (FOBT) is reported to be 0.98. What is the False Positive Rate?
- For men between 50 and 54 years of age, the rate of colon cancer is 61 per 100,000. If the false negative rate of the fecal occult blood test (FOBT) is 10%, how many persons who have colon cancer will test negative?
- For men between 50 and 54 years of age, the rate of colon cancer is 61 per 100,000. If the false positive rate of the fecal occult blood test (FOBT) is 10%, how many persons who do not have colon cancer will test positive?
- A study was conducted to see if mammograms reduced mortality
Mammogram Deaths/1000 women No 4 Yes 3 data from Table 5-1 p. 60 Gigerenzer (2002)
What is the RRR? - A study was conducted to see if mammograms reduced mortality
Mammogram Deaths/1000 women No 4 Yes 3 data from Table 5-1 p. 60 Gigerenzer (2002)
What is the NNT? - Does supplemental Vitamin C decrease risk of stroke in Type II diabetic women? A study conducted on 1923 women, a total of 57 women had a stroke, 14 in the normal Vitamin C level and 32 in the high Vitamin C level. What is the NNT between normal and high supplemental Vitamin C groups?
- Sensitivity of a test is defined as
A. False Positive Rate
B. True Positive Rate
C. False Negative Rate
D. True Negative Rate - Specificity of a test is defined as
A. False Positive Rate
B. True Positive Rate
C. False Negative Rate
D. True Negative Rate - In thinking about the results of a test of a null hypothesis, Type I error rate is equivalent to
A. False Positive Rate
B. True Positive Rate
C. False Negative Rate
D. True Negative Rate - During the Covid-19 pandemic, number of reported cases each day were published. For example, 155 cases were reported for 9 October 2020 by Department of Health. What is the raw incident rate?
Quiz Chapter 7.3
Conditional Probability and Evidence Based Medicine
Chapter 7 contents
- Introduction
- Epidemiology definitions
- Epidemiology basics
- Conditional Probability and Evidence Based Medicine
- Epidemiology: Relative risk and absolute risk, explained
- Odds ratio
- Confidence intervals
- References and suggested readings
7 – Probability, Risk Analysis
Introduction
The public health applications of epidemiology, the branch of medicine concerned with identifying patterns and potential causes of disease and health in populations, were every day in the news during the Covid-19 pandemic. From contact tracing to reproductive rate of the SARS-Cov-2 virus to numbers of hospital beds and nurses available in ICU units across the country, to the discussions and debates over how the virus is spread, no doubt you have learned much about the critical role epidemiology continues to play.
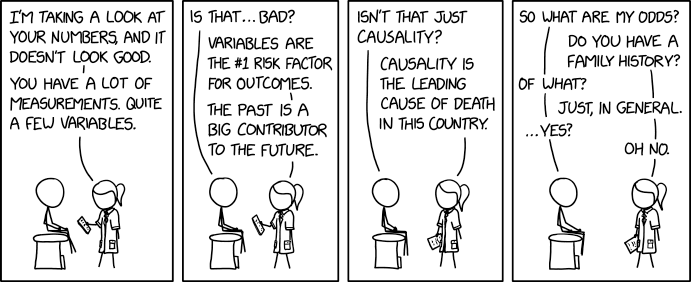
Figure 1. “Health data,” https://xkcd.com/2620/.
This chapter is about probability and introduced you to risk analysis (Fig 1), used to “… characterize the nature and magnitude of risks to human health for various populations…“, a foundational topic in biostatistics and epidemiology. The epiR package will be introduced and code examples provided for descriptive epidemiology and again for statistical inference (Chapter 9).
Homework to go with this topic
Homework 4: Risk in Mike’s Workbook for Biostatistics.
Quizzes in this chapter
A total of 51 questions among the several subchapters, a mix of true or false and multiple choice question format.
Chapter 7 contents
- Introduction
- Epidemiology definitions
- Epidemiology basics
- Conditional Probability and Evidence Based Medicine
- Epidemiology: Relative risk and absolute risk, explained
- Odds ratio
- Confidence intervals
- References and suggested readings
5.4 – Clinical trials
Introduction
Two areas of inquiry have contributed enormously to our understanding of experimental design: agriculture research (Verdooren 2020) and human subject clinical trials. This page outlines types of clinical trial designs and briefly introduces the subject of research ethics with human subject research (Huang and Hadian 2006). After completing this page, the reader will be able to identify key clinical trial types and recognize the fundamental ethical principles governing human subject research.
Although this page does not address the many concerns for ethical research in ecology and environmental studies, many parallels can be drawn (Crozier and Schulte-Hostedde 2014, Samuel and Richie 2022). To name just one example, both disciplines mandate a “do no harm,” principle. In clinical research this amounts to minimizing risks to human subjects; in environmental and ecology studies, acknowledging experimental studies through sampling or chemical releases can damage ecosystems (Resnik 2009).
An outline of clinical trials
Much has been written about biomedical research study design; a couple of accessible articles that can supplement the material presented here include Benson and Hart 2000, Concato et al 2000, Gabriella 2012. Even if you never work in clinical research, understanding how clinical trials are designed and under what circumstances limitations of particular designs arise is helpful to all of us who do experimental work. In Mike’s Workbook for Biostatistics we will present descriptions of research activities and step through situations where you will attempt to align the research by analogy to clinical trials. A second approach to learning about experimental design is to read about someone’s study, and reworking it in terms of a clinical trial design perspective. We will use a discussion of clinical trials, used in biomedical research to investigate effectiveness of treatments of disease, as our starting point for learning how statistics informs experimentation.
Types of clinical trials are distinguished by their design and include:
Case studies are a thorough analysis of an individual patient, or a few individuals (a group), focusing on symptoms, diagnostics, treatments and outcomes. Case studies can utilize quantitative or qualitative research methods. Case studies, of course, are not restricted to medical research. The main disadvantage of case studies is that by definition they are not generalizable to the population and, by their very nature, researcher subjectivity (choice of diagnostics, interpretations) and other kinds of bias may be challenging to control. A 2025 case study received considerable news coverage: a 60 year old man developed bromism — a toxic condition resulting from excessive exposure to bromides — consulting ChatGPT for health information (Eichenberger et al 2025).
Experimental studies are just that, research designs that apply techniques of experimental science — controls, randomization, attempts to account for sources of bias. They are intended to make direct comparisons among subjects assigned by the researcher to treatment groups. By definition experiments are longitudinal studies. Longitudinal studies are experimental or observational studies in which multiple observations are recorded for each individual and individuals are tracked over time. Many excellent resources about experimental design, beginning with R.A. Fisher’s 1935 book, The design of experiments, to Scheiner and Gurevitch (Editors) 2001, Design and Analysis of Ecological Experiments (2nd edition), to the many books on randomized control trials, eg, the 5th edition of Designing clinical research (2022), edited by Browner et al.
Observational (or epidemiological) studies — no direct intervention is administered and so observational studies tend to be retrospective; we identify individuals with and without the condition and attempt to identify associations between the condition and any number of potential causal factors.
Cross-sectional studies are examples of descriptive study designs. They take observations at one point in time on a variety of individuals. It can be used to associate factors with the condition in question, and can be used to estimate the prevalence of a condition in the population. Omair (2015) provides an accessible summary of case and cross-sectional study designs.
Cross-sectional studies are referred to as method = cross.sectional in the package epiR.
Cohort studies involve a group of subjects (eg, patients) who receive the same treatment at the same time. A cohort consists of subjects who are linked in some way. It could be a trivial link, like the cohorting done at university (all incoming Freshmen students who enroll for a class offered at 9:30AM), or it could be based on shared experience due to an exposure event (eg, all passengers on a jet traveling with an index case or “patient zero”).
- Prospective cohort studies enroll people as cohorts at the beginning of a study and follow them over time
- Retrospective cohort studies may utilize archived records.
Cohort and other variations of observational studies (eg, case control, test-negative design), can establish associations between risk factors and conditions or specific adverse events, but cannot by themselves establish cause and effect (Benson and Hartz 2000). A search of PUBMED for “cohort study” reports more than 3.2 million studies since 1914. A 2025 prospective cohort study with more than 1800 pregnant women found no change in risk of major birth defects after maternal mRNA COVID-19 vaccination in the first trimester of pregnancy (Kayser et al 2025).
Cohort studies are referred to as method = cohort.count in the package epiR.
Case control studies are similar to cohort studies, except they are retrospective. Case refers to subjects with one or more characteristics of interest. Used to infer the exposure risk factor by evaluating historical records. Omair (2016) provides an accessible summary of cohort and case control study designs. Designed to identify associations between exposure and particular outcomes, case control studies are retrospective and observational studies: Retrospective because the outcomes are already known, and observational because the event was caused by nature, not experiment. In principle, researchers identify a number of cases with a particular outcome (eg, lung cancer), then attempt to match cases to individuals who do not have the outcome (controls). Work is done to look back to see if the exposure (eg, smoking) is more frequent in the case group than the control group.
Case control studies have several advantageous compared to other approaches: rapid to conduct compared to longitudinal studies (the even has already happened), and efficient because small sample sizes may be enough to reach conclusions. Among their limitations, however, is the problem of how to match cases with controls. Obvious matching accomplished by grouping by age categories, body mass index, gender, socio-economic status, and so on. Three papers authored by Wacholder published in American Journal of Epidemiology 1992 describe in detail, from theory to practice, case control selection (Wacholder 1992abc). A search of PUBMED for “case control” reports more than 400 thousand studies since 1950. A 2025 case control study with more than one million records found no effect of aluminum adjuvant in childhood vaccines on chronic autoimmunity, atopy or allergy, and neurodevelopmental disorders (Andersson et al 2025).
Case control studies are referred to as method = case.control in the package epiR.
Test-negative designs are a kind of case control studies where the cases are those testing positive for the specific agent and controls are those who test negative for the agent, but importantly, both groups are individuals seeking care for symptoms characteristic of exposure to the agent (Kissling et al 2009, Fukushima and Hirota 2017). This design is intended to reduce the effects of health-care seeking behavior, therefore minimizing possible selection bias, and, therefore false associations between exposure and disease. Note however, that test-negative studies rely on test accuracy (discussed in Chapter 7.3 – Conditional Probability and Evidence Based Medicine); false negatives, where a person has the disease but test results return negative, incorrectly assigns the individual to the control group. This leads to underestimation of true effect of the intervention, eg, vaccination Fukushima and Hirota 2017).
Randomized Control (interventional or experimental) Trials (RCT): compares an experimental treatment group with a control) placebo group. The groups are assigned to groups randomly. Another variant of a RCT is a randomized clinical trial, with the only difference that the clinical trial compares different treatments and may not include a control group.
Double-blind: The “gold standard” RCT. Both the patient and those interacting with the patient do not know what treatment the patient has received.
Placebo: a treatment in name only. The placebo is a designed but medically ineffective agent given to a study subject. There is considerable debate about what a placebo should contain and as to the ethics and general merits of its use in clinical trials (Temple and Ellenberg 2000).
- active control or comparator studies are now common in place of placebo studies where treatment is clearly better than not giving the subject something of benefit (i.e., the placebo which is designed to not benefit the subject). Active control is not automatically a better choice than placebo control because they may be less effective in evaluating cause and effect (Temple and Ellenberg 2000).
The controlled clinical trial has a long history: Daniel’s vegetarian diet (Daniel’s training in Babylon, Book of Daniel, Old Testament, discussed in Bhatt 2010, h/t Treece 1990) — after ten days those on Daniel’s diet looked healthier than the others who ate the King’s prescribed meal of meat and wine; James Lind’s scurvy trials on board HMS Salisbury British ship in 1747 (references in Bhatt 2010). Randomized control trials (RCT) were introduced by Hill and others in 1946 study of streptomycin efficacy against tuberculosis. The effectiveness of RCT are now established and integral to regulation of drug development.
Use of clinical trials unfortunately has a longer history than recognition of human rights (Rice 2008). World War II Nazi medical research atrocities are well known (Berger 1990), so too the longitudinal study of Tuskegee syphilis study on African-Americans (Brandt 1978). But there are too many other examples: 1884 Hawaii, inoculation of Keanu by Dr. Arning with leprosy in exchange for commuting Keanu’s death sentence to life imprisonment (Keanu developed leprosy and died in 1890, Binford 1936); many studies of American Indians/Alaskan natives (Hodge 2012). Concerns about ethical treatment of participants in studies remains a challenge; see controversy over prospective randomized control trial (NCT00078182) of safety and efficacy of an HIV prophylactic tenofovir treatment in Cambodia (Singh and Mills 2005, Mills et al 2005).
Rules of conduct were established at Nuremberg, and subsequently extended and codified by Belmont Accords: core principles of respect for persons, beneficence, and justice. Ethical standards of who participates are institutionalized by IRB boards. True informed consent remains challenging (Rothwell et al 2021 and references therein).
Figure 1 shows how common in PUBMED randomized control trials and references to use of double blind design in research (Fig 1).
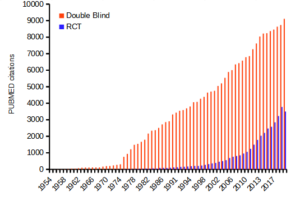
Figure 1. Search of PUBMED for “RCT” and “double blind” studies from 1950 to 2024.
Ethics of clinical and experimental research
Informed consent of subjects before proceeding in a clinical trial is a required, essential component of the design of a clinical trial. Guidelines for research conducted on human subjects originated from The Nuremberg Code (Shuster 1997). The Code was formulated 67 years ago, in August 1947, in Nuremberg, Germany, by American judges sitting in judgment of Nazi doctors accused of conducting torturous experiments on humans in the concentration camps (Shuster 1997). It served as a blueprint for today’s principles that ensure the rights of subjects in medical research. Achieving informed consent is not always straightforward (Nijhawan et al 2013), and we continue to see research that challenges ethical standards (eg, discussion in Suba 2014). Additionally, and perhaps less appreciated, the Nuremberg Code is justification for invasive animal research: animal research must precede human subject testing (Shuster 1997).
While informed consent is required, clearly, it is not enough. Emmanuel et al (2000) provide a framework for evaluating the ethics of a research program involving human subjects:
- Value
- Scientific validity
- Fair subject selection
- Favorable risk-benefit ratio
- Independent review
- Informed consent
- Respect for enrolled subjects
An additional concept, clinical equipoise (Freedman 1987) is relevant. Freedman noted that the researcher must have “genuine uncertainty” with respect to the merits of each treatment, or an “honest null hypothesis.” If a consensus exists that one treatment is better than another, including placebo, then there is no null hypothesis and the research would be invalid (Emmanuel et al 2000). Take, for example, the suggestion that clinicians should withhold angiotensin converting inhibitors (ACE2) from their hypertensive Covid-19 patients (Fang et al 2020; discussed in Tignaneli et al 2020). The hypothesis comes from the observation that SARS-COV2, like SARS-Cov, binds with ACE2 receptor in order to invade the cell. Blocking ACE2 inhibitors then would reduce activation of pulmonary renin angiotensin system and subsequent lung injury. Tignaneli et al (2020) called this a case of clinical equipoise — they argued no evidence supports “routine discontinuation” of ACE inhibitors.
Returning to the framework, Emmanuel et al left the equipoise consideration off their list for a number of reasons — for example, clinical equipoise can lead researchers to view pursuit of research has the same weight as therapy. Importantly, the proposed framework shifts the focus from the researcher views to a structured process of oversight that may minimize exploitation. It emphasizes factors like independent review and informed consent as more reliable ethical safeguards.
Moreover, the Nuremberg Code is foundational but not the current, nor the sole guidance for research conducted on human subjects; modern biomedical research is guided by more comprehensive documents like the Declaration of Helsinki and the Belmont Report, in addition to federal regulations and Institutional Review Boards or IRB.
Guidelines mandate detail about experimental design.
Professional journals expect authors to provide detailed descriptions of all methodology, including aspects of experimental design. Fundamental to the aim of science, to increase our knowledge An essential component of science To improve this kind of communication many journals and professional societies have promoted standards about what must be included in these descriptions. For example, efforts of the CONSORT, which stands for CONsolidated Standards Of Reporting Trials, at www.consort-statement.org, to improve the reporting of clinical trials by authors and provide guidelines for reviewers and editors is endorsed by more than 400 journals. The CONSORT checklist address
- Trial design
- Participants
- Interventions
- Outcomes
- Sample size
- Randomization
- Implementation
- Blinding
- Statistical methods
These nine elements were judged essential for authors to report how their study implemented or did not implement. The purpose of these items is to in order to improve reproducibility of published research. For animal research a similar list is available from ARRIVE (Kilkenny et al 2010). ARRIVE also addresses additional criteria and directs how these should be reported throughout the paper, not just in the methods section. Like CONSORT, hundred of journals have endorsed the ARRIVE 20-item checklist.
Clinical researchers must implement protocols to insure data management guidelines are followed. Clinical data management is a large topic in and of itself, so we won’t discuss this area further. However, good data management practice across disciplines share a number of features. For example, all data records should include metadata, where metadata refers to “information about data,” and would include enough information about the experiment, including
- dates and times of observations
- personnel
- facilities
- protocols used
- number of subjects
- list of variables with definitions
- full name of variable plus any acronym
- measurement units
- instrumentation
- notes about data quality
- conditions
and more (this is hardly an exhaustive list). Metadata therefore explains how data were obtained. Lists of variables are also called data dictionaries. If data are stored in spreadsheets, for example, then good practice includes including a worksheet with the metadata for the data set.
Note 1: We introduced metadata and data dictionaries with our discussion about data types in Chapter 3.1.
Questions
- Be able to define the following terms
- case control
- case study
- cohort study
- cross sectional study
- observational study
- experimental study
- single arm trial
- single blind vs double-blinding in research design
- Early in the Covid-19 pandemic, hydroxycholoquine was suggested for treating Covid-19 patients, and some called for prophylactic use of the malarial drug. Discuss the treatment hypothesis in the context of clinical equipoise.
- Distinguish between case control prospective and case control retrospective studies and the kinds of inferences that can be made.
Quiz Chapter 5.4
Clinical trials