9.6 – McNemar’s test
Introduction
There are a number of scenarios in which subjects are paired or matched as part of the experimental design in order to control for confounding variables — a matched pair case-control. Subjects may be matched by age, or other criteria, or the observations are repeat measures of the same subjects (eg, left hand vs. right hand). One member of each pair is then randomly assigned to a treatment, the remaining pair member then assigned to the other treatment group. This scenario should remind you of our standard contingency table problem, but instead of a random collection of subjects assigned to treatments, the data are paired nominal. Thus, paired means that experimental (sampling) units are not independent, which if ignored violates an assumption required to employ the  test. We use McNemar’s test instead.
The possible results of such a design include just two outcomes: the pairs have the same outcome (agree, concordant) or the pairs have different outcomes (disagree, discordant).
McNemar’s solution was to consider only the discordant pairs. Consider two kinds of tests or assays for a condition, and the doctor receives the results of both tests. Our familiar two-by-two table results, and in this scenario may be called a confusion table — after all, there is truth and agreement along the diagonal including cells a and d are agreement between the two methods, whereas the off diagonal cells c and b are “confusion,” the two methods disagree.
Table 1. The familiar 2X2 table, now used to display agreement between two different testing procedures.
| Test 2 | ||||
| Positive | Negative | Row total | ||
| Test 1 | Positive | a | b | a+b |
| Negative | c | d | c+d | |
| Column total | a+c | b+d | n | |
Null hypothesis is that marginal proportions are equal

then McNemar’s test is given by
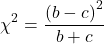
and the test has one degree of freedom.
If one of the cells is low, then a continuity correction would be applied (Edwards 1948, cited in Fagerland et al 2013). With this correction the equation becomes
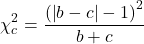
If either b or c is small, then the McNemar’s test statistic does not approximate a distribution very well, so there is a binomial version that you would use (Cochran’s Q test); used in cases where there are three or more matched sets and is common in meta-analysis (Kulinskaya and Dollinger 2015).
R code
Example data: Approval ratings for President Trump at two important markers during the Covid-19 pandemic: April 2020, deaths passed 10,000 persons in the US; in October 2020, it was reported that President Trump tested positive for SAR-COV2 and was admitted to Walter Reed National Military Medical Center (admitted 3 Oct, released 5 Oct). Surveys were conducted by YouGov (April, sponsored by The Economist; October, sponsored by Yahoo News; data extracted from How Americans View Biden’s Response To The Coronavirus Crisis)
Table 2. Approval ratings for President Trump at two important markers during the Covid-19 pandemic, data from YouGov survey.
| Approve | Disapprove | |
| April survey | 720 | 705 |
| October survey | 645 | 812 |
Enter the data as a matrix (note this would be a general approach for the contingency table problems, too, instead of entering via Rcmdr menu). The discordant pairs are b = 645 and c = 705
covid19 <- matrix(c(720, 645, 705, 812), nrow = 2, dimnames = list("April survey" = c("Approve", "Disapprove"), "October survey" = c("Approve", "Disapprove")))

 covid19
                      October survey
April survey       Approve   Disapprove
         Approve       720          705
      Disapprove       645          812
Uncorrected
mcnemar.test(covid19, correct=FALSE)

McNemar's Chi-squared test

data: covid19
McNemar's chi-squared = 2.6667, df = 1, p-value = 0.1025
Correction applied
mcnemar.test(covid19, correct=TRUE)

McNemar's Chi-squared test with continuity correction

data: covid19
McNemar's chi-squared = 2.5785, df = 1, p-value = 0.1083
Conclusions?
No change in approval ratings. The correction for small sample size had little effect on p-value, unsurprisingly, given that the surveys included 1500 (April) and 1504 (October) persons.
Unconditional paired tests
McNemar’s solution considers only the discordant pairs; it’s a conditional test. The downside of these tests is that the concordant pairs are not considered. Thus, by in effect tossing out some portion of the experimental results, it shouldn’t surprise you that the statistical power of the test is reduced (see Chapter 11). Thus, McNemar’s test may no longer be the best choice. Alternative unconditional tests have been proposed, and the mid-P alternative shows promise (Routledge 1994; Fagerland et al 2013). The mid-P value is calculated as the standard p-value for a test statistic minus one half the difference between the standard p-value and the next lowest possible p-value. McNemar’s mid-p test is available in package contingencytables. Try with example data set in Fagerland et al 2013 (Table 1).
#create a 2x2 matrix
bentur <- rbind(c(1, 1), c(7, 12))
First run McNemar’s test without correction for small sample size.
mcnemar.test(bentur, correct=FALSE)
R output follows
McNemar's Chi-squared test

data: bentur
McNemar's chi-squared = 4.5, df = 1, p-value = 0.03389
Next, run McNemar’s test with correction for small sample size.
mcnemar.test(bentur, correct=TRUE)
R output follows
McNemar's Chi-squared test with continuity correction

data: bentur
McNemar's chi-squared = 3.125, df = 1, p-value = 0.0771
Last, run min-p version of McNemar’s test.
McNemar_midP_test_paired_2x2(bentur)
R output
[1] The McNemar mid-P test: P = 0.039063
See also mcnemarExactDP function in exact2x2 package. Without explanation, here’s the R code and results
mcnemarExactDP(n = sum(bentur), m= bentur[1,2] + bentur[2,1], x = bentur[1,2])

      Exact McNemar Test (with central confidence intervals)

data: n=sum(bentur) m=bentur[1, 2] + bentur[2, 1] x=bentur[1, 2]
n = 21, m = 8, x = 1, p-value = 0.07031
alternative hypothesis: true difference in proportions is not equal to 0
95 percent confidence interval:
 -0.54549962 0.02044939
sample estimates:
       x/n    (m-x)/n  difference
0.04761905 0.33333333 -0.28571429
Alternatively, use wrapper function mnemar.exact().
mcnemar.exact(bentur)
R output
Exact McNemar test (with central confidence intervals)

data: bentur
b = 1, c = 7, p-value = 0.07031
alternative hypothesis: true odds ratio is not equal to 1
95 percent confidence interval:
 0.003169739 1.111975554
sample estimates:
odds ratio
 0.1428571
Note the alternative hypothesis: p-value is two-tailed.
Quiz Chapter 9.6
McNemar's test
Questions
1. Apply McNemar’s test and mid-P exact test to CDC example
| Controls | |||
| Cases | Exposed | Not exposed | |
| Exposed | 58 | 89 | |
| Not exposed | 32 | 95 | |
Chapter 9 contents
7 – Probability, Risk Analysis
Introduction
The public health applications of epidemiology, the branch of medicine concerned with identifying patterns and potential causes of disease and health in populations, were every day in the news during the Covid-19 pandemic. From contact tracing to reproductive rate of the SARS-Cov-2 virus to numbers of hospital beds and nurses available in ICU units across the country, to the discussions and debates over how the virus is spread, no doubt you have learned much about the critical role epidemiology continues to play.
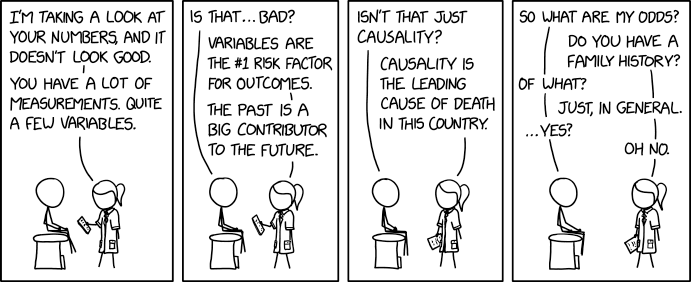
Figure 1. “Health data,” https://xkcd.com/2620/.
This chapter is about probability and introduced you to risk analysis (Fig 1), used to “… characterize the nature and magnitude of risks to human health for various populations…“, a foundational topic in biostatistics and epidemiology. The epiR package will be introduced and code examples provided for descriptive epidemiology and again for statistical inference (Chapter 9).
Homework to go with this topic
Homework 4: Risk in Mike’s Workbook for Biostatistics.
Quizzes in this chapter
A total of 51 questions among the several subchapters, a mix of true or false and multiple choice question format.
Chapter 7 contents
- Introduction
- Epidemiology definitions
- Epidemiology basics
- Conditional Probability and Evidence Based Medicine
- Epidemiology: Relative risk and absolute risk, explained
- Odds ratio
- Confidence intervals
- References and suggested readings
5.4 – Clinical trials
Introduction
Two areas of inquiry have contributed enormously to our understanding of experimental design: agriculture research (Verdooren 2020) and human subject clinical trials. This page outlines types of clinical trial designs and briefly introduces the subject of research ethics with human subject research (Huang and Hadian 2006). After completing this page, the reader will be able to identify key clinical trial types and recognize the fundamental ethical principles governing human subject research.
Although this page does not address the many concerns for ethical research in ecology and environmental studies, many parallels can be drawn (Crozier and Schulte-Hostedde 2014, Samuel and Richie 2022). To name just one example, both disciplines mandate a “do no harm,” principle. In clinical research this amounts to minimizing risks to human subjects; in environmental and ecology studies, acknowledging experimental studies through sampling or chemical releases can damage ecosystems (Resnik 2009).
An outline of clinical trials
Much has been written about biomedical research study design; a couple of accessible articles that can supplement the material presented here include Benson and Hart 2000, Concato et al 2000, Gabriella 2012. Even if you never work in clinical research, understanding how clinical trials are designed and under what circumstances limitations of particular designs arise is helpful to all of us who do experimental work. In Mike’s Workbook for Biostatistics we will present descriptions of research activities and step through situations where you will attempt to align the research by analogy to clinical trials. A second approach to learning about experimental design is to read about someone’s study, and reworking it in terms of a clinical trial design perspective. We will use a discussion of clinical trials, used in biomedical research to investigate effectiveness of treatments of disease, as our starting point for learning how statistics informs experimentation.
Types of clinical trials are distinguished by their design and include:
Case studies are a thorough analysis of an individual patient, or a few individuals (a group), focusing on symptoms, diagnostics, treatments and outcomes. Case studies can utilize quantitative or qualitative research methods. Case studies, of course, are not restricted to medical research. The main disadvantage of case studies is that by definition they are not generalizable to the population and, by their very nature, researcher subjectivity (choice of diagnostics, interpretations) and other kinds of bias may be challenging to control. A 2025 case study received considerable news coverage: a 60 year old man developed bromism — a toxic condition resulting from excessive exposure to bromides — consulting ChatGPT for health information (Eichenberger et al 2025).
Experimental studies are just that, research designs that apply techniques of experimental science — controls, randomization, attempts to account for sources of bias. They are intended to make direct comparisons among subjects assigned by the researcher to treatment groups. By definition experiments are longitudinal studies. Longitudinal studies are experimental or observational studies in which multiple observations are recorded for each individual and individuals are tracked over time. Many excellent resources about experimental design, beginning with R.A. Fisher’s 1935 book, The design of experiments, to Scheiner and Gurevitch (Editors) 2001, Design and Analysis of Ecological Experiments (2nd edition), to the many books on randomized control trials, eg, the 5th edition of Designing clinical research (2022), edited by Browner et al.
Observational (or epidemiological) studies — no direct intervention is administered and so observational studies tend to be retrospective; we identify individuals with and without the condition and attempt to identify associations between the condition and any number of potential causal factors.
Cross-sectional studies are examples of descriptive study designs. They take observations at one point in time on a variety of individuals. It can be used to associate factors with the condition in question, and can be used to estimate the prevalence of a condition in the population. Omair (2015) provides an accessible summary of case and cross-sectional study designs.
Cross-sectional studies are referred to as method = cross.sectional in the package epiR.
Cohort studies involve a group of subjects (eg, patients) who receive the same treatment at the same time. A cohort consists of subjects who are linked in some way. It could be a trivial link, like the cohorting done at university (all incoming Freshmen students who enroll for a class offered at 9:30AM), or it could be based on shared experience due to an exposure event (eg, all passengers on a jet traveling with an index case or “patient zero”).
- Prospective cohort studies enroll people as cohorts at the beginning of a study and follow them over time
- Retrospective cohort studies may utilize archived records.
Cohort and other variations of observational studies (eg, case control, test-negative design), can establish associations between risk factors and conditions or specific adverse events, but cannot by themselves establish cause and effect (Benson and Hartz 2000). A search of PUBMED for “cohort study” reports more than 3.2 million studies since 1914. A 2025 prospective cohort study with more than 1800 pregnant women found no change in risk of major birth defects after maternal mRNA COVID-19 vaccination in the first trimester of pregnancy (Kayser et al 2025).
Cohort studies are referred to as method = cohort.count in the package epiR.
Case control studies are similar to cohort studies, except they are retrospective. Case refers to subjects with one or more characteristics of interest. Used to infer the exposure risk factor by evaluating historical records. Omair (2016) provides an accessible summary of cohort and case control study designs. Designed to identify associations between exposure and particular outcomes, case control studies are retrospective and observational studies: Retrospective because the outcomes are already known, and observational because the event was caused by nature, not experiment. In principle, researchers identify a number of cases with a particular outcome (eg, lung cancer), then attempt to match cases to individuals who do not have the outcome (controls). Work is done to look back to see if the exposure (eg, smoking) is more frequent in the case group than the control group.
Case control studies have several advantageous compared to other approaches: rapid to conduct compared to longitudinal studies (the even has already happened), and efficient because small sample sizes may be enough to reach conclusions. Among their limitations, however, is the problem of how to match cases with controls. Obvious matching accomplished by grouping by age categories, body mass index, gender, socio-economic status, and so on. Three papers authored by Wacholder published in American Journal of Epidemiology 1992 describe in detail, from theory to practice, case control selection (Wacholder 1992abc). A search of PUBMED for “case control” reports more than 400 thousand studies since 1950. A 2025 case control study with more than one million records found no effect of aluminum adjuvant in childhood vaccines on chronic autoimmunity, atopy or allergy, and neurodevelopmental disorders (Andersson et al 2025).
Case control studies are referred to as method = case.control in the package epiR.
Test-negative designs are a kind of case control studies where the cases are those testing positive for the specific agent and controls are those who test negative for the agent, but importantly, both groups are individuals seeking care for symptoms characteristic of exposure to the agent (Kissling et al 2009, Fukushima and Hirota 2017). This design is intended to reduce the effects of health-care seeking behavior, therefore minimizing possible selection bias, and, therefore false associations between exposure and disease. Note however, that test-negative studies rely on test accuracy (discussed in Chapter 7.3 – Conditional Probability and Evidence Based Medicine); false negatives, where a person has the disease but test results return negative, incorrectly assigns the individual to the control group. This leads to underestimation of true effect of the intervention, eg, vaccination Fukushima and Hirota 2017).
Randomized Control (interventional or experimental) Trials (RCT): compares an experimental treatment group with a control) placebo group. The groups are assigned to groups randomly. Another variant of a RCT is a randomized clinical trial, with the only difference that the clinical trial compares different treatments and may not include a control group.
Double-blind: The “gold standard” RCT. Both the patient and those interacting with the patient do not know what treatment the patient has received.
Placebo: a treatment in name only. The placebo is a designed but medically ineffective agent given to a study subject. There is considerable debate about what a placebo should contain and as to the ethics and general merits of its use in clinical trials (Temple and Ellenberg 2000).
- active control or comparator studies are now common in place of placebo studies where treatment is clearly better than not giving the subject something of benefit (i.e., the placebo which is designed to not benefit the subject). Active control is not automatically a better choice than placebo control because they may be less effective in evaluating cause and effect (Temple and Ellenberg 2000).
The controlled clinical trial has a long history: Daniel’s vegetarian diet (Daniel’s training in Babylon, Book of Daniel, Old Testament, discussed in Bhatt 2010, h/t Treece 1990) — after ten days those on Daniel’s diet looked healthier than the others who ate the King’s prescribed meal of meat and wine; James Lind’s scurvy trials on board HMS Salisbury British ship in 1747 (references in Bhatt 2010). Randomized control trials (RCT) were introduced by Hill and others in 1946 study of streptomycin efficacy against tuberculosis. The effectiveness of RCT are now established and integral to regulation of drug development.
Use of clinical trials unfortunately has a longer history than recognition of human rights (Rice 2008). World War II Nazi medical research atrocities are well known (Berger 1990), so too the longitudinal study of Tuskegee syphilis study on African-Americans (Brandt 1978). But there are too many other examples: 1884 Hawaii, inoculation of Keanu by Dr. Arning with leprosy in exchange for commuting Keanu’s death sentence to life imprisonment (Keanu developed leprosy and died in 1890, Binford 1936); many studies of American Indians/Alaskan natives (Hodge 2012). Concerns about ethical treatment of participants in studies remains a challenge; see controversy over prospective randomized control trial (NCT00078182) of safety and efficacy of an HIV prophylactic tenofovir treatment in Cambodia (Singh and Mills 2005, Mills et al 2005).
Rules of conduct were established at Nuremberg, and subsequently extended and codified by Belmont Accords: core principles of respect for persons, beneficence, and justice. Ethical standards of who participates are institutionalized by IRB boards. True informed consent remains challenging (Rothwell et al 2021 and references therein).
Figure 1 shows how common in PUBMED randomized control trials and references to use of double blind design in research (Fig 1).
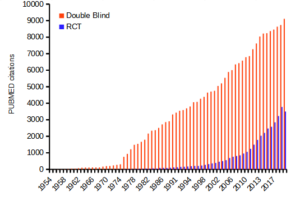
Figure 1. Search of PUBMED for “RCT” and “double blind” studies from 1950 to 2024.
Ethics of clinical and experimental research
Informed consent of subjects before proceeding in a clinical trial is a required, essential component of the design of a clinical trial. Guidelines for research conducted on human subjects originated from The Nuremberg Code (Shuster 1997). The Code was formulated 67 years ago, in August 1947, in Nuremberg, Germany, by American judges sitting in judgment of Nazi doctors accused of conducting torturous experiments on humans in the concentration camps (Shuster 1997). It served as a blueprint for today’s principles that ensure the rights of subjects in medical research. Achieving informed consent is not always straightforward (Nijhawan et al 2013), and we continue to see research that challenges ethical standards (eg, discussion in Suba 2014). Additionally, and perhaps less appreciated, the Nuremberg Code is justification for invasive animal research: animal research must precede human subject testing (Shuster 1997).
While informed consent is required, clearly, it is not enough. Emmanuel et al (2000) provide a framework for evaluating the ethics of a research program involving human subjects:
- Value
- Scientific validity
- Fair subject selection
- Favorable risk-benefit ratio
- Independent review
- Informed consent
- Respect for enrolled subjects
An additional concept, clinical equipoise (Freedman 1987) is relevant. Freedman noted that the researcher must have “genuine uncertainty” with respect to the merits of each treatment, or an “honest null hypothesis.” If a consensus exists that one treatment is better than another, including placebo, then there is no null hypothesis and the research would be invalid (Emmanuel et al 2000). Take, for example, the suggestion that clinicians should withhold angiotensin converting inhibitors (ACE2) from their hypertensive Covid-19 patients (Fang et al 2020; discussed in Tignaneli et al 2020). The hypothesis comes from the observation that SARS-COV2, like SARS-Cov, binds with ACE2 receptor in order to invade the cell. Blocking ACE2 inhibitors then would reduce activation of pulmonary renin angiotensin system and subsequent lung injury. Tignaneli et al (2020) called this a case of clinical equipoise — they argued no evidence supports “routine discontinuation” of ACE inhibitors.
Returning to the framework, Emmanuel et al left the equipoise consideration off their list for a number of reasons — for example, clinical equipoise can lead researchers to view pursuit of research has the same weight as therapy. Importantly, the proposed framework shifts the focus from the researcher views to a structured process of oversight that may minimize exploitation. It emphasizes factors like independent review and informed consent as more reliable ethical safeguards.
Moreover, the Nuremberg Code is foundational but not the current, nor the sole guidance for research conducted on human subjects; modern biomedical research is guided by more comprehensive documents like the Declaration of Helsinki and the Belmont Report, in addition to federal regulations and Institutional Review Boards or IRB.
Guidelines mandate detail about experimental design.
Professional journals expect authors to provide detailed descriptions of all methodology, including aspects of experimental design. Fundamental to the aim of science, to increase our knowledge An essential component of science To improve this kind of communication many journals and professional societies have promoted standards about what must be included in these descriptions. For example, efforts of the CONSORT, which stands for CONsolidated Standards Of Reporting Trials, at www.consort-statement.org, to improve the reporting of clinical trials by authors and provide guidelines for reviewers and editors is endorsed by more than 400 journals. The CONSORT checklist address
- Trial design
- Participants
- Interventions
- Outcomes
- Sample size
- Randomization
- Implementation
- Blinding
- Statistical methods
These nine elements were judged essential for authors to report how their study implemented or did not implement. The purpose of these items is to in order to improve reproducibility of published research. For animal research a similar list is available from ARRIVE (Kilkenny et al 2010). ARRIVE also addresses additional criteria and directs how these should be reported throughout the paper, not just in the methods section. Like CONSORT, hundred of journals have endorsed the ARRIVE 20-item checklist.
Clinical researchers must implement protocols to insure data management guidelines are followed. Clinical data management is a large topic in and of itself, so we won’t discuss this area further. However, good data management practice across disciplines share a number of features. For example, all data records should include metadata, where metadata refers to “information about data,” and would include enough information about the experiment, including
- dates and times of observations
- personnel
- facilities
- protocols used
- number of subjects
- list of variables with definitions
- full name of variable plus any acronym
- measurement units
- instrumentation
- notes about data quality
- conditions
and more (this is hardly an exhaustive list). Metadata therefore explains how data were obtained. Lists of variables are also called data dictionaries. If data are stored in spreadsheets, for example, then good practice includes including a worksheet with the metadata for the data set.
Note 1: We introduced metadata and data dictionaries with our discussion about data types in Chapter 3.1.
Questions
- Be able to define the following terms
- case control
- case study
- cohort study
- cross sectional study
- observational study
- experimental study
- single arm trial
- single blind vs double-blinding in research design
- Early in the Covid-19 pandemic, hydroxycholoquine was suggested for treating Covid-19 patients, and some called for prophylactic use of the malarial drug. Discuss the treatment hypothesis in the context of clinical equipoise.
- Distinguish between case control prospective and case control retrospective studies and the kinds of inferences that can be made.
Quiz Chapter 5.4
Clinical trials
Chapter 5 contents
2.4 – Experimental Design and rise of statistics in medical research
Experiments and observations: Finding answers.
.
How to identify cause and effect, and the kinds of evidence that can be inferred from the various approaches to study causes of disease has became a major source of disagreement in the news. In a fascinating study, Pew Research Center reported “half of U.S. adults under 50 say they get health and wellness information from social media influencers or podcasts,” and, only about 17% of these influencers report “conventional medicine” training (Report, May 7 2026). For our purposes, I made substantial updates to this page in the fifth month after WHO had declared the Covid-19 pandemic (CDC timeline), and continue to do so today.
The pandemic left many life-lessons, for scientists and public-health supporters, but also for everyone who lived through those times. One of the lessons was how to deal with the challenges of finding treatments in real time. If you followed the news early in the pandemic, you know of the appeal from some (including Donald Trump, the then-President of the United States, Boseley 2020), for use of an anti-parasite drug, hydroxychloroquine, as prophylactic or treatment for active Covid-19 infection (cf. Liu et al 2020). The FDA as well as other institutions rapidly advised against use, in part because experimental design concerns were raised for early studies (Kupferschmidt, 2020). The issue remains contentious for some (eg, Health and Human Services Secretary Robert F. Kennedy Jr., CNN August 2, 2026 interview).
Thus, job number one for students of biostatistics is to learn how to weigh arguments for or against therapies or treatments offered. The purpose of this page is to introduce these issues — how to judge whether a treatment is effective or not.
We will spend some time later on statistical aspects of experimental design (Chapter 5), but we begin with Randomized Control Trials, or RCT, as a model for our discussion of experimental studies. The RCT we recognize today owes its beginning to the 1948 studies on streptomycin use to treat tuberculosis (British Medical Research Council 1948), but of course, the foundations of RCT and experimental design in general, go back much earlier than that date (Chalmers 2011, Hairton and Locascio 2018). For a number of reasons the RCT — experimental, prospective, double-blind clinical trial with random selection of subjects from a reference population and random assignment of subjects to a treatment group or an appropriate placebo treatment control group — is considered the “gold standard” method for producing knowledge (Kaptchuk 2001, Hairton and Locascio 2018).
Note 1. I use the phrase “gold standard” associated with the RCT in the historical context intended by the authors cited. Unfortunately, in 2025, the phrase “gold standard science” has become political (Lewandowsky 2025, Mervis 2025). What we can agree on is characteristics of research as good science: “reproducible; transparent; communicative of error and uncertainty; collaborative and interdisciplinary; skeptical of its findings and assumptions; structured for falsifiability of hypotheses; subject to unbiased peer review; accepting of negative results as positive outcomes; and without conflicts of interest,” Sec. 3. Restoring Gold Standard Science, Presidential Executive Order, May 23, 2025. But even this list is not above scrutiny.
This discourse is way above my pay grade, but for starters, I would replace “without conflicts of interest” with “without disclosure of potential conflicts of interest.” The latter is practical, the former is likely not at all achievable. After all, even where a conflict exists, it does not immediately follow that the reported science is bad, that the conflict is evidence by itself of bias. Reporting conflicts warns the reader that results and conclusions may warrant further scrutiny, but outright dismissal is itself contrary to good science practice. Certainly, there are other aspects to defining what is and what is not good science. And, “gold standard” is just a metaphor (Love 2003), and, frankly, a very out-dated one. The United States and most other nations long ago gave up — for many good reasons — the gold standard as a monetary standard.
Technically, RCT are intervention trials, a specific application of the more general definition of an experiment. That is, the researchers tests a potential drug or therapy in people to observe its effect while holding other variables constant. Experimental studies imply that the researcher imposed treatments or controls onto subjects. The subjects are followed and outcomes are recorded. Thus, experiments by definition are also prospective studies — the outcome is recorded for subjects after some period of time. With a well-designed experiment, the researcher may have evidence to support the claim that, for example, Treatment A causes the outcome.
RCT applied to human health can have profound impact on lives.
The ALLHAT-LLT (JAMA, 2002) trial tested whether adding the cholesterol-lowering drug pravastatin to standard care would reduce heart attacks and deaths in people with high blood pressure and moderately high cholesterol. The study found no significant benefit compared to usual care, suggesting that statin therapy may not always provide extra protection in this group. Its results helped refine how doctors balance blood pressure and cholesterol treatment in heart disease prevention.
The Women’s Health Initiative (JAMA, 2002) trial tested the effects of combined estrogen and progestin therapy in healthy postmenopausal women. It found that while the therapy slightly reduced the risk of fractures and colon cancer, it increased the risk of heart disease, stroke, and breast cancer. These results transformed medical guidance by showing that hormone therapy should not be routinely used to prevent chronic disease in postmenopausal women.
The Du Toit et al. (NEJM, 2015) study showed that introducing peanut-containing foods early in life — rather than avoiding them — greatly reduced the risk of developing peanut allergies in high-risk infants. This landmark randomized trial changed how doctors think about food allergies, leading to new guidelines that encourage early introduction instead of avoidance.
And more recently, we have study reported by Deanfield et al (Lancet, 2025), which found that semaglutide reduced the risk of major adverse cardiovascular events (MACE) in adults with overweight or obesity and established cardiovascular disease—even if they did not lose much weight or had lower baseline adiposity.
In contrast, observational studies are those in which treatments arise by acts of nature. In both experiments and observational studies, there can be treatment and control groups; the distinction between the types of studies is how assignment of subjects to treatments were affected. Observational studies generally are retrospective studies — the outcome has already occurred, the researcher follows up to identify differences among the groups that may account for different outcomes. Examples of observational, retrospective study designs include cross-sectional and case control; cohort studies are prospective studies. Observational studies are discussed further in Chapter 5.4 – Clinical trials.
Compared to observational studies, in principle, experiments can establish cause and effect. Cause and effect refers to an explanation about relationship between two events or objects. In biology, Ernst Mayr (1904 – 2005) distinguished between two levels of explanation, proximate (how) explanations and ultimate (why) explanations (Mayr 1961, cf. Laland et al. 2011). As you know, our mechanism for identifying cause and effect is application of the Scientific Method (Chapter 2.5). Discussions of how to detect cause and effect are provided throughout this book, but emphasized in a few sections (Chapter 16.2 and 16.3).
Good experiments.
The principles of good experiments include many steps beyond simply choosing treatments and controls. In Chapter 5 we’ll go into more depth, but I wished to list for you some of the key principles of good experimental design. With respect to human-subject research, the researcher needs to protect against many sources of potential bias.
- Randomization of subjects assigned to treatment groups controls for individual differences.
- Controls (eg, Placebos) are a means to establish controls in a study so that effects may be attributed to the active treatment.
- Single-blind implies that the subject does not know what treatment was given.
- Double-blind implies that not only is the subject unaware of the treatment received, but, crucially, neither does the researcher.
- The double-blind design — neither the patient-subject nor the researchers know who received the placebo or the treatment — controls for subtle biases.
Note 2. Experimental control implies researcher imposes conditions to remove possibly confounding effects on the dependent variable — outcome of the experiment. Placebo, derived from Latin placere, to please (but see Aronson 1999). Placebo refers to an inert substance (“sugar pill”), or to a substance with known activity but without effect on the target condition or “wrong indication” (eg, antibiotics administered for viral infection), given to research subjects in lieu of the active treatment of interest (the hypothesis). Thus, placebos are examples of treatment controls.
The placebo effect is improvement of subjects who received the placebo and not active treatment (Pardo-Cabello et al 2022). In contrast, nocebo effects are adverse effects attributed to placebo treatment. Under most circumstances, placebo applies to humans only because placebo effects are thought to be product of psychological factors, although mechanisms of action are in dispute. Is sentience necessary for a placebo effect (cf. McMillan 1999)?
The experimenter may influence the outcome of the experiment if knowledge about who received the placebo or the new drug; the subject may respond differently with knowledge that they received the placebo and not the new drug. The key intent in this experimental design is to avoid systematic error, errors in studies that may occur because of our conscious and unconscious beliefs and biases. Placebos are used as treatments because people (and animals!) sometimes get better (or worse) with or without treatment; thus, to be effective, subjects receiving a new drug must get better more frequently than do subjects on placebo. Importantly, the well-designed placebo allows the researcher to gain insight into the mechanism of action by the new drug.
A case to consider: Comparing migraine treatments.
.
Consider the following experiment (Diener et al 2006; see also Liu et al 2018): subjects who had several migraines per month were treated with acupuncture, sham-acupuncture, or standard treatments including beta blockers, calcium channel blockers, or antiepileptic drugs. After 26 weeks the reductions in reported migraines was compared. The authors reported that there was no difference in numbers of migraines among patients who received the different therapy treatments. The authors conclude that because acupuncture lacks side-effects that may occur with standard therapies acupuncture may be a good choice for patients seeking relief from migraine. This is a classic experiment — subjects were assigned to treatments by the researchers. At least in principle, if one treatment group showed better outcomes, the improvement could be attributed to the treatment.
Another case to consider: When the cause isn’t clear.
.
Consider the following example. My dad was diagnosed with lung cancer in his late 70s; his left lung showed many spots when imaged and biopsy confirmed. Surgeons removed half of the lung and after several years he was considered cancer free. Why did he develop cancer in the first place? If you immediately think, “He’s a smoker,” that’s not a good explanation — and shame on you, you’re first instinct was to blame the patient (see discussion in Huff 2013). Dad last smoked tobacco in his early thirties (latency smoking-lung cancer link about 20 years, Lipfert et al 2019).
Tobacco smoking is not the only environmental trigger for lung cancer. Cancer of the lung in non-smokers is the seventh leading cause of cancer mortality worldwide (Field and Withers 2012). Long term exposure to radon gas, a naturally occurring, radioactive noble gas has been linked to lung cancer (EPA). I grew up on Vashon Island, Washington, in a non-smoking home environment. Radon levels on Vashon Island and other areas around Puget Sound are low (source: Washington State Department of Health). Radon is out as an explanation.
What other environmental sources may be linked to cancer? Vashon Island is rural, but, as it turned out, within range of effluent from a copper smelter located in nearby Ruston, Pierce County (Fig 1; my home was 17 km distance from the smelter).

Figure 1. Left: ASARCO smelter, Ruston, Washington, image from Department of Ecology, State of Washington. Direction of smoke from the stack is north, toward Vashon Island. Right: Voronoi map of arsenic and lead affected areas. image from kingcounty.gov. Darker regions correspond to heavier arsenic and lead contamination of soils.
The smelter was last in operation in 1986 and was torn down in 1993 (EPA publication number 910R94001). The smelter stack rose more than 500 feet dispersing smoke laden with heavy metals, notably inorganic arsenic and lead, into the air (Bromenshenk et al. 1985). Over the smelter’s 68 years of service, winds carried away the smoke to my island and to other areas known now as the “Ruston-Vashon Island Exposure Pathway” (Kalman et al 1990). The former smelter site was among the first listed Superfund sites (1983) in the United States by the EPA. Thus, tens of thousands of people were (and continue to be) exposed to the heavy metals deposited into the soils, forming a distinct exposure group (Milham & Strong 1974; Kalman et al 1990; EPA 2000). Arsenic exposure can be via inhalation, skin, or in drinking water — areas of Vashon-Maury island continue to have high levels of arsenic in both the soil and in any domestic water wells (PublicationNo. 14-09-044, Department of Ecology State of Washington).
Note 3: A personal comment — I stumbled onto the article by Bromenshenk and colleagues by accident. Instead of attending lecture, as I often did at the time, I was looking through journals in the research library. I was shocked at this article, because for the first time, I connected the smelter to the island I grew up on. The contamination on the island just wasn’t a conversation.
Is arsenic exposure by inhalation a plausible mechanism for my Dad’s lung cancer? As shown in Fig 1, the soils on Vashon near my home were heavily impacted by the smelter. Exposure could have come about from exposure during routine yard work — I have memories of clouds of dust kicked up by the lawn mower during spring and summers. Thus, an exposure route is possible. What evidence can we come up with?
Figure 2A shows negative association between lung and bronchial cancer incidence rates per 100L persons, adjusted for age, for several Washington state counties between 2000 and 2020 and distance from the smelter in Ruston. For comparison, Figure 2B shows no association between bladder cancer incidence rates per 100K for the same counties and time period and distance from the smelter. Workers exposed to arsenic have higher rates of lung cancer (Sullivan 2007, Wei et al 2019; see Enterline et al 1987 for a study a study based on cancer of workers at the smelter). Cultured lung cells exposed to arsenic associated with changes in gene expression (Clancy et al 2012). Coincidently, two of the family dogs developed and died of cancer as did one female goat. Perhaps my dad’s lung cancer was attributed to long exposure to arsenic (a decade after the cancer, and long after he stopped with yard work, his blood readings for arsenic were in the range of a modest 11 μg/L).
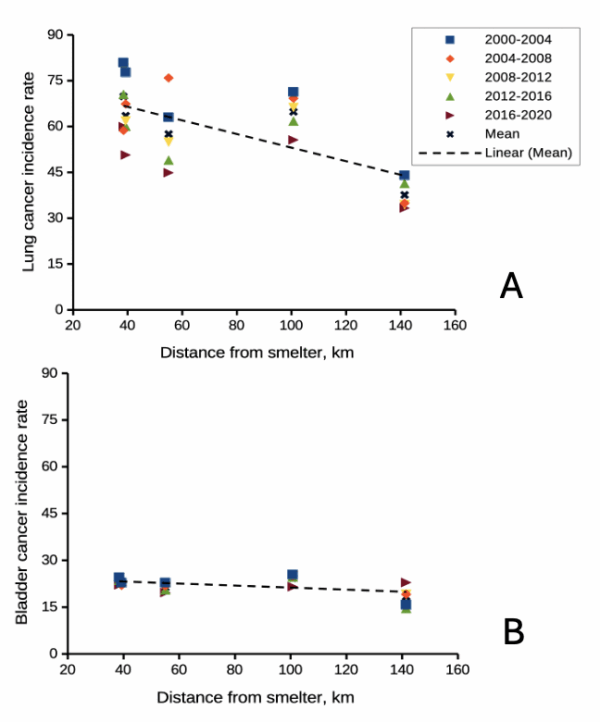
Figure 2. County cancer rates (A, lung and bronchial; B, bladder) from 2000 – 2020 vs distance in kilometers from ASARCO smelter, Ruston, WA. Data compiled from Washington Tracking Network (WTN). The counties were King (55 km), Kitsap (39.28 km), Pierce (38.48 km), San Juan ( 141.43 km), Snohomish (100.73 km), and Spokane (385.34 km).
If this scenario seems plausible, I hope you immediately recognize it as a case of confirmation bias (see Chapter 2.6). Putting aside for a moment the different arsenic species, each with different LD50 (the lethal dose needed to kill half the population — see Chapter 20.10), the difficulty ascribing arsenic as a causal agent for my Dad’s cancer is that many other exposures happened simultaneously. For example, indoor carpets are a primary source of several volatile organic compounds (Haines et al 2020). Prior to 1980 carpets may have included formaldehyde and other known carcinogenic agents. Dad commuted by car between work and home — with a ferry ride between — for decades (until the early 1990s), routinely traveling heavily congested roadways, this during the years prior to and the early years of the Clean Air Act of Environmental Protection Agency of the United States (it wasn’t until 1981 that new cars met EPA emission standards: Clean Air Act timeline here). Thus, all commuters including my Dad were exposed to gasoline combustion emissions, many known to be carcinogenic (Parent et al 2007). Moreover, a limited study by Public Health of Seattle and King County (2001) found rates of cancer on Vashon between 1980 and 1988 were similar to other areas in King County.
Summary.
It’s easy to fall into the trap that experiments — and by extension meta-analysis and systematic reviews — are the best tools offered by science for developing knowledge about the world, and other approaches suffer by comparison. But after even a bit of reflection, we should recognize that it can’t be that simple. While we now “know” tobacco cigarette smoking increases lung cancer risk, and many experiments with animal models convincingly show the link (eg, Hutt et al 2005), no human experiment in the strict sense, ie, prospective, randomized control trial, has ever been conducted (hint: it would be unethical, see discussion in Allmark and Tod 2016). Instead, the accumulated evidence from observational studies on exposures of different populations over the years overwhelmingly points to smoking as a leading risk factor (cause) of lung and other cancers — an example of Hill’s guidelines of causality. We end with a quote:
RCTs can play a role in building scientific knowledge and useful predictions but they can only do so as part of a cumulative program, combining with other methods, including conceptual and theoretical development, to discover not ‘what works’, but ‘why things work’ (p 2, Deaton and Cartwright 2017).
Questions.
.
- Write up three learning outcomes for this page. Hint: Point your favorite generative AI to this page and ask for help.
- Was my Dad’s lung cancer attributable to his 40 years plus exposure to soil arsenic (he’s a non-smoker)? How should we approach this question?
- In Diener et al (2006), the authors concluded that because acupuncture lacks side-effects that may occur with standard therapies acupuncture may be a good choice for patients seeking relief from migraine. Do you agree with the authors?
- Ethical standards evolve with time. An ongoing debate in research is whether and how placebos are to be used in human subjects research. Placebos are a means to establish controls in a study so that effects may be attributed to the active treatment. The “gold standard” of clinical trials is considered to be the randomized double-blind design — neither the patient-subject nor the researchers know who receives the placebo or the treatment. Following review of the WHO report on Use of Placebos in Vaccine Trials, pick one study and evaluate whether or not the decision to use placebos was warranted in your opinion.
- I searched PUBMED for “double-blind” by decade and found the following results (August 2018) (Table 1). Open R and/or R Commander and create two variables, then generate a scatter plot. Describe the shape of the relationship between number of publications citing “double-blind” and time (eg, 1950 – 1959, 1960 – 1969, and so on).
| Decade | Publications |
|---|---|
| 1950 | 60 |
| 1960 | 995 |
| 1970 | 7184 |
| 1980 | 24737 |
| 1990 | 39643 |
| 2000 | 53965 |
| 2010 | 69265 |
- Here’s one way to enter this data into R. At the R prompt (or in the R Script window of R Commander), create two variables,
DecadeandPubsDecade <- c(seq(1950, 2020, by=10))Pubs <- c(59,995,7161,24728,39670,54011,57043)Make an XY scatter plotplot(Decade,Pubs) - Repeat the PUBMED search as above but search for “placebo”. Make a table like the one above and provide a scatterplot of your results.
- Is the concept of a placebo relevant if the subjects in your experiment are yeast cells, not humans?
- Similarly, if your subjects are yeast cells, how does the concept of performing experiments “blind” apply?
- Ethical standards change with time. An ongoing debate in research is whether and how placebos are to be used in human subjects research.
- If placebos are so important, why is their use a concern in clinical trials?
- Following review of the WHO report on Use of Placebos in Vaccine Trials (see Readings below), pick one study and evaluate whether or not the decision to use placebos was warranted in your opinion.
R notes for question 5:
<-is an assignment operator (assignOP); everything to the right of<-is assigned to the object named to the left of the<-operator. You can instead use=in place of<-, but because=is also used in other contexts besides assignment, a quick look at blogs by data scientists will find a preference to use<-for clarity and consistency.c()“combines” arguments into a vector.seq()is used to generate a sequence of numbers between a lower and an upper limit; ifby = nis included, the sequence will be increased by the value n. If omitted, then the sequence is increased by 1.
Quiz Chapter 2.4
Chapter 2 contents.
.
- Introduction
- Why biostatistics?
- Why do we use R Software?
- A brief history of (bio)statistics
- Experimental Design and rise of statistics in medical research
- Scientific method and where statistics fits
- Statistical reasoning
- Chapter 2 – References and suggested reading