10.3 – Paired t-test
Introduction
Good experiments include controls. Interested in a new treatment for weight loss? Define a control group to compare the weight loss by a group using the new product. In many cases, the best control is the individual.
Consider now a basic experimental design, the randomized crossover trial (Fig 1), introduced in Chapter 2.4.
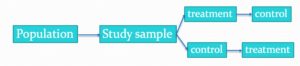
Figure 1. A two group Randomized Crossover Trial.
Subjects randomly selected from population of interest, then again once recruited into one of two treatment arms: arm 1, subjects first receive the experimental treatment, then some time later the subjects receive the control treatment; arm 2, subjects first receive the control treatment, then some time later the subjects receive the experimental treatment. Note the difference between this paired or repeated measures design and the independent sample design (see Chapter 10.1). Repeated measures designs have many advantages; we discuss them further in Chapter 14.6. At the start, repeated measures designs have greater statistical power compared to cross-sectional (independent) sample designs.
Many experiments are designed so that subjects receive all treatments and responses are gauged against the initial values recorded on the subjects. Repeated measures statistical tests, like the paired t-test, are needed however to analyze the data. These types of statistical procedures are similar to the two sample independent t-test that we discussed earlier.
However, there is an important difference between these two types of statistical procedures. For the two independent sample t-test the samples are unpaired: we observed one variable on some individuals assigned to two different groups. These groups might be
- Two locations where we measure plants or animals
- A treatment (or experimental) group with a control group.
- Expression of cytokeratin genes (eg, ΔΔCT, fold-change) from breast cancer patients compared to healthy donor subjects (Andergassen et al 2016).
The point is that samples in one group are not the same samples in the second group.
In the paired t-test we have two groups but the observations in these two groups are paired. Paired means that there is some relationship between one observation in the first sample and one observation in the second sample (every observation in one sample must be paired with one observation in another sample).
For example, weight change in humans before and after a change in diet could be performed as a paired analysis. Each subject’s weight before the diet was “paired” with the same subject’s weight after the diet.
Another example comes from genetics. Siblings or Monozygotic twins or clones, strains or varieties of plants or animals can be Paired in an experiment.
- You can give one of the twins a particular diet, or the plant or animal clones or strains can be raised in a particular environment (nutrient)
- The other twin or plant or animal clone or variety can serve as a type of control by providing a normal diet or normal environment.
Another example is a study of environmental pollution on cancer rates in many different communities.
- The researchers selects pairs of communities with similar characteristics for many socioeconomic factors.
- Each pair of communities differed with respect to the proximity to a known source of pollution: one of the pair was close to a source of pollution and one of the pair was far from a source of pollution.
The purpose of pairing in this example is to attempt to “control” for all the socioeconomic factors that might contribute to cancer but they did not want to directly measure. These other factors should be similar for each member of the pair.
Example: How repeatable is human running performance?
The subheading is misleading — we leave “repeatability” or, do individuals perform consistently to another time (see Chapter 12.3 – Fixed effects, random effects, and agreement). Here, we focus on a different question — we test whether mean performance differs across repeated trials. This may seem a subtle difference, but consistency asks the question if performance, whether it is answering questions on an exam or running times for a race, is stable across trials. Testing the means of first and second trials asks a different question: we test for a trend in performance, which may reflect learning.
Here’s an example in which a measure was taken twice for the same individuals. The data are running speed or pace during 5K race held annually on Oahu for a selected sample of female runners with repeat race times (20 – 29 years old). The race was run annually on Oahu, and the data reported are the pace for the first race and the second race, which occurred a year later (Jamba Juice – Banana Man Chase, Ala Moana Beach Park, data extracted from source, https://timelinehawaii.com).
Table 1. 5K pace times (kph) for 15 women (20 – 29 years)
| ID | First race | Second race |
|---|---|---|
| 1 | 15.28 | 15.61 |
| 2 | 11.22 | 11.19 |
| 3 | 8.80 | 9.14 |
| 4 | 8.88 | 5.46 |
| 5 | 9.81 | 10.50 |
| 6 | 6.12 | 5.69 |
| 7 | 8.31 | 8.71 |
| 8 | 6.26 | 7.42 |
| 9 | 17.16 | 16.41 |
| 10 | 16.23 | 15.82 |
| 11 | 5.90 | 7.12 |
| 12 | 8.31 | 10.48 |
| 13 | 5.93 | 8.64 |
| 14 | 10.54 | 5.99 |
| 15 | 9.53 | 8.69 |
Note 1: We’ll return to this data set in Chapter 15.3
Load the data into R as an unstacked data set. Data available at end of this page or click here.
Begin with description and exploration of the data. Start with histograms to get a sense of the sample distributions (hint: we’re looking to see if the data looks like it could come from a normal distribution, see Chapter 13.3 Assumptions) (Fig 2).
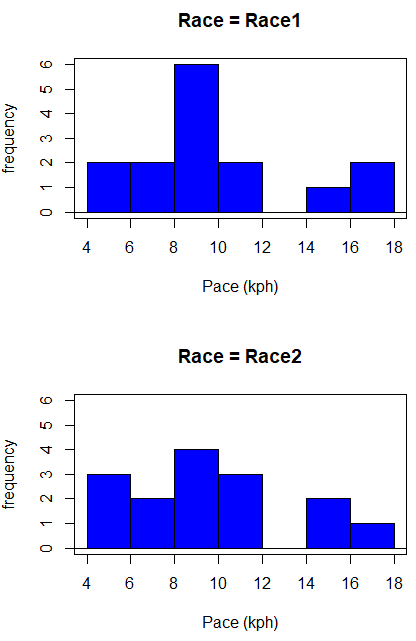
Figure 2. Histograms shows the distribution of 5K running times of 15 women who ran the race twice.
R code (stacked data set, then used defaults R Commander to make the histogram, then modified the code and submitted modified code to make Fig 1)
with(stackExCh10.3, Hist(obs, groups=Race, scale="frequency", breaks="Sturges", col="blue",
xlab="Time (min)", ylab="Frequency")))
Conclusion? The histograms don’t look normally distributed so we keep this in mind as we proceed. (See Chapter 13 – Assumptions of parametric tests for additional information about assumptions.)
A box plot comparing the first and second pace times (Fig 3).
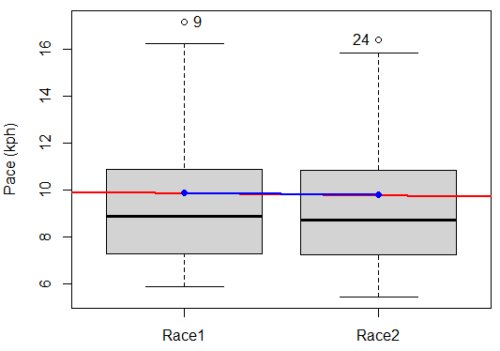
Figure 3. Box plot of race speed (kph) for 15 women 5K in two successive years.
I added a trend line (linear regression, see Chapter 17, red line) and connected the averages (blue line) for visual emphasis — no differences between the means — but note that one wouldn’t do this as part of an analysis (see Chapter 4 discussion).
R code for Fig 2
Boxplot(obs~Race, data=stackExCh10.3, id=list(method="y"), xlab="", ylab="Pace (kph)") #boxplot was made in Rcmdr
abline(lm(obs ~ as.numeric(Race), data=stackExCh10.3), col="red", lwd=2)
means <- tapply(obs, Race, mean)
points(1:2, means, pch=7, col="blue")
lines(1:2, means, col="blue", lwd=2)
The box plot works to show the median difference, but loses the paired information. A nice package called PairedData has several functions that work well with paired data, for example a profile plot (Fig 4). A profile plot is useful for showing an association between paired data.
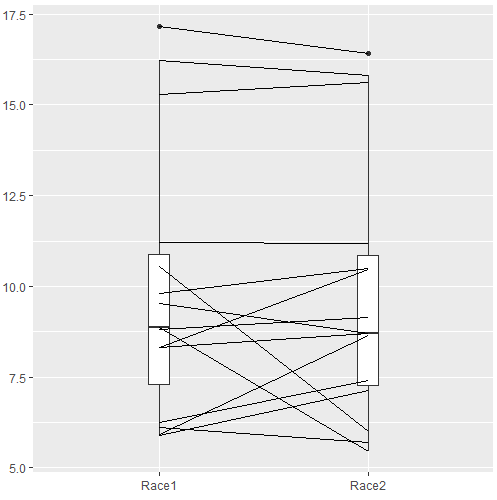
Figure 4. Profile plot, PairedData package.
R commands for Figure 4.
require(PairedData)
attach(example.ch10.3) # remember to attach dataframe so you don't have to call variables like example.ch10.3$Race1
races <- paired(Race1, Race2)
plot(races, type = "profile")
Paired t-test calculation
The paired t-test is a straight-forward extension of the independent sample t-test; the key concept is that the two samples are no longer independent, they are paired. Thus, instead of mean of group 1 minus mean of group two, we test the differences between sample 1 and sample 2 for each paired observation.

- Compute the differences between the Paired Samples (as in tables above)
- Calculate the MEAN difference score,
 : in the previous example = -0.094 kmh
- Calculate the degrees of freedom df = # pairs – 1 = n – 1, where n is the number of pairs
- Calculate the standard error of the mean of d.

where

- Calculate the test statistic for paired data

- Compare to the Critical Value in Table C. 4 (Appendix Table 2)
- Find the Critical Value = t α (2), df
Try as difference instead of paired
Before you answer, take a look at the box plot of the mean difference between the repeat measures of 5K pace for the 15 women (Fig 5).
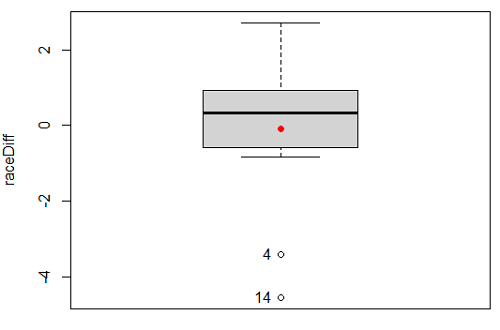
Figure 5. Box plot of differences, Red dotted lines shows the null hypothesis.
Note 2: Figure 5 is appropriate for diagnostics, but not for publication, per our discussions in Chapter 4.
Create a new variable, raceDiff, equal to Race2 minus Race1. Then, use the one sample T-test on raceDiff. I’ll leave you to complete the work (Question 2).
R code
t.test(Race1, Race2, paired = TRUE, alternative = "two.sided")
R output
Paired t-test

data: Race.1 and Race.2
t = 0.19389, df = 14, p-value = 0.849
alternative hypothesis: true difference in means is not equal to 0
95 percent confidence interval:
-0.9491017 1.1377521
sample estimates:
mean of the differences
0.09432517
Rcmdr, paired t-test
Rcmdr: Statistics → Means → Paired t-test…
Note: your two groups must be in two different columns (unstacked!) to run this version of the test.
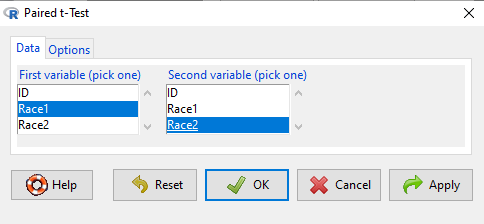
Figure 6. R Commander Paired t-test menu, Rcmdr version 2.7.
After selecting the variables, set null hypothesis after clicking on Options tab (Fig 6).
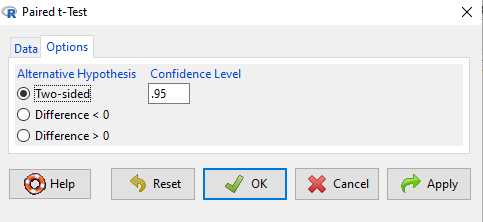
Figure 7. R Commander Paired t-Test options, select null hypothesis.
Click OK to proceed. Results will be the same as the output listed above.
the following text needs to be updated
Interpret the results.
So, what can we conclude about the null hypothesis? Interpret the 95% CI, the T-test statistic, and the P-value.
Do not ignore sample dependence
What if we ignored the repeated measures design and treated the first and second races as independent? The important concept here is to ask, what would have happened if we had done a two independent sample t-test instead?
Let’s run the analysis again, this time incorrectly using the independent sample t-test. We need to manipulate the data set before we do.
Manage your data: Stack the data
This is a good time to share how to Stack data in R. If you look at our active data set, the results of the two trials are in two different columns. In order to run the independent sample t-test we need the data in one column (with a label column).
stackExCh10.3 <- stack(example.ch10.3[, c("Race1","Race2")])
names(stackExCh10.3) <- c("obs", "Race")
Rcmdr: Data → Active data set → Stack variables in data set…
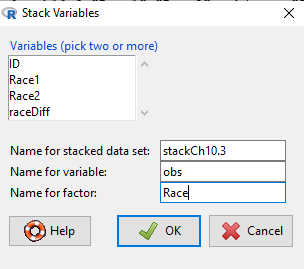
Figure 8. R Commander: Stack worksheet. Select the two variables, Race1 and Race2.
I entered values for name of the new data set, the new variable, and the name for the factor (label) column.
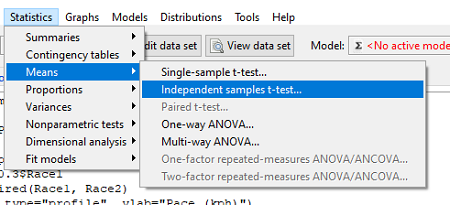
Figure 9. R Commander, select independent sample t-Test …
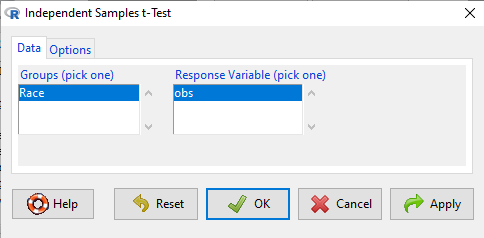
Figure 10. R commander, independent sample t test menu.
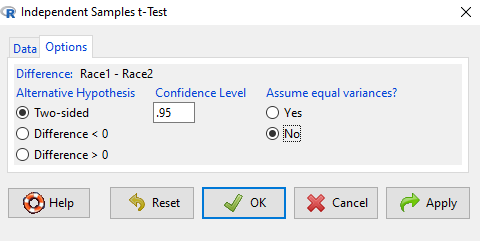
Figure 11. R Commander, select options for independent sample t-Test (assume equal variance).
Here are the results of the independent sample t-test from R.
t.test(obs~Race, alternative='two.sided', conf.level=.95, var.equal=TRUE, + data=stackCh10.3)

Two Sample t-test
data: obs by Race
t = 0.070645, df = 28, p-value = 0.9442
alternative hypothesis: true difference in means is not equal to 0
95 percent confidence interval:
 -2.640719 2.829369
sample estimates:
mean in group Race1 mean in group Race2
 9.886342 9.792017
End R output
In this case, we would have reached the same general conclusion, but the p-values are different. The p-value from the paired t-test was about 0.85 whereas the p-value from the independent sample t-test was higher, nearly 0.95, suggesting little difference between the two trials.
While the general conclusion holds, this time, that there were no statistically significant difference between the means for first and second trials. However, it won’t always work out that way. And besides, if you treated the paired data as independent, you’ve clearly violated one of the assumptions of the test.
Take a look at the degrees of freedom for the two analyses. By ignoring the pairing of samples we gain twice the number of degrees of freedom … that can’t both be right. The way to distinguish between the two is to go back to the experimental units.
Question: What are the sampling units in the case of repeat measures on individuals: the individuals themselves? the pairs of burst speed trials? something else?
it is important to note that the paired t-test is still the best for this situation because it accurately reflects the experiment — individuals were measured twice, therefore the two groups (trial 1 and trial 2) are not independent! Thus, the p-value from the paired t-test correctly reflect our best analyses of the test of the null hypothesis because the correct degrees of freedom were 14 and not 28.
In the case of the independent sample t-test we necessarily make the assumption that the two groups are independent — that is, that they are measured on different sampling units (eg, different individuals or subjects). In statistical terms, that means that you assume that the correlation between trial results is equal to zero. By incorrectly choosing an independent sample test in these repeated measures cases, I would make two null hypotheses: (1) that the means are the same and (2) that the correlation between repeat measures is zero. The problem? The t-test only evaluates the first hypothesis (means).
Questions
- Refer to Figure 6 again and related data set. Were runners faster the second year or the first year running the 5k? What about the points labeled 4 and 14? What was the average difference between first and second races?
- Complete the test of the null hypothesis of no difference between race 1 and race 2 (
raceDiff) with the one sample t-test. Set up a table to compare the test statistic, df, and p-values for results from paired t test, one sample t-test, and independent sample t-test. How do these results compare? - I’ve called the observed value “pace,” but runners would know that pace is actually amount of time per kilometer, not the total time over 5k, which is what I called pace.
- Create a new variable and report average pace for Race1 and Race2.
- Redo the paired analysis, including box plot, on your new variable.
- What is the null hypothesis for your new variable?
- Summarize your results and add to the table you created for question 2.
- Redo the two plots in Figure 2 so that the two histograms are on the sample plot. Instructions and examples were provided in Chapter 4.2.
Quiz Chapter 10.3
Paired t-test
Data set
example.ch10.3 <- read.table(header=TRUE, text = "
ID Race1 Race2
1 15.28 15.61
2 11.22 11.19
3 8.80 9.14
4 8.88 5.46
5 9.81 10.50
6 6.12 5.69
7 8.31 8.71
8 6.26 7.42
9 17.16 16.41
10 16.23 15.82
11 5.90 7.12
12 8.31 10.48
13 5.93 8.64
14 10.54 5.99
15 9.53 8.69
")
Chapter 10 contents
5.1 – Experiments
How to put an experiment together
With the background behind us, we outline a designed experiment. Readers may wish to review concepts presented previously, in
- Chapter 2.4: Experimental design and rise of statistics in medical research.
- Chapter 3.4 – Estimating parameters
- Chapter 3.5 – Statistics of error
Experiments have the following elements
- Define a reference population.
- All patients with similar angina symptoms — shortness of breath, chest pain, dizziness — but who have not suffered a heart attack, or myocardial infarction (Wu et al 2017);
- All adult frogs in a pond near industrial waste runoff (eg, Sowers et al 2009).
- Define sample unit from the reference population (eg, as many patients as can be screened by the physician are recruited; all frogs visible to the biologist are captured).
- Design sampling scheme from population (eg, random sampling vs. convenience/haphazard sampling).
- Agree on the primary outcome or endpoint to be measured and whether additional secondary outcomes are to be observed and collected.
- For the patients with similar symptoms, we follow
- For the frogs, we count adults with developmental malformations.
- Separate the sample into groups so that comparisons can be made
- We may be tempted to provide the same treatment and follow the group for improvement — that is the clinically valid approach; to be an experiment, we would use random assignment of individuals to one of two groups — half will receive a placebo, half will receive a beta blocker;,
- The frog example doesn’t follow this scheme — the event has already occured, it’s an observational study.
- Devise a way to exclude or distinguish from the possible explanations, or alternative hypotheses.
- eg, for the physician, she will record how many of her patients fail to respond to treatment;
- for the biologist, noting presence or absence of parasites between the normal and abnormal frog defines the groups).
Note 1: The studies cited are examples of work done on similar problems, they are not offered to evaluate or critique any research efforts that were done or described in these reports.
The frog study, as described by me for pedagological purposes, lacks any design elements that would allow for a test of the hypothesis that industrial runoff causes developmental malformations in frogs — I’m not saying or implying anything about the actual studies!
A basic experimental design looks like this.
- One treatment, with two levels (eg, a control group and an experimental group)
- A collection of individuals recruited from a defined population, esp. by random sampling.
- Random assignment of multiple individuals to one of the two treatment levels.
- The treatments are applied to each individual in the study.
- A measure of response (the primary outcome) and additional features (secondary outcomes) are recorded for each individual.
Of course, there are other considerations, and by now, students reading this text should be able to identify what is missing from the list. (See quiz questions.)
Contrast with design of observational studies
Importantly, for observational studies, no matter how sophisticated the equipment used to measure the outcome variable(s), key steps outlined above are missing. Researchers conducting observational studies do not control allocation of subjects to treatment groups (steps 4 and 3 in the two above lists, respectively). Instead, they may use case-control approaches, where individuals with (case) and without (control) the condition (eg, lung cancer) are compared with respect to some candidate risk factor (eg, smoking). Both case and control groups likely have members who smoke, but if there is an association between smoking and lung cancer, then more smokers will be in the case group compared to the control group.
A cohort study, also a form of observational study, is similar to case-control except that the outcome status is not known. A cohort study includes, in our example, smokers and non smokers who share other characteristics: age, medical history, etc. The other kind of design you will see is the cross-sectional study. Cross-sectional studies are descriptive studies, and, therefore also observational. Primary outcomes along with additional characteristics and outcomes are measured for a representative subsample, or perhaps even an entire population. Cross-sectional studies are used to absolute and relative risk rates. In ecology and evolutionary biology cross sectional studies are common, eg, comparisons of species for metabolic rate (Darveau et al 2005) or life history traits (Jennings et al 1998), and specialized statistical approaches that incorporate phylogenetic information about the species are now the hallmark of these kinds of studies.
A word on outcomes of an experiment. Experiments should be designed to address an important question. The outcomes the researcher measures should be directly related to the important question. Thus, in the design of clinical trials, researchers distinguish between primary and secondary outcomes or endpoints. In educational research the primary question is whether or not students exposed to different teaching styles (eg, lecture-style or active-learning approaches) score higher on an knowledge-content exams. The primary outcome would be the scores on the exams; many possible secondary outcomes might be collected including student’s attitudes towards the subject or perceptions on how much they have learned.
Note 3: While it’s logical to include secondary outcomes — they may offer support or complement the primary results — there needs to be caution in interpreting the test results of multiple secondary outcomes. By definition, the study is designed to test hypothesis about the primary or main outcome. While there are a number of concerns about testing secondary outcomes, from a statistical point of view, the study may lack the sample size — the power, see Chapter 11 — Power analysis — to test many additional hypotheses without the risk of increasing chance of false positives because of the multiple comparisons problem. We address this scenario in Chapter 12.1 – The need for ANOVA.
About Primary and Secondary Outcomes.
Consider a evolutionary physiology project on species differences and effects of body size on burst running speed of terrestrial lizards (eg, Bauwens et al 1995; Dohm et al 1998; Labonte et al 2024). Our independent variables, the things we believe influence running performance — and therefore we wish to control for — species, body size, core body temperature, body condition, race quality (see cited papers for these and other examples).
What do we measure? What are the likely primary vs. secondary outcomes for a this kind of project?
Primary outcomes are the direct, definitive measures of maximal locomotor performance. Examples may include
- Maximum Burst Speed: The absolute highest velocity achieved by the lizard over a short distance or time interval (eg, across a 0.5-meter interval).
- Maximum Acceleration: The highest rate of speed change during the start of the burst or during a sudden sprint increase.
- Stride Length: The physical distance covered during a single full stride cycle at maximum speed.
- Stride Frequency: The number of strides taken per second at maximum speed.
And what other measures may be of interest — secondary outcomes — those that may help explain why or how the primary performance metrics change across the independent variables. To list a few,
- Stance and Swing Duration: The individual time durations spent with feet on the ground (stance) vs. in the air (swing).
- Gait Transition Thresholds: The speed at which a lizard shifts from a walk/trot to a high-speed gallop or bipedal running (if applicable to the species).
- Fatigue Rate: The decline in burst speed across successive trials or over a sustained treadmill run.
- Trial-to-Trial Repeatability: The statistical consistency (intraclass correlation coefficient) of a lizard’s performance across multiple bursts.
In a prospective cohort study, we may track participants over time to observe how baseline factors predict the development or worsening of type 2 diabetes (eg, Gao et al 2026). Progression over a two year followup would be measured by incident clinical events or the longitudinal rate of change in biomarkers. Possible primary outcomes are
- Glycated Hemoglobin (HbA1c): A biomarker reflecting average blood glucose levels over the past 2 to 3 months (glycemic control).
- Fasting Plasma Glucose (FPG): Glucose concentration in the blood after an overnight fast (acute baseline glycemic regulation).
- T2D Complication Stage: A clinical score or categorization indicating the presence and severity of microvascular or macrovascular damage.
Secondary outcomes may include
- Fasting Lipid Profile
- C-Reactive Protein
- Body Mass Index
- Estimated Glomerular Filtration Rate
If one or more primary outcomes are significant, this reveals whether an intervention or exposure (like a vegan diet or income level) changes the clinical course of Type 2 Diabetes. Secondary outcomes are critical for explaining how and why it happens. Secondary outcomes provide mechanistic context.
Some caution is warranted — imagine if, after conducting the study, we find diet, age, or income did not statistically affect your primary outcome, but did significantly alter a secondary outcome (eg, improved lipid profiles). What to report? We state in your Abstract and Discussion that the study failed to meet its primary objective, and that any significant secondary findings are exploratory. We cannot claim that a diet “successfully manages diabetes progression” based solely on a secondary marker (cf discussion and suggsted guidelines in Butcher et al 2022).
Example of an experiment.
We’ll work through a familiar example. The researcher is given the task to design a study to test the efficacy in reducing tension headache symptoms by a new pain reliever. There are many possible outcomes: blurry vision, duration, frequency, nausea, need for and response to pain medication, and level of severity (Mayo Clinic). The drug is packaged in a capsule and a placebo is designed that contains all ingredients except the new drug. Forty subjects with headaches are randomly selected from a population of headache sufferers. All forty subjects sign the consent form and agree to be part of the study. The subjects also are informed that while they are participating in the research study on a new pain reliever, each subject has a 50-50 chance of receiving a placebo and not the new drug. The researcher then randomly assigns twenty of the subjects to receive the drug treatment and twenty to receive the placebo, places either a placebo pill of the treatment pill into a numbered envelope and gives the envelopes to a research partner. The partner then gives the envelopes to the patients. Both patients and the research partner are kept ignorant of the assignment to treatment.
We can summarize this most basic experimental design in a table, Table 1.
Table 1. Simple formulation of a 2X2 experiment (aka 2×2 contingency table).
| Did the subject get better? | ||||
|---|---|---|---|---|
| Yes | No | Row totals | ||
| Subject received the treatment |
Yes | a | b | a + b |
| No | c | d | c + d | |
| Column totals | a + c | b + d | N | |
where N is the total number of subjects, a is number of subjects who DID receive the treatment AND got better, c is number of subjects who DID NOT receive the treatment, but DID get better, b is number of subjects who DID receive the treatment and DID NOT get better, and d is number of subjects who DID NOT receive the treatment and DID NOT get better.
Note 4: We owe Karl Pearson (1904) for the concepts of contingency — that membership in a (or b, c, or d for that matter) is a deviation from any chance association or independent probability (Chapter 6) — and the contingency table. Contingency is an important concept in classification and is central to machine learning in data science (Michie et al 1995). We return at some length to contingency and how to analyze contingency tables in Chapter 7 and Chapter 9.2.
By convention, the standard format for an epidemiological 2×2 contingency table organizes exposure on the rows and disease outcome on the columns as follows:
- Rows (Exposure): The top row represents Exposed / Treatment (Yes), and the bottom row represents Non-exposed / Control (No).
- Columns (Outcome): The left column represents Disease / Case (Yes), and the right column represents No Disease / Control (No). See Chapter 7.
And our basic expectation is that we are testing whether or not treatment levels were associated with subjects “getting better” as measured on some scale.
One possible result of the experiment, although unlikely, all of the negative outcomes are found in the group that did not receive the treatment (Table 2).
Table 2. One possible outcome of our 2X2 experiment.
| Subject improved | |||
|---|---|---|---|
| Yes | No | ||
| Subject received the treatment |
Yes | 20 | 0 |
| No | 0 | 20 | |
Results of an experiment probably won’t be as clear as in Table 2. Treatments may be effective, but not everyone benefits. Thus, results like Table 3 may be more typical.
Table 3. A more likely outcome of our 2X2 experiment.
| Subject improved | |||
|---|---|---|---|
| Yes | No | ||
| Subject received the treatment |
Yes | 7 | 13 |
| No | 2 | 18 | |
Must a control group always be included in an experiment?
To be an experiment, yes. However, it is not true that the control treatment must only be applied to separate, individual subjects. For example, a common experimental design would be repeated measures of an outcome, like behavior (eg, feeding response) before and after an intervention is applied. Thus, the individual is its own control or reference point. For example, Dohm et al (2008) measured feeding and locomotor behavior of adult toads (Rhinella marina, formerly Bufo marinus) prior to and after ozone exposure. We concluded that a single 4-h exposure to O3 depressed toad feeding behavior, but had little effect on voluntary locomotor behavior. Typically, the design randomly assigns individuals to the treatments — some individuals get the exposure first, then the control exposure second; others, again selected at random, receive the control exposure first, then the active exposure.
The within subjects design is an important method in biological research; these designs offer control for individual differences as confounding variables and require fewer participants compared to separate control group designs. This design is effective provided there is little risk of carryover effects; if the effects of a previous condition linger, then it may influence a participant’s response in subsequent conditions, confounding the results. For our study (Dohm et al 2008) we used a modified within-subjects design by employing a split plot design. We return to within-subjects designs in Chapter 14.4 – Randomized block design.
Questions
- When I updated this page in 2020, we were in our fifth month of the coronavirus pandemic of 2019-2020. Daily it seemed, we heard news about “promising coronavirus treatments,” but no study had at the time been published that would meets our considerations for a proper experiment. However, on May 1, 2020, the FDA issued an emergency use authorization for use of the antiviral drug remdesivir (Gilead), based on early results of clinical trials reported 29 April in The Lancet (Wang et al 2020). Briefly, their study included 158 treated with does of the antiviral drug and 79 provided with a placebo control. Both groups were treated otherwise the same. Improvement over 28 days was recorded: 62 improved with Placebo and 133 improved receiving dose of remdesivir.
- Using the background described on this page, list the information needed to design a proper experiment. Using your list, review the work described in The Lancet article and check for evidence that the trial meets these requirements.
- Create a 2×2 table with the described results from The Lancet article.
- Consider our hazel tea and copper solution experiment described in Chapter 3. The outcome variables (Tail length, tail percentage, Olive moment) are quantitative, not categorical. Create a table to display the experimental design.
- For the migraine example, identify elements of the design that conform to the randomized control trial design described in Chapter 2.4.
Quiz Chapter 5.1
Experiments
Chapter 5 contents
2.5 – Scientific method and where statistics fits
- Science isn’t just a recipe.
- Hypothetico-deductive reasoning.
- It’s all about the probability of a particular event.
- A statistical translation of the Scientific Method.
- When we say “experiment,” the hypothesis came first.
- Bottom-up, Top-down.
- How to interpret a test result.
- False discovery rate: claims must be stringently evaluated.
- Projects and the data lifecycle.
- Conclusions.
- Questions.
- Quiz.
- Chapter 2 contents .
Science isn’t just a recipe.
.
The scientific method is what makes science a “powerful way of knowing” (Church and Carpenter 2008), and by now, you should be familiar with the outline: hypothesis, experiment, etc. What distinguishes science from other fields of inquiry is that at its best, science accumulates verifiable evidence about our world. I begin with a disclaimer — our introductory textbooks tend to reify the scientific method (cf. Blachowicz 2009). Outside of the classroom and introductory science text books, I don’t think you’ll find much agreement among practicing scientists precisely what the scientific method entails, or whether strict adherence to a list of steps distinguishes what scientists do compared with other professions. For one difference, typical discussions of the scientific method may emphasize the experiment, which probably brings to mind images of a lab coat and test tubes, but should emphasize the critical thinking “tool kit” (Wivagg and Allchin 2002), eg, model-based inquiry. That said, holding a view that introductory textbooks should present nuances of epistemology seems a big ask.
But we do emphasize experimentation with good reason. In principle it is straightforward to identify what control groups are needed to conduct an experiment in the lab, but what are the control groups for an experiment conducted on the computer? In most cases, one should argue that if an outcome is obtained by random processes, then no additional cause need be addressed. Therefore, the control group for a simulation would be a random process generator.
Disagreements about the scientific method center about how science is really done (eg, from a social perspective), but also because there appear to be differences in approach in sciences that work on historical questions (physical cosmology, evolutionary biology, geology), and those that conform to the classic experimental approach (chemistry, molecular biology, physics). Epistemology is a fascinating area — How do we know what we know, What exactly is science and how is it different from other areas of knowing, etc. But I will leave you only with the tantalizing suggestion to read more and start with you with a list of readings to start (see Readings below). This is the stuff of graduate and professional school; we have work to do.
Despite apparent differences between what scientists say they do and how they actually do sciences, there is broad agreement; science as a way of knowing can be characterized by the following steps (National Academy of Sciences 1999).
- Begin with facts, which are observations confirmed and treated as true
- Formulate a hypothesis, with emphasis on hypotheses that are testable statements about relationships observed about the natural world
- Given the possible outcomes, state predictions derived from the hypothesis.
- Make observations of perform an experiment designed to test the hypothesis.
- Analyze the data from the experiment.
- Evaluate the results of the experiment against the predictions.
- Repeat.
This deceptively simple list hides much work to be done. Hypotheses are not “educated guesses,” where educated guess implies an idea about some phenomenon is likely the correct explanation because of the skill or knowledge of the person making the guess. Good hypotheses make possible experimental tests whose results can be used to rule out alternative explanations, sensu Platt’s “strong-inference”.
Hypothetico-deductive reasoning.
.
I mention this disclaimer about the common (and reassuring) textbook discourse on the scientific method to suggest that, if you have not already reached this point in your career, it is time to move past the cookbook approach to thinking about what it means to do science in practice. Yet another helpful reading is from a paper in Environmental Health by Ozonoff amd Grandjean (2020).
In other words, what makes “good science”?
There is induction and deduction and probabilistic thinking that must be grappled with, all emphasizing efforts by the individual, and yet science, if it is to make any progress must ultimately be a communal activity (Varmus 2009). In particular, to the extent a researcher consistently applies hypothetico-deductive reasoning, or as Platt (1964) called it, “strong-inference,” then good science can happen (see Fudge 2014 for an update). Strong inference according to Platt implies that researchers should follow three steps (after Fudge 2014):
- develop alternative hypotheses
- think of a crucial experiment that can exclude one or more hypotheses
- perform the experiment and obtain a clean result.
Then, beginning with step 1, repeat the procedure to refine the possibilities that remain.
The list of elements of the scientific method neglected to address the crucial role of scientists engaged in an active community of scientists fits in. However, we can can quickly suppose that every step of the scientific method can involve input from others to help shape, improve, and indeed carry out the activities needed to practice science. What scientists share is critical thinking and the tools of statistics provides a common language.
It’s all about the probability of a particular event.
.
Platt (1964) wrote that the observations we make that are puzzling or hard to explain, which implies our understanding is incomplete. We then proceed to ask questions about why the observations are different from our expectations, and we speculate about how the outcome comes about. Thus, we have to consider the probability, or chance, of a particular outcome (event) compare to other possible outcomes. Statistics is about analyzing the probability of outcomes. But there is a twist; there are two distinct, but complementary approaches to statistics. Most of the statistics you have been taught so far comes from the frequentist approach. That is, how often (frequency) will we get the kind of results we observe given the hypothesis? Another approach can be termed Bayesian, where the question is how likely is the hypothesis to be correct given the data? These two approaches view the data obtained from the same experiment differently. A frequentist views the data as random — repeat the experiment and the results will differ — but the hypothesis is fixed (it is either true or it is not). A Bayesian on the other hand views the hypothesis as random with a probability of being true somewhere between zero and 100 percent and the data are fixed.
Which are you, a frequentist, or a Bayesian? Consider the following from xkcd.com no. 1132 (Fig. 1).
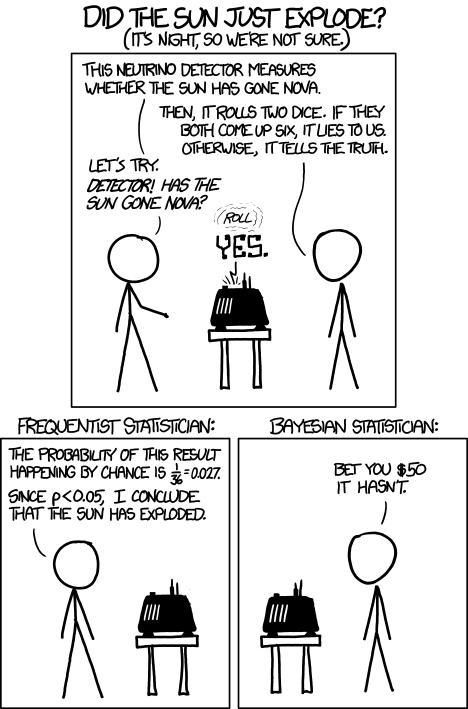
Figure 1. “Frequentists vs Bayesians,” xkcd.com no. 1132
The Bayesian approach makes sense when there exists prior knowledge — the Sun came up this morning, as it did the day before, and the day before that, etc. New data are assessed against what we already know. The Frequentist approach, despite philosophical shortcomings, works for analyzing experiments where prior knowledge is lacking about outcomes. Because much of biomedical research is based on the Frequentist approach, most of our efforts, too, will utilize that approach.
A statistical translation of the Scientific Method.
.
Given our frequentist perspective, we can outline our Scientific Method as follows.
- Formulate a Null and an Alternative hypothesis.
- State predictions from the Null and an Alternative hypotheses.
- Design an experiment or observation.
- Analyze the data from the experiment or observation.
- Interpret the experiment or observation.
- Evaluate the predictions from the Null and an Alternative hypotheses.
- Accept (provisionally) or reject (provisionally) the Null hypothesis.
- Evaluate model fit and robustness
- Repeat.
In practice, there is more to statistics than these 8(9) steps, but this does provide the outline of what statistical analyses are about. There are nuances to how a Frequentist or a Bayesian views statistical analyses as evidence for or against a conclusion (Goodman 1999a, 1999b). We need to distinguish between when data are acquired in the process; data may come before or after the hypotheses are stated. In epistemology, hypotheses are either a priori or a posterori and we need to add these to our discussion of Scientific Method. The terms are Latin, translated apparently as “from the earlier” and “from the later, respectfully.
Note from the lists described as “the” scientific method how hypothesis comes first. Folks who think and write about how and why we know what we know — the discipline is called epistemology — tell us we are generally on more solid footing when we design experiments with specific intent, specific and testable hypotheses. The branch of statistics concerned with experimental design provides rich context for many practical aspects of how to implement experiments — in other words, how to follow the Scientific Method, even if turns out there isn’t just one universal definition of Scientific Methods out there.
When we say “experiment,” the hypothesis came first.
.
More commonly in statistics, the phrases planned, and therefore a priori, and unplanned or a posterori, comparisons are referenced. In practice, biologists design experiments and make observations accordingly to test one or more hypotheses, but they may also address additional hypotheses after the fact. Especially if the experiment generates a lot of data.
You may have also heard of the phrase data mining. Data mining is loosely defined, but mostly refers to sets of protocols and procedures to extract patterns from large data sets stored in databases. Google apparently does lots of data mining as do many other businesses that obtain large amounts of data. Unplanned comparisons includes any data mining protocols, no matter how sophisticated the language sounds (feature selection, classification tree). Data mining is not consistent with classic experiments; it’s different than Step 6 (Step 8 in the second list) listed above because no new data or experiment is carried out.
Can you get away with coming up with and testing new hypotheses from data gathered from an experiment designed to test a different hypothesis? Yes, and of course, the process can be quite profitable for Google. However, you should proceed with caution and restraint. If you are not careful about how you write it up — you will probably be called on it by a reviewer of your work. Is this a posterori approach still science? Of course, yes! I’d even go so far as to say that when one studies real systems, you can’t limit yourself to only planned hypotheses and testing. At least, one designs experiments and carries out those tests but then also uses current data to generate new ideas. Science is also exploratory — you may not design an experiment at all, but through observations, you probably will develop testable hypotheses! We’ll return to these concepts soon. What you must be aware of in any unplanned comparison or data mining sojourn is the possibility of committing a data dredging (aka p-hacking) sin — searching through data to come up with misleading, but statistically “significant” results (Ioannidis 2007; Stefan and Schönbrodt 2023).
Testing of unplanned a posterori hypotheses is a real concern in science. On the one hand, those who think about how we learn about the world and make sense of it have stated emphatically that the best way we know is to follow the scientific method — and that begins with hypotheses followed by designed experiments to test claims derived from those a priori hypotheses. We (teachers, textbook author) continue to teach science as the act of individuals toiling away in the forest or in the lab, pursuing sets of questions that may involve the collection of measurements on dozens to a few hundred subjects. While this type of science is still in practice, there is no doubt that big science involving many people is more common and, perhaps, better at generating new knowledge (Wuchty et al 2007). One result of “big science” is to generate a lot of data, the very essence now of big data, and there must be room for testing of new hypotheses gathered on data sets. This is the essence of the argument for the ENCODE project (ENCODE Project Consortium 2012) — generate lots of genetic data on the human genome using common techniques and make the data publicly available — new research can be conducted on old data.
Bottom-up, top-down.
.
Consider the pronouncements (almost daily it seems!) about the discovery of a new gene for some disease, process, or behavior in humans. Often times, although not always, these “discoveries” are not duplicated by other research groups. Why not? Well, for one, the phrase “gene for” is a dubious shorthand for what is usually a more complex causation. But from our statistical perspective it is problematic because the search for genes is really an a posterori exercise — one begins with phenotypic differences (some have the disease, others do not) and some genetic information (SNPs, DNA sequencing) and then proceeds to see if there are any differences in the genetic material at hand between the two groups. This approach, the Genome Wide Association Study, or GWAS, would be termed “top-down” — begin with the phenotypic differences and search for genetic differences between those that do and those who do not have the condition. Sampling is an issue (are the unaffected subjects a random sample from the entire population?), but the problem also is one of logical design — the hypothesis is made after the fact — a statistical difference between the groups is attributed to a particular genetic difference.
Case-control subjects, where patients with the condition are matched with other individuals who do not have the condition, but match in other ways (eg, age, income, etc.), are enrolled in such studies because there can be no random assignment of subjects to treatment. Case-control subjects are selected such that affected and unaffected individuals are matched by characteristics in as many meaningful ways as possible (eg, age, gender, income, etc.). Because many tests are conducted in GWAS studies, ie, is there a difference between the control and affected group for the first gene, the second gene, and so on up to the number of genes on the microarray chip (10,000 or more genes), the chance that any particular association is a false positive is high, discussed further when we cover Risk Analysis in Chapter 7.
How to interpret a test result.
You are a medical doctor reading the results of a test for three-month average glycated hemoglobin, A1C, levels for your patient. For example, A1C above 6% is considered strong marker of diabetes. A marker, yes, but not the same as a guarantee that a person has diabetes. A false positive (FP) is the case where a test result is positive, but the subject in fact does not have the condition. False positive is equal to the ratio of

where FP is number of false positive readings and TN refers to the true negative, those who in fact do not have the condition.
In Chapter 7 we will spend some time on risk analysis. To introduce this important subject in biostatistics, we’ll begin with an example. A study of 15,934 subjects without diagnosed diabetes found 3.8% or 605 individuals had elevated A1C levels, or about 7.1 million adults not yet diagnosed with diabetes (Selvin et al 2011). About 90% of these individuals also had fasting glucose levels greater than 100 mg/dL, i., diabetic. This is clearly a good test. However, note that 10% of the 605 individuals had elevated A1C, but fasting glucose levels less than 100 mg/dl, ie, did not meet the diagnostic of type 2 diabetes. Thus, the false positive rate is about 0.4%, or nearly 30,000 adults with elevated A1C without diabetes.
Working through frequencies can be challenging, so applying a natural number approach helps. Having just read through the frequencies and percentages, now look at how they translate to probability tree (Fig. 2). Start by utilizing a per capita rate standard: for proportions in the 10 – 20% range, a standard 1000 persons works well (Fig. 2).
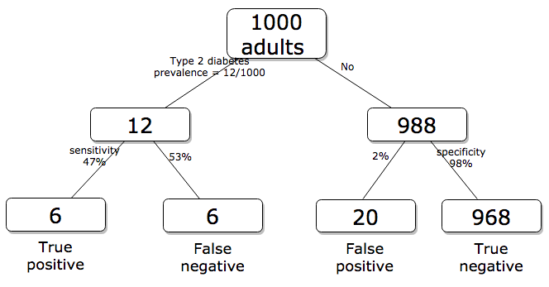
Figure 2. Probability tree diagram with prevalence of type 2 diabetes and sensitivity, specificity of A1C test, data from CDC and Selvin et al 2011. Tree drawn with free diagrams.net app.
How many expected to have A1C above 6%? Twenty-six total positives, only 23% are true positives. An important lesson is that if the prevalence of a condition is low, then any diagnostic test with high sensitivity necessarily will identify many false positives.
False discovery rate: claims must be stringently evaluated.
.
The genome scientists involved in GWAS studies generally are aware of false positives, also termed false discovery rate (FDR), conduct statistical corrections to account for false positives (eg, Brzyski et al 2016), and generally are cautious in their interpretation. But not always. Studies of associations between autism and environment come to mind (eg, Waldman et al 2008), and recent developments in the direct-to-consumer genetic testing market also suggest that the limitations of these kinds of studies are not always represented.
There is a broader concern about the reliability of research, and the debate about how to improve reliability comes from a call to understand how to do statistics better and, more importantly to understand how statistics are to be used in making claims from statistical results (Ioannidis 2007; but see Goodman and Greenland 2007). A key element of scientific work is that findings are repeatable: results from one group should apply to other groups. One dictate to improve reproducibility — increase number of subjects in studies — is obvious, but given the cost of GWAS, currently an unreasonable demand.
In some cases, biologists already have a particular gene in mind, whose function is more or less known, and then the exercise follows the Scientific Method listing much more directly. This bottom-up approach leads to a straightforward, testable genetic hypotheses: a specific difference in genomic sequence predicts a difference in phenotype outcome. A good example is the identification of more than 100 different single nucleotide mutations, called single nucleotide polymorphisms or SNPs, in the CFTR gene of patients known to have cystic fibrosis disease (Castellani 2013). As of August 2018, the number of known pathogenic or likely pathogenic SNPs is now listed at 440 in the SNP database; to put this in some context, there are more than 40,000 reported single nucleotide polymorphisms for the CFTR gene (this number includes SNP duplicates).
Projects and the data lifecycle.
A requirement for our biostatistics course, students are asked to design and implement a research project during the semester (Hydorn 2019). The project can either be part of an ongoing student research project or solely confined to the biostatistics course. The topics are diverse, ranging from observational to experimental to systematic reviews from the disciplines of biology, environmental science, and public health. Examples of project ideas implemented in the biostatistics and related courses at Chaminade University include:
- effects of environmental stress on growth rates.
- 2D and 3D shape analysis of mollusk shells.
- Individual variation and fluctuating asymmetry of plant leaves and flowers along an altitudinal gradient
- several systematic reviews (meta analysis) of published works of interest to public health
- vaccination benefits and risks.
- pain management of over the counter vs prescription medication.
- efficacy of “alternative medicine” approaches to health.
- comparisons of types of medical insurance on patient outcomes of knee replacement therapy.
The justification for the project learning activity is that it provides hands-on opportunity to apply statistical and data sciences concepts to real-world problems. Students work through the challenges of developing a research question, identifying testable hypotheses, designing a study, collecting data, performing analysis, and interpreting results. Importantly, students must decide for themselves which statistical tests and methods are most appropriate for their unique data, rather than simply following a formula presented in a lecture. This connects abstract statistical ideas to practical application, promoting a deeper, more lasting understanding. We manage the projects by encouraging a research lab community: students discuss with their peers their ideas, their data collection and experimental design challenges, with the instructor serving to guide and mentor the multiple projects and intervene as needed to steer student projects towards completion.
Throughout the semester we model the project approach. Students are encouraged to create a working folder on their computer, while dividing homework and other assignments into named projects. Students are also asked to address aspects of their project’s data life cycle (Borgman 2019, Ezer and Whitacker 2019, Griffin et al 2018). A quick Google search on the phrase returns millions of hits (see Note 1), but key elements of the concept are that projects have a beginning and an end, and it is helpful — and in the case of our statistics course, required — to address project management.
Note 1: For example, “8 Steps in the Data Life Cycle,” by Tim Tobierski of Harvard Business School.
BI-311 students, see Homework 1: Project data life cycle in Mike’s Workbook for Biostatistics.
Projects include data generation and collection, data processing, storage and data management, data exploration and visualization, interpretation and reporting. Thus, students need to develop a data management plan, which includes how data are collected, application of best practices to insure data file and storage of images, and how to share the project results. We ask students to develop 10-min research talks, which are presented and recorded, suitable for ePortfolio inclusion.
Conclusions.
.
Epistemology, the theory of how knowledge is acquired, is a complicated business – what I want you to appreciate now is that planned and unplanned comparisons affect interpretation of your statistical results, how the difference is likely also to affect the reproducibility of your work. In the language or clinical trials and experimental design, planned and unplanned accompany prospective and retrospective studies (Chapter 5). A prospective study in the case of GWAS means genetic differences among individuals are known at the start of the study, and phenotypic differences arise naturally during the course of the study. Knowing the strengths and limitations of, for example, a planned retrospective study is at the heart of experimental design (Chapter 5).
In the biostatistics course, students are required to design and carry out an independent research project that integrates statistical methods with real-world problems in biology, environmental science, or public health. The course emphasizes hands-on learning through the full research process—from formulating questions to data collection, analysis, and interpretation—while fostering a collaborative research lab environment. Students also learn project and data management skills and conclude by presenting their findings in recorded research talks suitable for inclusion in an ePortfolio.
Questions.
- Write up three learning outcomes for this page. Hint: Point your favorite generative AI to this page and ask for help.
- Above we described how GWAS studies are generally top-down; What would constitute a bottom-up approach to GWAS?
- In your own words provide pro and con points of view on data mining of large data sets.
- Create a stylized infographic, like a mind map, to illustrate the data life cycle for a one semester research project.
Quiz Chapter 2.5
Scientific method and where statistics fits
Chapter 2 contents
.