5.1 – Experiments
How to put an experiment together
With the background behind us, we outline a designed experiment. Readers may wish to review concepts presented previously, in
- Chapter 2.4: Experimental design and rise of statistics in medical research.
- Chapter 3.4 – Estimating parameters
- Chapter 3.5 – Statistics of error
Experiments have the following elements
- Define a reference population.
- All patients with similar angina symptoms — shortness of breath, chest pain, dizziness — but who have not suffered a heart attack, or myocardial infarction (Wu et al 2017);
- All adult frogs in a pond near industrial waste runoff (eg, Sowers et al 2009).
- Define sample unit from the reference population (eg, as many patients as can be screened by the physician are recruited; all frogs visible to the biologist are captured).
- Design sampling scheme from population (eg, random sampling vs. convenience/haphazard sampling).
- Agree on the primary outcome or endpoint to be measured and whether additional secondary outcomes are to be observed and collected.
- For the patients with similar symptoms, we follow
- For the frogs, we count adults with developmental malformations.
- Separate the sample into groups so that comparisons can be made
- We may be tempted to provide the same treatment and follow the group for improvement — that is the clinically valid approach; to be an experiment, we would use random assignment of individuals to one of two groups — half will receive a placebo, half will receive a beta blocker;,
- The frog example doesn’t follow this scheme — the event has already occured, it’s an observational study.
- Devise a way to exclude or distinguish from the possible explanations, or alternative hypotheses.
- eg, for the physician, she will record how many of her patients fail to respond to treatment;
- for the biologist, noting presence or absence of parasites between the normal and abnormal frog defines the groups).
Note 1: The studies cited are examples of work done on similar problems, they are not offered to evaluate or critique any research efforts that were done or described in these reports.
The frog study, as described by me for pedagological purposes, lacks any design elements that would allow for a test of the hypothesis that industrial runoff causes developmental malformations in frogs — I’m not saying or implying anything about the actual studies!
A basic experimental design looks like this.
- One treatment, with two levels (eg, a control group and an experimental group)
- A collection of individuals recruited from a defined population, esp. by random sampling.
- Random assignment of multiple individuals to one of the two treatment levels.
- The treatments are applied to each individual in the study.
- A measure of response (the primary outcome) and additional features (secondary outcomes) are recorded for each individual.
Of course, there are other considerations, and by now, students reading this text should be able to identify what is missing from the list. (See quiz questions.)
Contrast with design of observational studies
Importantly, for observational studies, no matter how sophisticated the equipment used to measure the outcome variable(s), key steps outlined above are missing. Researchers conducting observational studies do not control allocation of subjects to treatment groups (steps 4 and 3 in the two above lists, respectively). Instead, they may use case-control approaches, where individuals with (case) and without (control) the condition (eg, lung cancer) are compared with respect to some candidate risk factor (eg, smoking). Both case and control groups likely have members who smoke, but if there is an association between smoking and lung cancer, then more smokers will be in the case group compared to the control group.
A cohort study, also a form of observational study, is similar to case-control except that the outcome status is not known. A cohort study includes, in our example, smokers and non smokers who share other characteristics: age, medical history, etc. The other kind of design you will see is the cross-sectional study. Cross-sectional studies are descriptive studies, and, therefore also observational. Primary outcomes along with additional characteristics and outcomes are measured for a representative subsample, or perhaps even an entire population. Cross-sectional studies are used to absolute and relative risk rates. In ecology and evolutionary biology cross sectional studies are common, eg, comparisons of species for metabolic rate (Darveau et al 2005) or life history traits (Jennings et al 1998), and specialized statistical approaches that incorporate phylogenetic information about the species are now the hallmark of these kinds of studies.
A word on outcomes of an experiment. Experiments should be designed to address an important question. The outcomes the researcher measures should be directly related to the important question. Thus, in the design of clinical trials, researchers distinguish between primary and secondary outcomes or endpoints. In educational research the primary question is whether or not students exposed to different teaching styles (eg, lecture-style or active-learning approaches) score higher on an knowledge-content exams. The primary outcome would be the scores on the exams; many possible secondary outcomes might be collected including student’s attitudes towards the subject or perceptions on how much they have learned.
Note 3: While it’s logical to include secondary outcomes — they may offer support or complement the primary results — there needs to be caution in interpreting the test results of multiple secondary outcomes. By definition, the study is designed to test hypothesis about the primary or main outcome. While there are a number of concerns about testing secondary outcomes, from a statistical point of view, the study may lack the sample size — the power, see Chapter 11 — Power analysis — to test many additional hypotheses without the risk of increasing chance of false positives because of the multiple comparisons problem. We address this scenario in Chapter 12.1 – The need for ANOVA.
About Primary and Secondary Outcomes.
Consider a evolutionary physiology project on species differences and effects of body size on burst running speed of terrestrial lizards (eg, Bauwens et al 1995; Dohm et al 1998; Labonte et al 2024). Our independent variables, the things we believe influence running performance — and therefore we wish to control for — species, body size, core body temperature, body condition, race quality (see cited papers for these and other examples).
What do we measure? What are the likely primary vs. secondary outcomes for a this kind of project?
Primary outcomes are the direct, definitive measures of maximal locomotor performance. Examples may include
- Maximum Burst Speed: The absolute highest velocity achieved by the lizard over a short distance or time interval (eg, across a 0.5-meter interval).
- Maximum Acceleration: The highest rate of speed change during the start of the burst or during a sudden sprint increase.
- Stride Length: The physical distance covered during a single full stride cycle at maximum speed.
- Stride Frequency: The number of strides taken per second at maximum speed.
And what other measures may be of interest — secondary outcomes — those that may help explain why or how the primary performance metrics change across the independent variables. To list a few,
- Stance and Swing Duration: The individual time durations spent with feet on the ground (stance) vs. in the air (swing).
- Gait Transition Thresholds: The speed at which a lizard shifts from a walk/trot to a high-speed gallop or bipedal running (if applicable to the species).
- Fatigue Rate: The decline in burst speed across successive trials or over a sustained treadmill run.
- Trial-to-Trial Repeatability: The statistical consistency (intraclass correlation coefficient) of a lizard’s performance across multiple bursts.
In a prospective cohort study, we may track participants over time to observe how baseline factors predict the development or worsening of type 2 diabetes (eg, Gao et al 2026). Progression over a two year followup would be measured by incident clinical events or the longitudinal rate of change in biomarkers. Possible primary outcomes are
- Glycated Hemoglobin (HbA1c): A biomarker reflecting average blood glucose levels over the past 2 to 3 months (glycemic control).
- Fasting Plasma Glucose (FPG): Glucose concentration in the blood after an overnight fast (acute baseline glycemic regulation).
- T2D Complication Stage: A clinical score or categorization indicating the presence and severity of microvascular or macrovascular damage.
Secondary outcomes may include
- Fasting Lipid Profile
- C-Reactive Protein
- Body Mass Index
- Estimated Glomerular Filtration Rate
If one or more primary outcomes are significant, this reveals whether an intervention or exposure (like a vegan diet or income level) changes the clinical course of Type 2 Diabetes. Secondary outcomes are critical for explaining how and why it happens. Secondary outcomes provide mechanistic context.
Some caution is warranted — imagine if, after conducting the study, we find diet, age, or income did not statistically affect your primary outcome, but did significantly alter a secondary outcome (eg, improved lipid profiles). What to report? We state in your Abstract and Discussion that the study failed to meet its primary objective, and that any significant secondary findings are exploratory. We cannot claim that a diet “successfully manages diabetes progression” based solely on a secondary marker (cf discussion and suggsted guidelines in Butcher et al 2022).
Example of an experiment.
We’ll work through a familiar example. The researcher is given the task to design a study to test the efficacy in reducing tension headache symptoms by a new pain reliever. There are many possible outcomes: blurry vision, duration, frequency, nausea, need for and response to pain medication, and level of severity (Mayo Clinic). The drug is packaged in a capsule and a placebo is designed that contains all ingredients except the new drug. Forty subjects with headaches are randomly selected from a population of headache sufferers. All forty subjects sign the consent form and agree to be part of the study. The subjects also are informed that while they are participating in the research study on a new pain reliever, each subject has a 50-50 chance of receiving a placebo and not the new drug. The researcher then randomly assigns twenty of the subjects to receive the drug treatment and twenty to receive the placebo, places either a placebo pill of the treatment pill into a numbered envelope and gives the envelopes to a research partner. The partner then gives the envelopes to the patients. Both patients and the research partner are kept ignorant of the assignment to treatment.
We can summarize this most basic experimental design in a table, Table 1.
Table 1. Simple formulation of a 2X2 experiment (aka 2×2 contingency table).
| Did the subject get better? | ||||
|---|---|---|---|---|
| Yes | No | Row totals | ||
| Subject received the treatment |
Yes | a | b | a + b |
| No | c | d | c + d | |
| Column totals | a + c | b + d | N | |
where N is the total number of subjects, a is number of subjects who DID receive the treatment AND got better, c is number of subjects who DID NOT receive the treatment, but DID get better, b is number of subjects who DID receive the treatment and DID NOT get better, and d is number of subjects who DID NOT receive the treatment and DID NOT get better.
Note 4: We owe Karl Pearson (1904) for the concepts of contingency — that membership in a (or b, c, or d for that matter) is a deviation from any chance association or independent probability (Chapter 6) — and the contingency table. Contingency is an important concept in classification and is central to machine learning in data science (Michie et al 1995). We return at some length to contingency and how to analyze contingency tables in Chapter 7 and Chapter 9.2.
By convention, the standard format for an epidemiological 2×2 contingency table organizes exposure on the rows and disease outcome on the columns as follows:
- Rows (Exposure): The top row represents Exposed / Treatment (Yes), and the bottom row represents Non-exposed / Control (No).
- Columns (Outcome): The left column represents Disease / Case (Yes), and the right column represents No Disease / Control (No). See Chapter 7.
And our basic expectation is that we are testing whether or not treatment levels were associated with subjects “getting better” as measured on some scale.
One possible result of the experiment, although unlikely, all of the negative outcomes are found in the group that did not receive the treatment (Table 2).
Table 2. One possible outcome of our 2X2 experiment.
| Subject improved | |||
|---|---|---|---|
| Yes | No | ||
| Subject received the treatment |
Yes | 20 | 0 |
| No | 0 | 20 | |
Results of an experiment probably won’t be as clear as in Table 2. Treatments may be effective, but not everyone benefits. Thus, results like Table 3 may be more typical.
Table 3. A more likely outcome of our 2X2 experiment.
| Subject improved | |||
|---|---|---|---|
| Yes | No | ||
| Subject received the treatment |
Yes | 7 | 13 |
| No | 2 | 18 | |
Must a control group always be included in an experiment?
To be an experiment, yes. However, it is not true that the control treatment must only be applied to separate, individual subjects. For example, a common experimental design would be repeated measures of an outcome, like behavior (eg, feeding response) before and after an intervention is applied. Thus, the individual is its own control or reference point. For example, Dohm et al (2008) measured feeding and locomotor behavior of adult toads (Rhinella marina, formerly Bufo marinus) prior to and after ozone exposure. We concluded that a single 4-h exposure to O3 depressed toad feeding behavior, but had little effect on voluntary locomotor behavior. Typically, the design randomly assigns individuals to the treatments — some individuals get the exposure first, then the control exposure second; others, again selected at random, receive the control exposure first, then the active exposure.
The within subjects design is an important method in biological research; these designs offer control for individual differences as confounding variables and require fewer participants compared to separate control group designs. This design is effective provided there is little risk of carryover effects; if the effects of a previous condition linger, then it may influence a participant’s response in subsequent conditions, confounding the results. For our study (Dohm et al 2008) we used a modified within-subjects design by employing a split plot design. We return to within-subjects designs in Chapter 14.4 – Randomized block design.
Questions
- When I updated this page in 2020, we were in our fifth month of the coronavirus pandemic of 2019-2020. Daily it seemed, we heard news about “promising coronavirus treatments,” but no study had at the time been published that would meets our considerations for a proper experiment. However, on May 1, 2020, the FDA issued an emergency use authorization for use of the antiviral drug remdesivir (Gilead), based on early results of clinical trials reported 29 April in The Lancet (Wang et al 2020). Briefly, their study included 158 treated with does of the antiviral drug and 79 provided with a placebo control. Both groups were treated otherwise the same. Improvement over 28 days was recorded: 62 improved with Placebo and 133 improved receiving dose of remdesivir.
- Using the background described on this page, list the information needed to design a proper experiment. Using your list, review the work described in The Lancet article and check for evidence that the trial meets these requirements.
- Create a 2×2 table with the described results from The Lancet article.
- Consider our hazel tea and copper solution experiment described in Chapter 3. The outcome variables (Tail length, tail percentage, Olive moment) are quantitative, not categorical. Create a table to display the experimental design.
- For the migraine example, identify elements of the design that conform to the randomized control trial design described in Chapter 2.4.
Quiz Chapter 5.1
Experiments
Chapter 5 contents
2.4 – Experimental Design and rise of statistics in medical research
Experiments and observations: Finding answers.
.
How to identify cause and effect, and the kinds of evidence that can be inferred from the various approaches to study causes of disease has became a major source of disagreement in the news. In a fascinating study, Pew Research Center reported “half of U.S. adults under 50 say they get health and wellness information from social media influencers or podcasts,” and, only about 17% of these influencers report “conventional medicine” training (Report, May 7 2026). For our purposes, I made substantial updates to this page in the fifth month after WHO had declared the Covid-19 pandemic (CDC timeline), and continue to do so today.
The pandemic left many life-lessons, for scientists and public-health supporters, but also for everyone who lived through those times. One of the lessons was how to deal with the challenges of finding treatments in real time. If you followed the news early in the pandemic, you know of the appeal from some (including Donald Trump, the then-President of the United States, Boseley 2020), for use of an anti-parasite drug, hydroxychloroquine, as prophylactic or treatment for active Covid-19 infection (cf. Liu et al 2020). The FDA as well as other institutions rapidly advised against use, in part because experimental design concerns were raised for early studies (Kupferschmidt, 2020). The issue remains contentious for some (eg, Health and Human Services Secretary Robert F. Kennedy Jr., CNN August 2, 2026 interview).
Thus, job number one for students of biostatistics is to learn how to weigh arguments for or against therapies or treatments offered. The purpose of this page is to introduce these issues — how to judge whether a treatment is effective or not.
We will spend some time later on statistical aspects of experimental design (Chapter 5), but we begin with Randomized Control Trials, or RCT, as a model for our discussion of experimental studies. The RCT we recognize today owes its beginning to the 1948 studies on streptomycin use to treat tuberculosis (British Medical Research Council 1948), but of course, the foundations of RCT and experimental design in general, go back much earlier than that date (Chalmers 2011, Hairton and Locascio 2018). For a number of reasons the RCT — experimental, prospective, double-blind clinical trial with random selection of subjects from a reference population and random assignment of subjects to a treatment group or an appropriate placebo treatment control group — is considered the “gold standard” method for producing knowledge (Kaptchuk 2001, Hairton and Locascio 2018).
Note 1. I use the phrase “gold standard” associated with the RCT in the historical context intended by the authors cited. Unfortunately, in 2025, the phrase “gold standard science” has become political (Lewandowsky 2025, Mervis 2025). What we can agree on is characteristics of research as good science: “reproducible; transparent; communicative of error and uncertainty; collaborative and interdisciplinary; skeptical of its findings and assumptions; structured for falsifiability of hypotheses; subject to unbiased peer review; accepting of negative results as positive outcomes; and without conflicts of interest,” Sec. 3. Restoring Gold Standard Science, Presidential Executive Order, May 23, 2025. But even this list is not above scrutiny.
This discourse is way above my pay grade, but for starters, I would replace “without conflicts of interest” with “without disclosure of potential conflicts of interest.” The latter is practical, the former is likely not at all achievable. After all, even where a conflict exists, it does not immediately follow that the reported science is bad, that the conflict is evidence by itself of bias. Reporting conflicts warns the reader that results and conclusions may warrant further scrutiny, but outright dismissal is itself contrary to good science practice. Certainly, there are other aspects to defining what is and what is not good science. And, “gold standard” is just a metaphor (Love 2003), and, frankly, a very out-dated one. The United States and most other nations long ago gave up — for many good reasons — the gold standard as a monetary standard.
Technically, RCT are intervention trials, a specific application of the more general definition of an experiment. That is, the researchers tests a potential drug or therapy in people to observe its effect while holding other variables constant. Experimental studies imply that the researcher imposed treatments or controls onto subjects. The subjects are followed and outcomes are recorded. Thus, experiments by definition are also prospective studies — the outcome is recorded for subjects after some period of time. With a well-designed experiment, the researcher may have evidence to support the claim that, for example, Treatment A causes the outcome.
RCT applied to human health can have profound impact on lives.
The ALLHAT-LLT (JAMA, 2002) trial tested whether adding the cholesterol-lowering drug pravastatin to standard care would reduce heart attacks and deaths in people with high blood pressure and moderately high cholesterol. The study found no significant benefit compared to usual care, suggesting that statin therapy may not always provide extra protection in this group. Its results helped refine how doctors balance blood pressure and cholesterol treatment in heart disease prevention.
The Women’s Health Initiative (JAMA, 2002) trial tested the effects of combined estrogen and progestin therapy in healthy postmenopausal women. It found that while the therapy slightly reduced the risk of fractures and colon cancer, it increased the risk of heart disease, stroke, and breast cancer. These results transformed medical guidance by showing that hormone therapy should not be routinely used to prevent chronic disease in postmenopausal women.
The Du Toit et al. (NEJM, 2015) study showed that introducing peanut-containing foods early in life — rather than avoiding them — greatly reduced the risk of developing peanut allergies in high-risk infants. This landmark randomized trial changed how doctors think about food allergies, leading to new guidelines that encourage early introduction instead of avoidance.
And more recently, we have study reported by Deanfield et al (Lancet, 2025), which found that semaglutide reduced the risk of major adverse cardiovascular events (MACE) in adults with overweight or obesity and established cardiovascular disease—even if they did not lose much weight or had lower baseline adiposity.
In contrast, observational studies are those in which treatments arise by acts of nature. In both experiments and observational studies, there can be treatment and control groups; the distinction between the types of studies is how assignment of subjects to treatments were affected. Observational studies generally are retrospective studies — the outcome has already occurred, the researcher follows up to identify differences among the groups that may account for different outcomes. Examples of observational, retrospective study designs include cross-sectional and case control; cohort studies are prospective studies. Observational studies are discussed further in Chapter 5.4 – Clinical trials.
Compared to observational studies, in principle, experiments can establish cause and effect. Cause and effect refers to an explanation about relationship between two events or objects. In biology, Ernst Mayr (1904 – 2005) distinguished between two levels of explanation, proximate (how) explanations and ultimate (why) explanations (Mayr 1961, cf. Laland et al. 2011). As you know, our mechanism for identifying cause and effect is application of the Scientific Method (Chapter 2.5). Discussions of how to detect cause and effect are provided throughout this book, but emphasized in a few sections (Chapter 16.2 and 16.3).
Good experiments.
The principles of good experiments include many steps beyond simply choosing treatments and controls. In Chapter 5 we’ll go into more depth, but I wished to list for you some of the key principles of good experimental design. With respect to human-subject research, the researcher needs to protect against many sources of potential bias.
- Randomization of subjects assigned to treatment groups controls for individual differences.
- Controls (eg, Placebos) are a means to establish controls in a study so that effects may be attributed to the active treatment.
- Single-blind implies that the subject does not know what treatment was given.
- Double-blind implies that not only is the subject unaware of the treatment received, but, crucially, neither does the researcher.
- The double-blind design — neither the patient-subject nor the researchers know who received the placebo or the treatment — controls for subtle biases.
Note 2. Experimental control implies researcher imposes conditions to remove possibly confounding effects on the dependent variable — outcome of the experiment. Placebo, derived from Latin placere, to please (but see Aronson 1999). Placebo refers to an inert substance (“sugar pill”), or to a substance with known activity but without effect on the target condition or “wrong indication” (eg, antibiotics administered for viral infection), given to research subjects in lieu of the active treatment of interest (the hypothesis). Thus, placebos are examples of treatment controls.
The placebo effect is improvement of subjects who received the placebo and not active treatment (Pardo-Cabello et al 2022). In contrast, nocebo effects are adverse effects attributed to placebo treatment. Under most circumstances, placebo applies to humans only because placebo effects are thought to be product of psychological factors, although mechanisms of action are in dispute. Is sentience necessary for a placebo effect (cf. McMillan 1999)?
The experimenter may influence the outcome of the experiment if knowledge about who received the placebo or the new drug; the subject may respond differently with knowledge that they received the placebo and not the new drug. The key intent in this experimental design is to avoid systematic error, errors in studies that may occur because of our conscious and unconscious beliefs and biases. Placebos are used as treatments because people (and animals!) sometimes get better (or worse) with or without treatment; thus, to be effective, subjects receiving a new drug must get better more frequently than do subjects on placebo. Importantly, the well-designed placebo allows the researcher to gain insight into the mechanism of action by the new drug.
A case to consider: Comparing migraine treatments.
.
Consider the following experiment (Diener et al 2006; see also Liu et al 2018): subjects who had several migraines per month were treated with acupuncture, sham-acupuncture, or standard treatments including beta blockers, calcium channel blockers, or antiepileptic drugs. After 26 weeks the reductions in reported migraines was compared. The authors reported that there was no difference in numbers of migraines among patients who received the different therapy treatments. The authors conclude that because acupuncture lacks side-effects that may occur with standard therapies acupuncture may be a good choice for patients seeking relief from migraine. This is a classic experiment — subjects were assigned to treatments by the researchers. At least in principle, if one treatment group showed better outcomes, the improvement could be attributed to the treatment.
Another case to consider: When the cause isn’t clear.
.
Consider the following example. My dad was diagnosed with lung cancer in his late 70s; his left lung showed many spots when imaged and biopsy confirmed. Surgeons removed half of the lung and after several years he was considered cancer free. Why did he develop cancer in the first place? If you immediately think, “He’s a smoker,” that’s not a good explanation — and shame on you, you’re first instinct was to blame the patient (see discussion in Huff 2013). Dad last smoked tobacco in his early thirties (latency smoking-lung cancer link about 20 years, Lipfert et al 2019).
Tobacco smoking is not the only environmental trigger for lung cancer. Cancer of the lung in non-smokers is the seventh leading cause of cancer mortality worldwide (Field and Withers 2012). Long term exposure to radon gas, a naturally occurring, radioactive noble gas has been linked to lung cancer (EPA). I grew up on Vashon Island, Washington, in a non-smoking home environment. Radon levels on Vashon Island and other areas around Puget Sound are low (source: Washington State Department of Health). Radon is out as an explanation.
What other environmental sources may be linked to cancer? Vashon Island is rural, but, as it turned out, within range of effluent from a copper smelter located in nearby Ruston, Pierce County (Fig 1; my home was 17 km distance from the smelter).
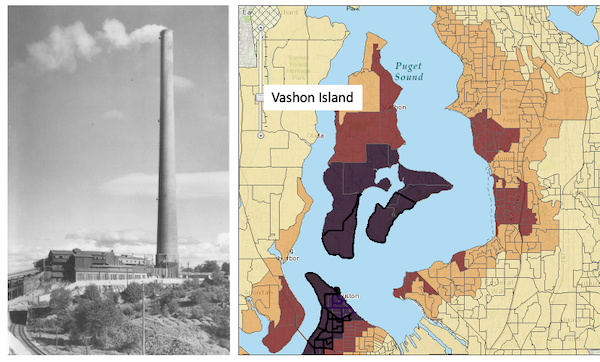
Figure 1. Left: ASARCO smelter, Ruston, Washington, image from Department of Ecology, State of Washington. Direction of smoke from the stack is north, toward Vashon Island. Right: Voronoi map of arsenic and lead affected areas. image from kingcounty.gov. Darker regions correspond to heavier arsenic and lead contamination of soils.
The smelter was last in operation in 1986 and was torn down in 1993 (EPA publication number 910R94001). The smelter stack rose more than 500 feet dispersing smoke laden with heavy metals, notably inorganic arsenic and lead, into the air (Bromenshenk et al. 1985). Over the smelter’s 68 years of service, winds carried away the smoke to my island and to other areas known now as the “Ruston-Vashon Island Exposure Pathway” (Kalman et al 1990). The former smelter site was among the first listed Superfund sites (1983) in the United States by the EPA. Thus, tens of thousands of people were (and continue to be) exposed to the heavy metals deposited into the soils, forming a distinct exposure group (Milham & Strong 1974; Kalman et al 1990; EPA 2000). Arsenic exposure can be via inhalation, skin, or in drinking water — areas of Vashon-Maury island continue to have high levels of arsenic in both the soil and in any domestic water wells (PublicationNo. 14-09-044, Department of Ecology State of Washington).
Note 3: A personal comment — I stumbled onto the article by Bromenshenk and colleagues by accident. Instead of attending lecture, as I often did at the time, I was looking through journals in the research library. I was shocked at this article, because for the first time, I connected the smelter to the island I grew up on. The contamination on the island just wasn’t a conversation.
Is arsenic exposure by inhalation a plausible mechanism for my Dad’s lung cancer? As shown in Fig 1, the soils on Vashon near my home were heavily impacted by the smelter. Exposure could have come about from exposure during routine yard work — I have memories of clouds of dust kicked up by the lawn mower during spring and summers. Thus, an exposure route is possible. What evidence can we come up with?
Figure 2A shows negative association between lung and bronchial cancer incidence rates per 100L persons, adjusted for age, for several Washington state counties between 2000 and 2020 and distance from the smelter in Ruston. For comparison, Figure 2B shows no association between bladder cancer incidence rates per 100K for the same counties and time period and distance from the smelter. Workers exposed to arsenic have higher rates of lung cancer (Sullivan 2007, Wei et al 2019; see Enterline et al 1987 for a study a study based on cancer of workers at the smelter). Cultured lung cells exposed to arsenic associated with changes in gene expression (Clancy et al 2012). Coincidently, two of the family dogs developed and died of cancer as did one female goat. Perhaps my dad’s lung cancer was attributed to long exposure to arsenic (a decade after the cancer, and long after he stopped with yard work, his blood readings for arsenic were in the range of a modest 11 μg/L).
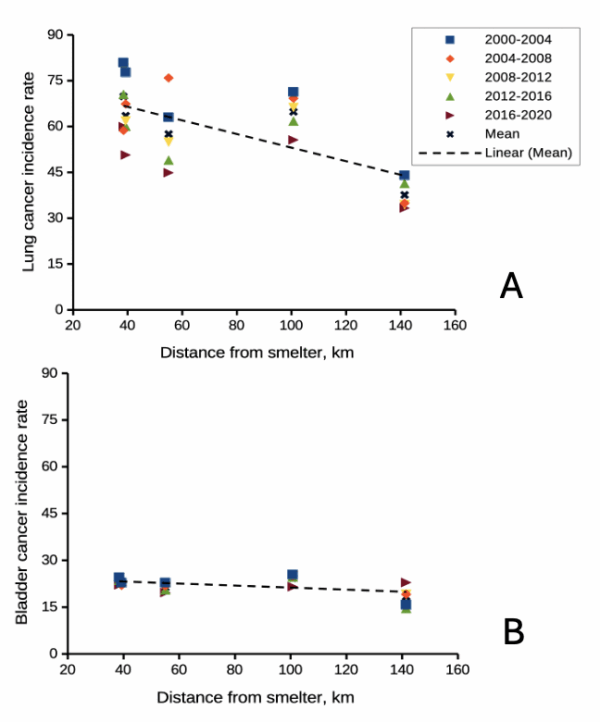
Figure 2. County cancer rates (A, lung and bronchial; B, bladder) from 2000 – 2020 vs distance in kilometers from ASARCO smelter, Ruston, WA. Data compiled from Washington Tracking Network (WTN). The counties were King (55 km), Kitsap (39.28 km), Pierce (38.48 km), San Juan ( 141.43 km), Snohomish (100.73 km), and Spokane (385.34 km).
If this scenario seems plausible, I hope you immediately recognize it as a case of confirmation bias (see Chapter 2.6). Putting aside for a moment the different arsenic species, each with different LD50 (the lethal dose needed to kill half the population — see Chapter 20.10), the difficulty ascribing arsenic as a causal agent for my Dad’s cancer is that many other exposures happened simultaneously. For example, indoor carpets are a primary source of several volatile organic compounds (Haines et al 2020). Prior to 1980 carpets may have included formaldehyde and other known carcinogenic agents. Dad commuted by car between work and home — with a ferry ride between — for decades (until the early 1990s), routinely traveling heavily congested roadways, this during the years prior to and the early years of the Clean Air Act of Environmental Protection Agency of the United States (it wasn’t until 1981 that new cars met EPA emission standards: Clean Air Act timeline here). Thus, all commuters including my Dad were exposed to gasoline combustion emissions, many known to be carcinogenic (Parent et al 2007). Moreover, a limited study by Public Health of Seattle and King County (2001) found rates of cancer on Vashon between 1980 and 1988 were similar to other areas in King County.
Summary.
It’s easy to fall into the trap that experiments — and by extension meta-analysis and systematic reviews — are the best tools offered by science for developing knowledge about the world, and other approaches suffer by comparison. But after even a bit of reflection, we should recognize that it can’t be that simple. While we now “know” tobacco cigarette smoking increases lung cancer risk, and many experiments with animal models convincingly show the link (eg, Hutt et al 2005), no human experiment in the strict sense, ie, prospective, randomized control trial, has ever been conducted (hint: it would be unethical, see discussion in Allmark and Tod 2016). Instead, the accumulated evidence from observational studies on exposures of different populations over the years overwhelmingly points to smoking as a leading risk factor (cause) of lung and other cancers — an example of Hill’s guidelines of causality. We end with a quote:
RCTs can play a role in building scientific knowledge and useful predictions but they can only do so as part of a cumulative program, combining with other methods, including conceptual and theoretical development, to discover not ‘what works’, but ‘why things work’ (p 2, Deaton and Cartwright 2017).
Questions.
.
- Write up three learning outcomes for this page. Hint: Point your favorite generative AI to this page and ask for help.
- Was my Dad’s lung cancer attributable to his 40 years plus exposure to soil arsenic (he’s a non-smoker)? How should we approach this question?
- In Diener et al (2006), the authors concluded that because acupuncture lacks side-effects that may occur with standard therapies acupuncture may be a good choice for patients seeking relief from migraine. Do you agree with the authors?
- Ethical standards evolve with time. An ongoing debate in research is whether and how placebos are to be used in human subjects research. Placebos are a means to establish controls in a study so that effects may be attributed to the active treatment. The “gold standard” of clinical trials is considered to be the randomized double-blind design — neither the patient-subject nor the researchers know who receives the placebo or the treatment. Following review of the WHO report on Use of Placebos in Vaccine Trials, pick one study and evaluate whether or not the decision to use placebos was warranted in your opinion.
- I searched PUBMED for “double-blind” by decade and found the following results (August 2018) (Table 1). Open R and/or R Commander and create two variables, then generate a scatter plot. Describe the shape of the relationship between number of publications citing “double-blind” and time (eg, 1950 – 1959, 1960 – 1969, and so on).
| Decade | Publications |
|---|---|
| 1950 | 60 |
| 1960 | 995 |
| 1970 | 7184 |
| 1980 | 24737 |
| 1990 | 39643 |
| 2000 | 53965 |
| 2010 | 69265 |
- Here’s one way to enter this data into R. At the R prompt (or in the R Script window of R Commander), create two variables,
DecadeandPubsDecade <- c(seq(1950, 2020, by=10))Pubs <- c(59,995,7161,24728,39670,54011,57043)Make an XY scatter plotplot(Decade,Pubs) - Repeat the PUBMED search as above but search for “placebo”. Make a table like the one above and provide a scatterplot of your results.
- Is the concept of a placebo relevant if the subjects in your experiment are yeast cells, not humans?
- Similarly, if your subjects are yeast cells, how does the concept of performing experiments “blind” apply?
- Ethical standards change with time. An ongoing debate in research is whether and how placebos are to be used in human subjects research.
- If placebos are so important, why is their use a concern in clinical trials?
- Following review of the WHO report on Use of Placebos in Vaccine Trials (see Readings below), pick one study and evaluate whether or not the decision to use placebos was warranted in your opinion.
R notes for question 5:
<-is an assignment operator (assignOP); everything to the right of<-is assigned to the object named to the left of the<-operator. You can instead use=in place of<-, but because=is also used in other contexts besides assignment, a quick look at blogs by data scientists will find a preference to use<-for clarity and consistency.c()“combines” arguments into a vector.seq()is used to generate a sequence of numbers between a lower and an upper limit; ifby = nis included, the sequence will be increased by the value n. If omitted, then the sequence is increased by 1.
Quiz Chapter 2.4
Chapter 2 contents.
.
- Introduction
- Why biostatistics?
- Why do we use R Software?
- A brief history of (bio)statistics
- Experimental Design and rise of statistics in medical research
- Scientific method and where statistics fits
- Statistical reasoning
- Chapter 2 – References and suggested reading