6.7 – Normal distribution and the normal deviate (Z)
Introduction
In chapter 3.3 we introduced the normal distribution and the Z score, aka normal deviate, as part of a discussion about how some knowledge about characteristics of the dispersion of our data sampled from a population could be used to calculate how many samples we need (the empirical rule). We introduced Chebyshev’s inequality as a general approach to this problem, where little is known about the distribution of the population and contrasted it with the Z score, for cases where the distribution is known to be Gaussian or the normal distribution. The normal distribution is one of the most important distributions in classical statistics. All normal distributions are bell-shaped and symmetric about the mean. To describe a normal distribution only two parameters are needed: the population mean, μ, and the population standard deviation, σ. The normal distribution with mean equal to zero and standard deviation equal to one is called the standard normal, or Z distribution. With use of the Z score any normal distribution can be quickly converted to the standard normal distribution.
Proportions of a Normal Distribution
This concept will become increasingly important for the many statistical tests we will learn over the next few weeks. What is the proportion of the populations that is greater than some specific value? Below (Fig 1), again, I have generated a large data set, now with population mean µ = 5 and σ = 2. The red line corresponds to the equation of the normal curve using our values of µ = 5 and σ = 2.

Figure 1. Frequency of observations expected to be greater than 7 (red bars) from a large population with mean µ = 5 and σ = 2.
R code for Fig 1.
set.seed(123)
myData <- rnorm(1000, mean = 5, sd = 2)
h <- hist(myData, breaks = 20, plot = FALSE)
threshold <- 7
# Bars with midpoints greater than threshold will be "red",
# and others will be "white."
bar_colors <- ifelse(h$mids > threshold, "red", "white")
plot(h, col = bar_colors, xlab = "Value", ylab = "Frequency")
Note that this is a crucial step! We assume that our sample distribution is really a sample from a population density (= “area under the curve”) function (= “an equation”) for a normal random (= “population”) variable.
Once I (you) make this assumption, then we have powerful and easy to use tools at our command to answer questions like
Question: What proportion of the population is greater than 7 (Fig 1, colored in red)?
This gets to the heart of the often-asked question, How many samples should I measure? If we know something about the mean and the variability, then we can predict how many samples will be of a particular kind. Let’s solve the problem.
The Z score
We could use the formula for the normal curve (and a lot of repetitions), but fortunately, some folks have provided tables that short-cut this procedure. R and other programs also can find these numbers because the formulas are “built in” to the base packages. First, let’s introduce a simple formula that lets us standardize our population numbers so that we can use established tables of probabilities for the normal distribution.
Below, we will see how to use Rcmdr for these kinds of problems.
However, it’s one of the basic tasks in statistics that you should be able to do by hand. We’ll use the Z score as a way to take advantage of known properties of the standard normal curve.
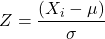
Z = 1 (with the mean and SD). Z (say “Z-score”) is called the normal deviate (aka “standard normal score”; it is also called the “Z-score”); it gives us a shortcut for finding the proportion of data greater than 7 in this case).
We use the normal deviate to do a couple of things; one use is to standardize a sample of observations so that they have a mean of zero and a standard deviation of one (the Z distribution). The data would then said to have been normalized.
The second use is to make predictions about how often a particular observation is likely to be encountered. As you can imagine, this last use is very helpful for designing an experiment — if we need to see a specified difference, we can conduct a pilot study (or refer to the literature) to determine a mean and level of variability for our observation of choice, plug these back into the normal equation and predict how likely we can expect to see a particular difference. In other words, this is one way to answer that question — how many observations need I make for my experiment to be valid?
Table of normal distribution
A portion of the table of the normal curve is provided at our web site and in your workbook. For our discussions, here’s another copy to look at (Fig 2).
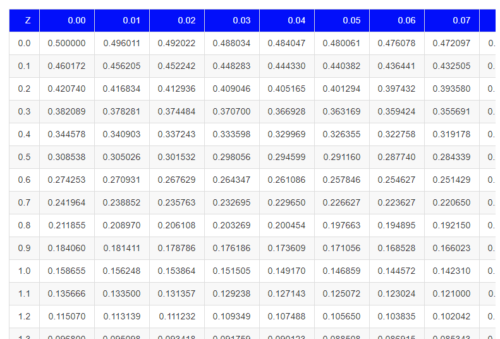
Figure 2. Portion of the table of the normal distribution. Only values equal to or greater than Z = 0 are visible.
See Table 1 in the Appendix for a full version of the normal table.
We read values of Z from the first column and the first row. For Z = 0.23 we would scan the top row, scoot over to fourth column, then trace to where the row and column intersect (Fig 3); the frequency of occurrence of values at Z = 0.23 is 0.409046 or 40.9% (Fig 3).
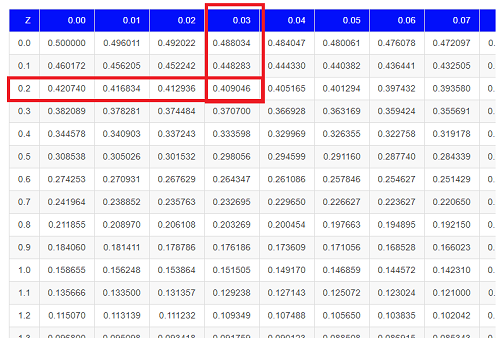
Figure 3. Highlight Z = 0.23, frequency is 0.409046.
Z on the standard normal table is going to range between -4 and +4, with Z = 0 corresponding to 0.500. The Normal table values are symmetrical about the mean of zero.
What to make of the values of Z, from -4, -3, … +2, +3, up to +4 and beyond? These are the standard deviations! Recall that using the Z score you corrected to mean of zero (got it!), and a standard deviation of one! A Z of 2 is twice the standard deviation; a Z = 3 is therefore three times the standard deviation, and so forth. The distribution is symmetrical: you get the same frequency for negative as for positive values. So on the “X” axis on a standard normal distribution, we have units of standard deviation plus (greater) or minus (less) than the mean. In Figure 4, area less than -1 standard deviations is highlighted (Fig 4).
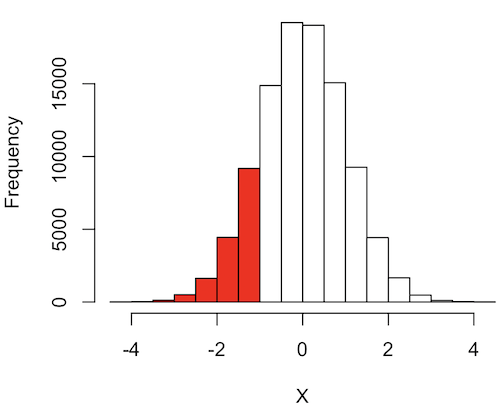
Figure 4. Plot of standard normal distribution; area less than -1 σ.
R code for Fig 4.
set.seed(123)
myData2 <- rnorm(100000, mean = 0, sd = 1)
threshold <- -1
bar_colors <- ifelse(h$mids < threshold, "red", "white")
# Additional code used, same as Figure 1.
Question. How many multiples of standard deviations would you have for a Z score of Z = 1.75?
Answer = 1.75 times
Examples
See Table 1 in the Appendix for a full version of the normal table as you read this section.
What proportion of the data set will have values greater than 7? After applying our Z score equation, I get Z = 1.0 and for a Z of 1.0 = 0.1587 or 15.87% of the observations are greater than 7.
What proportion of the data set will have values less than -7? After applying our Z score equation, I get Z = -1.0. Taking advantage of symmetry argument, I just take my Z = -1.0 and make it positive — instead of values smaller than -1.0 we now have values greater than +1.0. And for a Z of 1.0 = 0.1587 or 15.87% of the observations are greater than 7, which means that 15.87% will be -7 or smaller.
What proportion of the data set will have values greater than 8? Again, apply the Z score equation I get Z of 1.5 = 0.0668 or 6.68% of the observations are greater than Z.
What proportion of the population is between 5 and 7 ? (colored in red). Draw the problem (example shown in Fig 5).
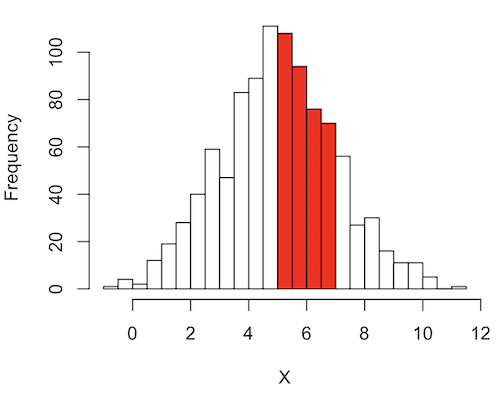
Figure 5. Proportion of the population is between 5 and 7.
R code for Fig 5.
# Used myData from Fig 1 code.
highlight_start <- 5
highlight_end <- 7
bar_colors <- rep("white", length(h$counts))
bar_colors[h$breaks[-length(h$breaks)] >= highlight_start & h$breaks[-1] <= highlight_end] <- "red"
# Additional code used, same as Figure 1.
Note 1: h$breaks[-length(h$breaks)] gives the left edges of the bins, and h$breaks[-1] gives the right edges.
Worked problem
1 – (proportion beyond 7) – (proportion less than 5)
1 – (0.1587) – (proportion less than 5)
And the proportion less than 5?
Use Z-score equation again. Now we find that
Z = 0
And look up Z of 0 from the table = 0.5 proportion or 50.0%
Therefore, the proportion between 5 & 7 equals
1 -0.1587 – 0.50 = 0.3413
Answer = 34.13 % of the observations are between 5 and 7 when the mean µ = 5 and s = 2.
Questions
Several questions were asked in the text.
1. Proportion of observations greater than 7 from a large population with mean µ = 5 and σ = 2.
2. How many multiples of standard deviations would you have for a Z score of Z = 1.75?
3.
Quiz Chapter 6.7
Normal distribution questions
Chapter 6 contents
- Introduction
- Some preliminaries
- Ratios and probabilities
- Combinations and permutations
- Types of probability
- Discrete probability distributions
- Continuous distributions
- Normal distribution and the normal deviate (Z)
- Moments
- Chi-square (Χ2) distribution
- t distribution
- F distribution
- References and suggested readings
6.6 – Continuous distributions
Large numbers and the Central Limit Theorem
Imagine we’ve collected (sampled) data from a population and now want to summarize the data sample. How do we proceed? A good starting point is to plot the data in a histogram and note the shape of the sample distribution. Not to get too far ahead of ourselves here, but much of the classical inferential statistics demands that we are able to assume that the sampled values come from a certain kind of distribution called the normal, or Gaussian distribution.
Consider a random sample drawn from a normally distributed population of the following series of graphs, Figures 1 – 4:
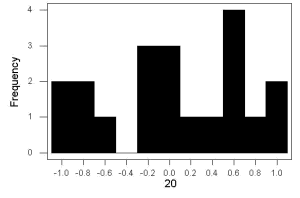
Figure 1. Sample size = 20, drawn from population with known μ = 0 and σ = 1.
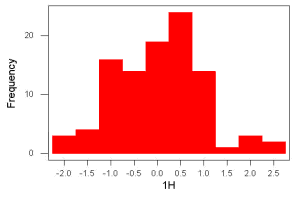
Figure 2. Sample size = 100, also drawn from population with known μ = 0 and σ = 1.
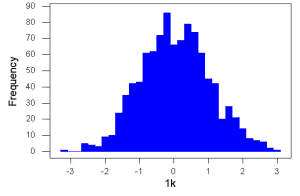
Figure 3. Sample size n = 1000, once again drawn from population with known μ = 0 and σ = 1.
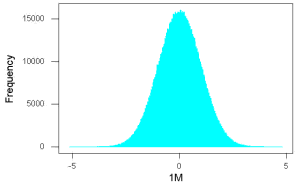
Figure 4. And lastly, sample size n = 1 million also drawn from population with known μ = 0 and σ = 1.
These graphs illustrate a fundamental point in statistics: for many kinds of measurements in biology, the more data you sample, the more likely the data will approach a normal distribution. This series of simulations was a quick and dirty “proof” of the Central Limit Theorem, which is one of the two fundamental theorems of probability, the other being that of Law of Large Numbers (ie, large-sample statistics). Basically the CLT says that for a large number of random samples, the sample mean will approach the population mean, μ, and the sample variance will approach the population variance σ2; the distribution of the large sample will converge on the normal distribution.
As the sample size gets bigger and bigger, the resulting sample means and standard deviations get closer and closer to the true value (remember — I TOLD the program to grab numbers from the Z distribution with a mean of zero and standard deviation = 1), obeying the Law of Large Numbers.
Simulation
I used the computer to generate sample data from a population. This process is called a simulation. R can make new data sets by sampling from known populations with specified distribution properties that we determine in advance — a very powerful tool — a technique used for many kinds of statistics (eg, Monte Carlo methods, bootstrapping, etc., see Chapter 19).
Note 1: How I got the data. All of these data are from a simulation where I asked told R, “grab random numbers from an infinitely large population, with mean = 0 and standard deviation = 1.”
- The first graph is for a sample of 20 points;
- the second for 100;
- the third for 1,000;
- and lastly, 1 million points.
To generate a sample from a normal population, the Rcmdr call the menu by selecting:
Rcmdr: Distributions → Continuous distributions → Normal distribution → Sample from normal distribution…
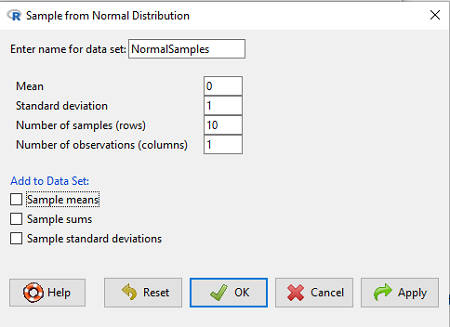
Figure 5. Screenshot Rcmdr menu, sample from a normal distribution.
The menu pops up. I entered Mean (μ) = 0 and Standard deviation (σ) = 1 number of samples = 10, unchecked all boxes under the “add to data set.” I left the object name as “NormalSamples,” you can, of course, change it as needed. R code derived from these requests were
normalityTest(~obs, test="shapiro.test", data=NormalSamples)
NormalSamples <- as.data.frame(matrix(rnorm(10*1, mean=0, sd=1), ncol=1))
rownames(NormalSamples) <- paste("sample", 1:10, sep="")
colnames(NormalSamples) <- "obs"
This results in a new data.frame called NormalSamples with a single variable called obs.
Note 2: About pseudorandom number generator, PRNG. An algorithm is used for creating a sequence of numbers that are like random numbers. We say “like” or “pseudo” random numbers because the algorithm requires a starting number called the seed, rather than a truly random process, ie, a source of entropy outside of the computer. The default PRNG algorithm in base R is Mersenne Twister (Wikipedia), though there are many others included in base R (bring up the help menu by typing ?RNGkind at the prompt), as well as other packages, like random, which can be used to generate truly random numbers (source of entropy is “atmospheric noise,” per citation in the package, see also random.org).
rnorm() was the function used to sample from a normal distribution. If you run the function over and over again (eg, use a for loop), each time you will get different samples. For example, results from three runs
for (i in 1:3){
print(rnorm(5))
}
[1] -0.4221672 -1.4317800 -1.8310352 0.4181184 -1.1596058
[1] -0.2034944 1.1809083 1.5925296 -2.0763677 1.6982357
[1] -1.0967218 -0.3205041 -1.7513838 -0.3335311 -1.8808454
However, if you set the seed to the same number before calling rnorm, you’ll get the same sampled numbers.
for (i in 1:3){
set.seed(1)
print(rnorm(5))
}
[1] -0.6264538 0.1836433 -0.8356286 1.5952808 0.3295078
[1] -0.6264538 0.1836433 -0.8356286 1.5952808 0.3295078
[1] -0.6264538 0.1836433 -0.8356286 1.5952808 0.3295078
The seed number can be any number, it does not have to equal 1.
After creating a sample of numbers drawn from the normal distribution, make a histogram, Rcmdr: Graphs → Histogram… (see Chapter 4.2).
The normal distribution
More on the importance of normal curves in a moment. Sometimes people call these “bell-shaped” curves. You may also see such distributions referred to as Gaussian Distributions, but the normal curve is but one of many Gaussian -type distributions. Moreover, not all “bell-shaped” curves are NORMAL. For a distribution to be “normally distributed” it must follow a specific formula.
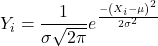
This formula has a lot of parts, but once we break down the parts, we’ll see that there is just two things to know. First, let’s identify the parts of the equation:
 is the height of the curve (normal density)
 (pie) is a constant = 3.14159… (R, use
pi)
µ is the population mean
σ2 is the population variance
σ is the square-root of the variance or the population standard deviation
e is the natural logarithm (R, use exp())
 is the individual’s value
Why the Normal distribution is so important in classical statistics
With these distinctions out of the way, the first important message about the normal curve is that it permits us to say how likely (ie, how probable) is a particular value if the observation comes from a population with mean µ and standard deviation σ and the population from which the sample was drawn came from a normal distribution.
The second message: all we need to know to recreate the normal distribution for a set of data is the mean and the variance (or the standard deviation) for the population!! With just these two parameters, we can then determine the expected proportion of observations expected for each value of X. Note — we generally do not know these two because they are population parameters: we must estimate them from samples, using our sample statistics, and that’s where the first big assumption in conducting statistical analyses comes into play!!
An example for calculating the normal distribution when knowing the mean and variance
µ = 5, σ2 = 10 (thus, the standard deviation, σ = 3.16)
The formula becomes
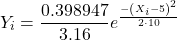
Now, plug in different values of X (for example, what’s the probability that a value of X could be 0, 1, 2, …, 10? If we really do have a normal curve with mean = 5, and variance = 10).
The normal equation returns the proportion of observations in a normal population for each X value:
When i = 5 Y5 = 0.12616 This is the proportion of all data points that have an X = 5 When i = 1 Y1 = 0.019995 This is the proportion of all data points that have an X = 1
We can keep going, getting the proportion expected for each value of X, then make the plot (Fig 6).
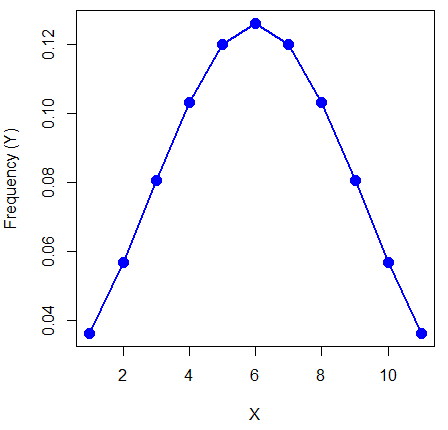
Figure 6. Frequency expected for a few points (X: 0 – 10) drawn from a normal distribution, calculated using the formula and example values.
Here’s the R code for the plot
X = seq(0,10, by=1)
Y = (0.398947/3.16)*exp((-1*(X-5)^2)/20)
plot(Y~X, ylab="Frequency (Y)", cex=1.5, pch=19,col="blue")
lines(X,Y, col="blue", lwd=2)
Next up, more about the normal distribution, Chapter 6.7.
Questions
- For a mean of 0 and standard deviation of 1, apply the equation for the normal curve for X = (-4, -3.5, -3, -2.5, -2, -1.5, -1, -0.5, 0, 0.5, 1, 1.5, 2, 2.5, 3, 3.5, 4). Plot your results.
- Sample from a normal distribution with different sample size, means, and standard deviations, each time make a histogram and compare the shape of the histograms.
- For a subset of
Quiz Chapter 6.6
Continuous distributions
Chapter 6 contents
- Introduction
- Some preliminaries
- Ratios and proportions
- Combinations and permutations
- Types of probability
- Discrete probability distributions
- Continuous distributions
- Normal distribution and the normal deviate
- Moments
- Chi-square distribution
- t distribution
- F distribution
- References and suggested readings