18.4 – Generalized Linear Squares
Introduction
With access to powerful computers and better algorithms, we can move past the classical ANOVA and ordinary least squares approaches to linear models. We have discussed general linear models, but here we introduce generalized linear models, GLM, not to be confused with the general linear model introduced in Chapter 12.7.
The GLM is an extension or generalization of the general linear model, which assumes the outcome variable comes from a normal distribution. The chief advantage of GLM approaches is that we no longer need to make assumptions about the error variance, for example — now, we can specify the model structure and account for correlated errors and other deviations.
When you run a standard statistical model, it assumes every single data point is completely independent. But in real-world biology and ecology, data points are often connected (correlated). GLS allows us to specify the kind of correlation. Three correlation structures are
- Autoregressive (AR) Structure, eg, for Time Series: Things that happen close together in time are more similar than things far apart. As time steps grow farther apart, the correlation drops off exponentially. For example, use
weights = varPower(form = ~ Time)in thegls()function. - Compound Symmetry (CS) Structure, eg, for repeated measures: Every data point collected from the same individual or same group shares an equal amount of baseline relatedness, no matter when or where it was measured. R applies a single, constant correlation penalty between all data points that share the same grouping variable. For example, use
weights = varIdent(form = ~ 1 | Week)in thegls()function. - Spatial Correlation (SC) Structure, eg, for location-based data: Things that are physically close to each other in space are more similar than things far apart (known as Tobler’s First Law of Geography). R can use actual GPS or X-Y coordinates. The model automatically calculates the physical distance between your samples and assumes that closer samples naturally share a higher correlation. For example, use
weights = varExp(form = ~ X_Coordinate)in thegls()function. - The Variance Structure (“The Bounce”) for unequal scatter: Different groups have different amounts of natural variation or unpredictability. One group is highly stable, while another is wild and scattered. You tell the model to stop forcing a single “average” standard deviation on the whole dataset. Instead, let each group have its own custom-sized bubble of variation. For our Ohia project, we’ll use
weights = varIdent(form = ~ 1 | Site).
What follows on this page is just a brief foray into Generalized Least Squares (GLS) — although there’s a lot of code plus some interpretations to model GLS use. In short, GLS is a method of parameter estimation — it uses a mathematical matrix to dynamically weight the data based on those errors and other deviations from ideal independence. For example, OLS draws its line by treating every data point as equally reliable. When your data has unequal variance (“The Bounce”) or serial correlation (“The Connections”), the standard math gets tricked by the noise and calculates inaccurate slopes.
Generalized Least Squares (GLS) fixes this by changing how it calculates those slopes and intercepts. Instead of treating every point the same, it uses your variance and correlation rules to give less importance to chaotic, high-variance points and adjusts for redundant, repeating points. By mathematically accounting for these flaws during calculation, GLS ensures that final estimates remain stable and accurate. For more — and better! — discussion, see Zuur et al (2009) and Dobson and Barnett (2018).
Model variances.
In Generalized Least Squares (GLS) models, varPower and varExp are used to model heterogeneous variances (heteroscedasticity) that change as a function of a continuous covariate. varPower models the variance as proportional to a power of the absolute value of a covariate; this is useful when the spread of residuals increases or decreases in a power-law fashion with a predictor. In contrast, varExp models the variance as an exponential function of a covariate; this structure may be better when the variance increases rapidly.
Download and install nlme package. Some code presented also relies on function calls from the package RcmdrMisc, so load that package too to avoid errors.
The data from Corn and Hiesey (1973) was introduced in Chapter 12.7 ohia.ch12. To remind you what the data set looked like we have
head(ohia)
   Site  Height   Width
1   M-1 12.5567 19.1264
2   M-1 13.2019 13.1547
3   M-1  8.0699 16.0320
4   M-1  6.0952 22.8586
5   M-1 11.3879 11.0105
6   M-1 12.2242 21.8102
A reminder, what we did before in Chapter 12.7. Note that we had ignored the variance issue and simply applied a standard ANOVA approach
AnovaModel.1 <- aov(Height ~ Site, data = ohia); summary(AnovaModel.1)
           Df Sum Sq Mean Sq F value      Pr(>F)
Site        2   4070  2034.8   22.63 0.000000131 ***
Residuals  47   4227    89.9
---
Signif. codes: 0 '***' 0.001 '**' 0.01 '*' 0.05 '.' 0.1 ' ' 1
We would conclude that the seedlings from the different elevation sites grew significantly different, and proceed to look at the posthoc site comparisons, which demonstrated the higher elevation seedlings grew shortest even in the common garden — an interpretation of genetic based differences.
But simple inspection of the box plots reveals substantial siteXsite variation, so we suspect the equal variacnes assumption does not hold. Rather than transforming the data, or applying a less powerful nonparametric approach, we turn togls() in the package nlme.
Default fits by restricted maximum likelihood, REML. That is, it’s the likelihood of linear combinations of the original data. This first pass, we ignore issues about error variances, in other words, an approach similar to the ANOVA we did before.
library(nlme)
model.aov.1 <- gls(Height ~ Site, data = ohia)

Generalized least squares fit by REML
Model: Height ~ Site
Data: ohia
     AIC      BIC    logLik
361.1312 368.5318 -176.5656

Coefficients:
                Value Std.Error  t-value p-value
(Intercept) 15.313745  2.120550 7.221591  0.0000
Site[T.M-2] 19.261000  2.998911 6.422666  0.0000
Site[T.M-3]  2.924215  3.672900 0.796160  0.4299

Correlation:
            (Intr) S[T.M-2
Site[T.M-2] -0.707
Site[T.M-3] -0.577   0.408

Standardized residuals:
       Min         Q1        Med        Q3       Max
-1.9832938 -0.5020880 -0.1850871 0.5017636 3.0850635

Residual standard error: 9.483388
Degrees of freedom: 50 total; 47 residual
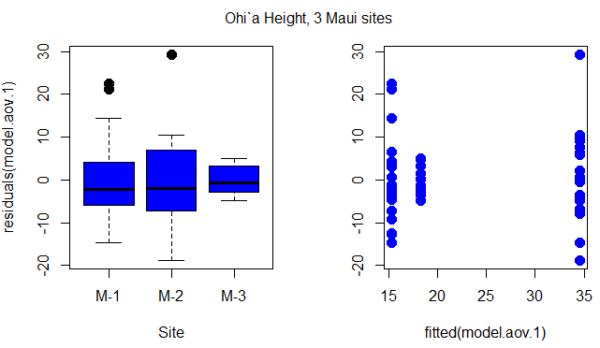
Figure 1. Height: Box plot of residuals from GLS model by elevation site predictors (left) and scatterplot of residuals by fitted values from GLS model (right).
Inspection of Figure 1 suggests residuals not equal — note restricted range of intervals for the M-2 site.
R code for the plot in Figure 1
par(mfrow = c(1, 2))
plot(residuals(model.aov.1) ~ Site, pch=19, cex=1.5,col="blue", data = ohia)
plot(residuals(model.aov.1) ~ fitted(model.aov.1), pch=19, cex=1.5, col="blue", ylab="", data=ohia)
mtext("ANOVA Ohi`a Height, 3 Maui sites ", side = 3, line = -3, outer = TRUE)
So, our conventional approach would be to investigate the assumption of equal error variances.
# test equal variances, Height
library(RcmdrMisc)
leveneTest(Height ~ Site, data=ohia, center="median")
Levene's Test for Homogeneity of Variance (center = "median")
      Df F value  Pr(>F)
group  2  2.1663  0.1259
      47
We would conclude no significant departures from equal variances by Levene test. Consider Bartlett’s test.
bartlett.test(Height ~ Site, data=ohia)

Bartlett test of homogeneity of variances

data:  Height by Site
Bartlett's K-squared = 10.373, df = 2, p-value = 0.005592
model.aov.3 <- gls(Height ~ Site, data = ohia, weights = varIdent(form = ~1|Site)); summary(model.aov.3)
Generalized least squares fit by REML
Model: Height ~ Site
Data: ohia
    AIC      BIC    logLik
354.421 365.5219 -171.2105
varIdent permits variances for each group to vary.
Results from R continue below.
Variance function:
 Structure: Different standard deviations per stratum
 Formula: ~1 | Site
 Parameter estimates:
      M-1       M-2       M-3
1.0000000 1.0396880 0.3471771
We see here that comparisons were carried out versus M-1 site.
Coefficients:
                Value Std.Error  t-value p-value
(Intercept) 15.313745  2.280931 6.713812  0.0000
Site[T.M-2] 19.261000  3.290358 5.853770  0.0000
Site[T.M-3]  2.924215  2.541027 1.150800  0.2556
Marginal differences between M-1 and M-2 for height were significantly different, but not between M-1 and M-3 site.
Correlation:
            (Intr) S[T.M-2
Site[T.M-2] -0.693
Site[T.M-3] -0.898   0.622

Standardized residuals:
       Min         Q1        Med        Q3       Max
-1.7734556 -0.6909962 -0.2108834 0.5801370 2.7586550

Residual standard error: 10.20064
Degrees of freedom: 50 total; 47 residual
# Test the models
anova(model.aov.1, model.aov.3)
            Model df      AIC      BIC    logLik   Test  L.Ratio p-value
model.aov.1     1  4 361.1312 368.5318 -176.5656
model.aov.3     2  6 354.4210 365.5219 -171.2105 1 vs 2  10.7102 0.0047
Although additional degrees of freedom are required, note that this model (model.aov.3) has higher (better!) log likelihood (-171.21) than model.aov.1, the gls model lacking a fit for different variances (-176.57). Introduce a test of the hypothesis that the two models are equal by comparing the log (natural) likelihoods, the log likelihood ratio test, LRT.

The LRT follows a chi-square distribution (per Wilk’s theorem). If there was no advantage to fitting for unequal variances, then the model fit would not be improved and p-value of the LRT would not be less than 5%.
Conclusion
You can see why this approach, even for the rather simple example in this case, modeling versus separate test of assumptions would be the preferred way to go. We get a better fitting model, and, we have employed proper statistical practice (Dobson and Barnett 2018).
Another example, same data set. R code follows.
# ignore variances, Width
model.aov.2 <- gls(Width ~ Site, data = ohia); summary(model.aov.2)
R output
Generalized least squares fit by REML
   Model: Width ~ Site
   Data: ohia
    AIC      BIC    logLik
388.199 395.5996 -190.0995

Coefficients:
               Value Std.Error   t-value p-value
(Intercept) 22.47171  2.828173  7.945662  0.0000
SiteM-2      5.21966  3.999640  1.305032  0.1982
SiteM-3    -14.07412  4.898539 -2.873125  0.0061

Correlation:
        (Intr) SitM-2
SiteM-2 -0.707
SiteM-3 -0.577 0.408

Standardized residuals:
         Min           Q1         Med          Q3         Max
-2.143400060 -0.636016662 0.005715936 0.336888778 2.305052056

Residual standard error: 12.64797
Degrees of freedom: 50 total; 47 residual
Interpretation:
There is significant genetic differentiation in seedling growth between at least one of the populations and the baseline population (Fig 2). Specifically, seedlings from the M-3 population grow significantly narrower (smaller stem width) compared to the baseline population, while the M-2 population shows no statistically significant difference from the baseline.
When a categorical variable like Site is used in a linear model, R automatically chooses one site as the “baseline” or reference group (likely SiteM-1, based on the naming) and compares the other sites against it.
- (Intercept) = 22.47 mm (or your units of width): This is the average stem width of your baseline population (Site M-1). It is highly statistically significant (p < 0.0001), meaning the baseline width is significantly different from zero.
- Site M-2 = +5.22: Seedlings from Site M-2 grew an average of 5.22 units wider than the baseline. However, with a p-value of 0.1982, this difference is not statistically significant. We cannot conclude that M-2 behaves differently from the baseline.
- Site M-3 = -14.07: Seedlings from Site M-3 grew an average of 14.07 units narrower than the baseline (estimated average width: 22.47 – 14.07 = 8.40). With a p-value of 0.0061, this difference is highly statistically significant.
Model Fit & Diagnostics
- Residual Standard Error (12.65): This represents the average distance that observed data points fall from the model’s predicted values.
- Standardized Residuals: The median residual is close to zero (0.0057), and the Min (-2.14) and Max (2.30) are about symmetrical. This suggests that the model’s assumption of normally distributed errors is reasonable.
- Degrees of Freedom (47 residual): Our data set had 50 total observations minus 3 parameters estimated (Intercept, M-2 slope, M-3 slope), ample sample size for this analysis.
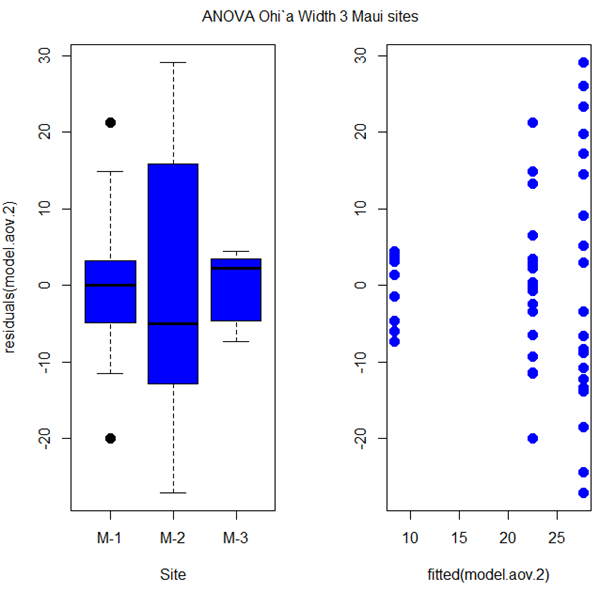
Figure 2. Width: Box plot of residuals from GLS model by elevation site predictors (left) and scatterplot of residuals by fitted values from GLS model (right).
R code for Figure 2 plot
par(mfrow = c(1, 2))
plot(residuals(model.aov.2) ~ Site, pch=19, cex=1.5,col="blue", data = ohia)
plot(residuals(model.aov.2) ~ fitted(model.aov.2), pch=19, cex=1.5, col="blue", ylab="", data=ohia)
mtext("ANOVA Ohi`a Width 3 Maui sites ", side = 3, line = -3, outer = TRUE)
What did we gain from the GLS? take a look at the variances.
# test equal variances, Width
Tapply(Width ~ Site, var, na.action=na.omit, data=ohia) # variances by group
leveneTest(Width ~ Site, data=ohia, center="median")
Tapply(Width ~ Site, var, na.action=na.omit, data=ohia) # variances by group
bartlett.test(Width ~ Site, data=ohia)
R output
> Tapply(Width ~ Site, var, na.action=na.omit, data=ohia) # variances by group
     M-1       M-2      M-3
91.32439 294.90569 20.03057

> leveneTest(Width ~ Site, data=ohia, center="median")
Levene's Test for Homogeneity of Variance (center = "median")
      Df F value    Pr(>F)
group  2  7.9666 0.001049 **
      47
---
Signif. codes: 0 ‘***’ 0.001 ‘**’ 0.01 ‘*’ 0.05 ‘.’ 0.1 ‘ ’ 1

> Tapply(Width ~ Site, var, na.action=na.omit, data=ohia) # variances by group
     M-1       M-2      M-3
91.32439 294.90569 20.03057

> bartlett.test(Width ~ Site, data=ohia)
Bartlett test of homogeneity of variances

data: Width by Site
Bartlett's K-squared = 17.171, df = 2, p-value = 0.0001868
Interpretation:
These tests showed strong evidence of heteroscedasticity among the three populations. The variance in seedling stem width changed depending on the site of origin, with Site M-2 showing large variability and Site M-3 showing very little. These results confirm exactly why the best model was a Generalized Least Squares (GLS) fit rather than a standard ANOVA model. Under ANOVA, p-values for the site differences would be unreliable because Site M-2’s large variance violates that core assumption.
Model correlated residuals
When data points are not truly independent — repeated measurements on the same individual, or values taken along a spatial or temporal sequence — the residuals may show correlation. Generalized Least Squares (GLS) lets us model this correlation directly instead of pretending it isn’t there, as we might do in a multiple linear regression model. Ignoring correlated residuals may lead to underestimated standard errors and overconfident p-values. By specifying a correlation structure (such as autoregressive for time series, compound symmetry for repeated measures, or spatial correlation functions for location-based data), GLS adjusts the weighting of observations so that the model “knows” some points carry redundant information. The result is a more realistic fit, better inference, and parameter estimates that reflect how the data were actually generated.
Note 1
Time series analysis and the ARIMA and ARMA models are presented in Chapter 20.5.
We use the gls() function from the nlme package to model correlated residuals. The following is example code
# Load the nlme package
library(nlme)

# Create some example data with correlated residuals within groups
# (e.g., repeated measurements on different individuals)
set.seed(123)
n_subjects <- 10
n_obs_per_subject <- 5
data <- data.frame(
  Subject = factor(rep(1:n_subjects, each = n_obs_per_subject)),
  Time = rep(1:n_obs_per_subject, n_subjects),
  X = rnorm(n_subjects * n_obs_per_subject)
)
# Generate correlated errors within each subject
data$Y <- unlist(lapply(1:n_subjects, function(s) {
  errors <- arima.sim(model = list(ar = 0.7), n = n_obs_per_subject)
  10 + 2 * data$X[data$Subject == s] + errors
}))

# Fit a GLS model with an AR(1) correlation structure within each subject
# The 'correlation' argument specifies the correlation structure.
# corAR1() defines an AR(1) process.
# form = ~ 1 | Subject indicates that the AR(1) correlation applies within each 'Subject' group.
model_gls_ar1 <- gls(Y ~ X, data = data, correlation = corAR1(form = ~ 1 | Subject))
corAR1(form = ~ 1 | Subject) specifies an Autoregressive of order 1 (AR(1)) correlation structure, where the correlation is applied independently within each Subject group. The form = ~ 1 | Subject indicates that the correlation structure applies to observations within the same Subject group.
# Summarize the model results
summary(model_gls_ar1)
R output
> summary(model_gls_ar1)
Generalized least squares fit by REML
Model: Y ~ X
Data: data
AIC BIC logLik
148.7635 156.2483 -70.38176

Correlation Structure: AR(1)
Formula: ~1 | Subject
Parameter estimate(s):
Phi
0.2237348

Coefficients:
Value Std.Error t-value p-value
(Intercept) 10.294866 0.1668865 61.68782 0
X 2.155633 0.1478797 14.57693 0

Correlation:
(Intr)
X -0.034

Standardized residuals:
Min Q1 Med Q3 Max
-1.68711443 -0.85652175 0.02428734 0.59964691 2.38281397

Residual standard error: 0.9919801
Degrees of freedom: 50 total; 48 residual
Interpretation
The GLS model shows a strong positive relationship between X and Y: for every 1-unit increase in X, Y increases by about 2.16 units, on average, and this effect is highly statistically significant. The intercept (≈10.3) represents the expected value of Y when X is zero. Using a Generalized Least Squares approach improved the analysis because the data showed signs of correlated residuals—the AR(1) parameter (φ ≈ 0.22) indicates that measurements taken closer together within the same subject are moderately correlated. A standard linear model would incorrectly assume independence, which can make standard errors too small. By modeling the correlation directly, GLS produced more reliable standard errors and p-values, giving us greater confidence that the relationship between X and Y is real and not an artifact of ignored within-subject correlation.
Additional residual models
corCompSymm (compound symmetry) and corARMA (autoregressive moving average) are also provided as alternatives, demonstrating the flexibility of the nlme package for handling various correlation structures. Compound symmetry is a covariance structure that assumes all variances are equal and all covariances between any pair of measurements are equal. This means it assumes the correlation between any two repeated measurements within a subject is the same, regardless of how far apart they are in time or order. Autoregressive moving average is used for analyzing non-Gaussian time series data. Instead of fitting a standard ARMA to normally distributed data, GLARMA models handle data like counts or binary outcomes by modeling the conditional mean of the response, which belongs to a distribution from the exponential family (like Poisson or binomial), and using an ARMA structure for the linear predictor.
# Specify other correlation structures, eg, a compound symmetry correlation
model_gls_cs <- gls(Y ~ X, data = data, correlation = corCompSymm(form = ~ 1 | Subject))
summary(model_gls_cs)
R output
summary(model_gls_cs)
Generalized least squares fit by REML
  Model: Y ~ X
  Data: data
       AIC      BIC    logLik
  150.1495 157.6343 -71.07475

Correlation Structure: Compound symmetry
 Formula: ~1 | Subject
 Parameter estimate(s):
     Rho
0.100498

Coefficients:
                Value Std.Error  t-value p-value
(Intercept) 10.311332 0.1665215 61.92194       0
X            2.190527 0.1490535 14.69624       0

 Correlation:
  (Intr)
X -0.031

Standardized residuals:
         Min           Q1          Med           Q3          Max
-1.702766092 -0.878339355 -0.006044474  0.599317975  2.369540693

Residual standard error: 0.9939772
Degrees of freedom: 50 total; 48 residual
Interpretation
The GLS model again finds a clear positive association between X and Y: for each 1-unit increase in X, Y increases by about 2.19 units, and this effect is highly significant. The intercept (≈10.31) represents the expected value of Y when X is zero. In this version of the analysis, we used a compound symmetry (CS) correlation structure, which assumes that all observations within the same subject share the same correlation. The estimated within-subject correlation is modest (ρ ≈ 0.10), meaning repeated measurements on the same subject tend to be slightly more similar than measurements from different subjects.
Using GLS with CS has advantages when the repeated measures do not show a strong pattern of decay over time or order—unlike an AR(1) structure, which assumes that closer measurements are more correlated than farther ones. If the study design or exploratory plots suggest that all within-subject observations are roughly equally related, the CS structure is simpler, easier to interpret, and avoids imposing unnecessary assumptions. As a result, the model provides more accurate standard errors and p-values than an ordinary linear model while using an appropriate correlation pattern for the data.
Autocorrelation is expected in time series.
Time series data is a common source of correlated residuals because observations are sequential and related through time. Time series are basically repeated measures designs. When a standard regression model is applied to time-series data, the residuals would violate the assumption of independence and the model would fail to capture the temporal patterns.
Autoregressive Moving Average (ARMA) model is combined with Generalized Linear Models (GLMs) to handle non-Gaussian time series data. Instead of fitting a standard ARMA to normally distributed data, GLARMA models handle data like counts or binary outcomes by modeling the conditional mean of the response, which belongs to a distribution from the exponential family (like Poisson or binomial), and using an ARMA structure for the linear predictor.
# Or an autoregressive moving average (ARMA) structure:
# Note: corARMA takes additional arguments for p (AR order) and q (MA order)
model_gls_arma <- gls(Y ~ X, data = data, correlation = corARMA(p = 1, q = 1, form = ~ 1 | Subject))
summary(model_gls_arma)
R output
summary(model_gls_arma)
Generalized least squares fit by REML
  Model: Y ~ X
  Data: data
       AIC      BIC    logLik
  149.7441 159.1001 -69.87205

Correlation Structure: ARMA(1,1)
 Formula: ~1 | Subject
 Parameter estimate(s):
      Phi1     Theta1
-0.4316167  0.7078838

Coefficients:
                Value Std.Error  t-value p-value
(Intercept) 10.284066 0.1555666 66.10715       0
X            2.177237 0.1472516 14.78583       0

 Correlation:
  (Intr)
X -0.016

Standardized residuals:
        Min          Q1         Med          Q3         Max
-1.68468178 -0.86326393  0.03143835  0.62391661  2.40860526

Residual standard error: 0.9879063
Degrees of freedom: 50 total; 48 residual
Interpretation
We find again a strong, statistically significant relationship between X and Y: each 1-unit increase in X is associated with an increase of about 2.18 units in Y. The intercept (≈10.28) gives the expected value of Y when X is zero. In this model, we used an ARMA(1,1) correlation structure, which is more flexible than either the AR(1) or compound-symmetry forms. The ARMA parameters (φ₁ ≈ –0.43 and θ₁ ≈ 0.71) indicate that the residual correlation is not a simple “decay with lag” pattern (as in AR(1)) nor a uniform correlation across all observations (as in CS), but instead combines short-range autocorrelation with a moving-average component that can capture abrupt, short-term shocks or adjustments in the data.
Using GLS with an ARMA structure is advantageous when exploratory plots or diagnostics suggest complex within-subject dependence that neither AR(1) nor CS captures well. The ARMA model can better represent both smooth serial correlation and rapid error fluctuations, leading to more accurate standard errors, improved model fit (reflected here in a slightly lower AIC), and more trustworthy inference about the effect of X. Even though the estimated effect of X remains similar across all three models, the ARMA structure helps ensure that the uncertainty around that effect is appropriately estimated for this particular pattern of residual dependence.
Questions
1. Write up three learning outcomes for this page. Hint: Point your favorite generative AI to this page and ask for help.
Quiz Chapter 18.4
Generalized Linear Squares