14.3 – Fixed effects, Random effects
Introduction
With few exceptions (eg, repeatability and intraclass correlation calculations, Chapter 12.3), we have been discussing the Model I ANOVA or fixed-effects ANOVA– fixed implies that we select the levels for the factor. It may not be obvious — in hindsight it is — but levels may also be randomly selected, eg, nature provides the levels. Thus, levels are random and the model is a random-effects ANOVA. Beginning with our discussions of ANOVA, it becomes increasingly important to incorporate concept of models in statistics. As you have been working in R and Rcmdr with the lm() function, you have been forced to address the statistical model concept — you enter the response variable then type in both factors and create a term for the interaction.
We’ve just completed an experiment in which the response (cholesterol levels) of 36 individuals, from one of three drug treatments (placebo, Drug A, Drug B), given one of 3 types of diets (low, medium, or high carbohydrate), was observed. Thus, we say that the specific treatments of drug and diet contribute to variation in cholesterol levels. More formally, we say that the observed response of the kth individual (Yijk) is equal to the overall mean (m) plus the added effect of Drug (a) plus the added effect of Diet (b) plus the interaction between Diet and Population (ab) plus unidentified sources of variation generally called error (e). In symbols, we write

where i is the number of levels of the first factor (in our example, Diet had 2 levels, so i = A or i = B), j is the number of levels of the second factor (in our example, Population had 2 levels, so j = 1, or j = 2), and k is the total number of observations in the experiment (12 in our example, so k = 1, 2, …, 11, 12). Thus, we can think of each term “adding up” to give us the observed value.
Although it is a bit confusing at first, these equations help us understand how the experiment was conducted and therefore how to analyze and interpret the results.
Model I, Model II & Model III ANOVA
Statisticians recognize that how levels of the factors were selected for an experiment impact conclusions from ANOVAs. The key: whether or not the levels of the factor were selected (1) randomly from all possible levels of the factor or (2) specifically selected by the experimenters. We introduced the concepts of fixed and random effects in Chapter 12.3. For one-way ANOVA, the distinction between fixed and random effects influences the interpretation, but not the calculation of the ANOVA components. For two or more treatment factors, both the interpretations and the calculations of ANOVA components are affected.
There are two general types of Factors that we can choose to employ in an ANOVA: Fixed Model ANOVA and Random Model ANOVA. Where two or more factors apply, by far the most common model in experimental sciences is a combination of fixed and random, so we need to add a third general type, the Mixed Model ANOVA design.
Fixed Factors. Where the levels of the factor are selected by us. In this case we would only be interested in the response of the individuals that are given those specific treatments.
Medicine – for example, where we choose a treatment given to patients with a history of coronary heart disease; compare outcomes of patients given a statin (drug used to lower serum cholesterol) drug versus a placebo. (Note that this is the same study we discussed in our lecture on about risk analysis).
Ecotoxicology – for example, compare growth rates and deformities of tadpole frogs given Aldicarb, Atrazine (both estrogen-mimicking pesticides), or a control (ie, no pesticides). If you’re interested in these topics, here’s a link to the EPA’s web site, listing pesticide sales and use in the United States. Here’s a link to a NIH National Institute of Environmental Sciences, with a nice description of estrogen mimicking pesticides.
Agriculture & Genetics – for example, monitor growth of a particular hybrid corn available from three different manufacturers. See an example of Wisconsin corn hybrid studies.
In each of these examples we might be interested in those specific treatments and no other treatments.
HO: No difference in the means among the levels of the Factor
HA: Some difference in the means among these specific levels of the Factor; the specific levels of this factor affects the response variable.
This is an example of a Model I ANOVA, also called a “fixed effects” model ANOVA.
Random Factors. We still only use a relatively few number of different levels of a particular factor. However, in this case we are interested in many different levels of the factor — we want to generalize beyond our sample. The levels that we use would be a “sample” of all possible levels that we would be interested in.
Medicine – for example, where we randomly choose a treatment level given to patients; four concentrations of a drug and a placebo. Since concentration is a ratio scale data type, concentration can range from 0 (the placebo) to 100%.
Ecotoxicology – for example, release different concentrations or mixtures of air plus components of air pollution to chambers, record the response of plants or animals.
Agriculture & Genetics – for example, grow three different varieties of a plant in three different soils or different genetic strains of animals on three different diets. In these cases, factor levels are random because we are drawing from a large pool of possible levels: genetic varieties or strains — we selected three, but it’s rare that were are specifically interested in the three chosen. More often, we want to make generalizations and the three were somehow representative (we hope) of genetic variation in the species of interest.
In each of these examples, we write the null hypothesis to reflect that the particular levels are only of interest in so far as they can be used to generalize back to the population.
HO: No difference in the variation between groups.
HA: Some difference in the variation among these groups.
This is an example of a Model II ANOVA, also called a “random effects” model ANOVA. Note that we specify the hypothesis in terms of variation, not of the means.
Your two-way ANOVA could be Model I, Model II, or it could be mixed, with one factor fixed, the other random (this later model is called a Model III, or “mixed model” ANOVA).
For the most part, the distinction between whether you have fixed or random effects is clear, but whether we use fixed or random or combinations, this design decision has consequences for testing.
The decision does not affect the Sources of Variation for the different Models. Last time, we showed the tests for a Model I ANOVA (the “fixed effects model”).
For Random Effects or Mixed Effects, we only change how we determine the statistical significance of the Factors. Here’s a summary of how the experimental design changes the calculation of the F-test statistic for the Factors.
Table 1. Calculation of F
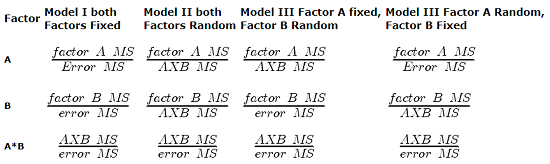
The Critical Value for each of the different F values will be obtained by simply finding the degrees of freedom for the numerator and denominator SS. This was discussed and can be found sources of variation in 2-way ANOVA lecture.
From the formulas, we can see that the major difference is that sometimes the Factor MS is divided by the error MS and sometimes it is divided by the interaction MS.
If the interaction term is NOT statistically significant, then the Interaction MS (mean square) estimates the Error MS. In other words, if the interaction term is not statistically significant it will be similar in magnitude as the Error MS. In this case there will be no large difference in the computed outcomes if the Factor A or B is fixed or random.
However, there will be times when the interaction is not significant but the interaction MS is still larger than the Error MS. Then there could be a difference in the F value for the Factor.
If the interaction term is Significant and the interaction MS is larger than the Error MS then there will be difference in F values for the Factors A and/or B. The F values will be smaller for the Factors MS that are divided by the interaction MS.
It is possible that they will become non-significant with the interaction MS as the denominator. So it will become Harder to detect a significant Factor effect if there is also a significant Interaction effect. A graphical representation will help us understand why we use the interaction MS in some instances as the denominator.
In fact, if the interaction is found to be statistically significant, we must then interpret the effects of factors with caution. In general, if the interaction is significant, then the main factors are generally not interpreted in the 2-way ANOVA. Instead, a series of one-way ANOVA’s are conducted holding one of the factors constant. For example, evaporative water loss (EWL) in frogs in the presence of air pollution (ozone) may depend on the relative humidity (RH) — if the RH is low, the frog may lose less body water at different concentrations of ozone than if the RH is moderate. Therefore, since the interaction is significant, the best thing to do is to look at the effects of ozone concentration on EWL at each level of saturation (RH).
This is a critical point in your understanding of complex ANOVA designs. Let us examine a case where there is a mildly significant interaction effect between two factors. In the first graph below (Fig 1) we see that Genotype 2 performs better on average (combining the two density treatments). If we are only interested in these two density treatments then it might be that the Genotype Factor is significant. This would be the case if Factor A is fixed and Factor B (density) is also fixed.
The Formula for Factor A would be: F = Genotype MS / error MS
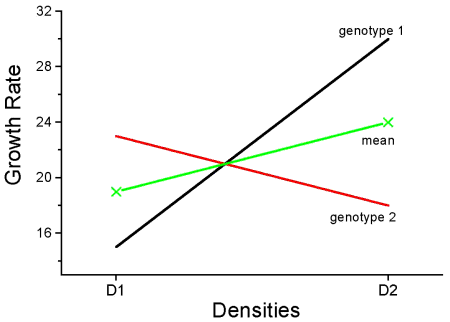
Figure 1. Interaction example. At density D1, genotype 2 (red line) has higher growth rate; at density D2, the ranking switches: now, genotype 1 (black line) has higher growth rate.
However, it is likely that both Factor A (genotype) and Factor B (densities) are actually “samples” of many other possible genotypes and densities that we could examine.
Consider more than two genotypes raised in more than 2 densities (Fig 2). The outcome might look like
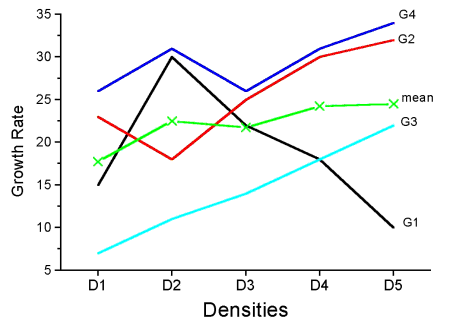
Figure 2. Interaction example expanded for multiple genotypes over multiple densities.
The graph (Fig 2) shows that genotype 2 does not do better than genotype 1 if we have more densities. If we also have other genotypes we see that there are other genotypes that have better (higher) responses than genotype 2.
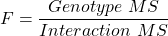
In these cases it would have been more appropriate to calculate the F value for Factor A (genotype) using the interaction MS as the denominator. In Figure 1 there was some interaction this will make it harder to reject the null hypothesis that there is no effect of Factor A (genotype). So you must be careful to think about how you plan to interpret your data before you decide how to analyze the data using a Two-Factor ANOVA.
Questions
- Which of the following statements regarding fixed and random factors is true?
A. With fixed factors, the subjects are selected by the researcher
B. With fixed factors, the treatment levels are selected by the researcher at random from all possible levels
C. With fixed factors, the subjects are selected at random by the researcher
D. With random factors, the treatment levels are selected by the researcher at random from all possible levels - Please write the equation for the one-way ANOVA with four levels of of fixed effects treatment factor A (you may wish to review Chapter 12.2)
- Selecting from all possible levels of a statin drug would be an impossible and meaningless experimental design. Explain why.
- For a multiway ANOVA design, when will the differences in the Random versus Fixed Factor make a difference?
Quiz Chapter 14.3
Fixed effects, random effects
Chapter 14 contents
14.2 – Sources of variation
Introduction
Sources of variation, or components of the two-way ANOVA include two factors, each with two or more levels (groups), and collectively, factors are often referred to as the main effects in these types of ANOVA. The other source of variation in a two-way ANOVA is the interaction between the two factors. Below, I have listed the important components, although I have not included how the sum of squares are calculated. You are expected to know the sources of variation for this most basic two-way ANOVA table (Fig 1). You should also be able to solve any missing elements in one of these tables by utilizing any included information.
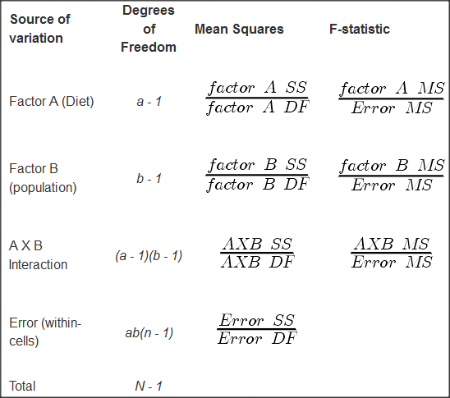
Figure 1. ANOVA table for two-way, balanced, replicated design.
Taking each row from Figure 1 one at a time we have
| Source | DF | Mean Squares | F-statistic |
| First Factor |  |
 |
 |
where Source refers to the source of variation, DF refers to Degrees of Freedom, a is the number of levels (groups) of the first factor, SS refers to Sum of Squares, and MS refers to the Mean Squares.
Next is the second factor
| Source | DF | Mean Squares | F-statistic |
| First Factor |  |
 |
 |
where b is the number of levels (groups) of the second factor. Next is the interaction between the first and second factors.
| Source | DF | Mean Squares | F-statistic |
| Interaction |  |
 |
 |
and lastly the Within-cell Error or residual source of variation
| Source | DF | Mean Squares | F-statistic |
| Error |  |
 |
 |
where n is the number of experimental units for each group. Note that if the sample size differs for one or more groups (levels),then the design would be unbalanced and this formula does not work to determine the degrees of freedom. The total degrees of freedom for the two-way ANOVA is simply N – 1, where N is the sample size for the entire problem; a little algebra shows that N may be calculated as

Unbalanced designs
An unbalanced design implies that observations are missing value for one or more groups. What to do if data are missing? Decision depends on how the data are missing (see Chapter 5). For example, if data are missing at random with respect to treatment, then this should not affect inference. If data are missing not at random, then inference, logically, must be impacted. Calculating the ANOVA, moreover, becomes a different matter. In the one-way ANOVA, no real problem arises although setting up contrasts among the levels requires a weighting term to be factored into the calculations. For higher-level ANOVA involving two or more factors the sums of squares for treatment effects are no longer simple partitioning into the different sources of variation. The sources overlap and the order by which the Factors enter into the statistical model now affects the calculations. Thus, while setting up the calculations for the balanced design is straight-forward, perhaps surprisingly, if group sizes differ, this simple relationship for calculating the degrees of freedom, sums of squares, and Mean squares become an unsolvable problem. This problem is largely solved by the general linear model.
Questions
- Based on the results of a two-way ANOVA, the error sums of squares (SSE) was computed to be 160. If we ignore one of the factors and perform a one-way ANOVA using the same data, will the SSE be the same as in the two-way ANOVA, or will it increase? Decrease? Explain your choice.
- While conducting a two-way ANOVA, you conclude that a statistically significant interaction exists between factor 1 and factor 2. What should be your next step? Do you drop the interaction term from the model and redo the analysis or do you report the results of factor effects including the non-significant interaction?
Quiz Chapter 14.2
Sources of variation
Chapter 14 contents
12.2 – One way ANOVA
Introduction
In ANalysis Of VAriance, or ANOVA for short, we likewise have tools to test the null hypothesis of no difference between between categorical independent variables — often called factors when there’s just a few levels to keep track of — and a single, dependent response variable. But now, the response variable is quantitative, not qualitative like the  tests.
Analysis of variance, ANOVA, is such an important statistical test in biology that we will take the time to “build it” from scratch. We begin by reminding you of where you’ve been with the material.
We already saw an example of this null hypothesis. When there’s only one factor (but with two or more levels), we call the analysis of means and “one-way ANOVA.” In the independent sample t-test, we tested whether two groups had the same mean. We made the connection between the confidence interval of the difference between the sample means and whether or not it includes zero (ie, no difference between the means). In ANOVA, we extend this idea to a test of whether two or more groups have the same mean. In fact, if you perform an ANOVA on only two groups, you will get the exact same answer as the independent two-sample t-test, although they use different distributions of critical values (t for the t-test, F for the ANOVA — a nice little fact for you square the t-test statistic, you’ll get the F-test statistic:  ).
Let’s say we have an experiment where we’ve looked at the effect of different three different calorie levels on weight change in middle-aged men.
I’ve created a simulated dataset which we will use in our ANOVA discussions. The data set is available at the end of this page (scroll down or click here).
We might graph the mean weight changes ( SEM); Below are two possible outcomes of our experiment (Fig 1).
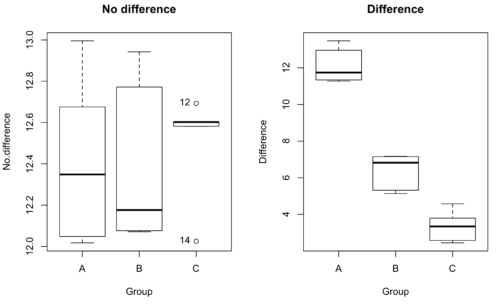
Figure 1. Hypothetical results of an experiment, box plots. Left, no difference among groups; Right, large differences among groups.
As statisticians and scientists, we would first calculate an overall or grand mean for the entire sample of observations; we know this as the sample mean whose symbol is  . But this overall mean is made up of the average of the sample means. If the null hypothesis is true, then the all of the sample means all estimate the overall mean. Put another way, being a member of a treatment group doesn’t matter, ie, there is no systematic effect, all differences among subjects are due to random chance.

The hypotheses among are three groups or treatment levels then are:

Null that there are no differences among the group means. And the alternative hypotheses include any (or all) of the following possibilities

or maybe

or… have we covered all possible alternate outcomes among three groups?
In either case, we could use one-way ANOVA to test for “statistically significant differences.”
Three important terms you’ll need for one-way ANOVA
FACTOR: We have one factor of interest. For example, a factor of interest might be
- Diet fed to hypertensive subjects (men and women)
- Distribution of coral reef sea cucumber species in archipelagos
- Antibiotic drug therapy for adolescents with Acne vulgaris (click see Webster 2002 for review).
Note 1: Character vs factor. In R programming, while it is true that a treatment variable can be a character vector like Gender*, such vectors are handled by R as string. In contrast, by claiming Gender as a factor, R handles the variable as a nominal data type. Hence, ANOVA and other GLM functions expect any treatment variable to be declared as a factor:
Gender <- c("Gender non-conforming", "Men", "Non-binary", "Transgender", "Women", "Declined"); Gender
[1] "Gender non-conforming" "Men" "Non-binary" "Transgender"
[5] "Women" "Declined"
# it’s a string vector, not a factor
is.factor(Gender)
[1] FALSE
Change string vector to a factor.
Gender <- as.factor(Gender); is.factor(Gender) [1] TRUE
* For discussions of ethics of language inclusivity and whether or not such information should be gathered, see Henrickson et al 2020.
LEVELS: We can have multiple levels (2 or more) within the single factor. Some examples of levels for the Factors listed:
- Three diets (DASH), diet rich in fruits & vegetables, control diet)
- Five archipelagos (Hawaiian Islands, Line Islands, Marshal Islands, Bonin Islands, and Ryukyu Islands)
- Five antibiotics (ciprofloxacin, cotrimoxazole, erythromycin, doxycycline, minocycline).
RESPONSE: There is one outcome or measurement variable. This variable must be quantitative (ie, on the ratio or interval scale). Continuing our examples then
- Reduction in systolic pressure
- Numbers of individual sea cucumbers in a plot
- number of microcomedo.
Note 2: A comedo is a clogged pore in the skin; a microcomedo refers to the small plug. Yes, I had to look that up, too.
The response variable can be just about anything we can measure, but because ANOVA is a parametric test, the response variable must be normally distributed!
Note on experimental design
As we discuss ANOVA, keep in mind we are talking about analyzing results from an experiment. Understanding statistics, and in particular ANOVA, informs how to plan an experiment. The basic experimental design is called a completely randomized experimental design, or CDR, where treatments are assigned to experimental units at random.
In this experimental design, subjects (experimental units) must be randomly assigned to each of these levels of the factor. That is, each individual should have had the same probability of being found in any one of the levels of the factor. The design is complete because randomization is conducted for all levels, all factors.
Thinking about how you would describe an experiment with three levels of some treatment, we would have
Table 1. Summary statistics of three levels for some ratio scale response variable.
| Level 1 |
sample mean1 |
sample standard deviation1 |
| Level 2 |
sample mean2 |
sample standard deviation2 |
| Level 3 |
sample mean3 |
sample standard deviation3 |


Note 3: Table 1 is the basis for creating the box plots in Figure 1.
ANOVA sources of variation
ANOVA works by partitioning total variability about the means (the grand mean, the group means). We will discuss the multiple samples and how the ANOVA works in terms of the sources of variation. There are two “sources” of variation that can occur:
- Within Group Variation
- Among Groups Variation
So let’s look first at the variability within groups, also called the Within Group Variation.
Consider and experiment to see if DASH diet reduces systolic blood pressure in USA middle-aged men and women with hypertension (Moore et al 2001). After eight weeks we have
We get the corrected sum of squares, SS, for within group

and the degrees of freedom, DF, for within groups

where i is the identity of the groups,  is the individual observations within group i,
 is the group i mean, ni is the sample size within each group, N is the total sample size of all subjects for all groups, and k is the number of groups.
Importantly, this value is also referred to as “error sums of squares” in ANOVA. It’s importance is as follows — In our example, the within group variability would be zero if and only if all subjects within the same diet lost exactly the same amount of weight. This is hardly ever the case of course in a real experiment. Because there are almost always some other unknown factors or measurement error that affect the response variable, there will be some unknown variation among individuals who received the same treatment (within the same group). Thus, the error variance will generally be larger than zero.
The first point to consider: your ANOVA will never result in statistical differences among the groups if the error variance is greater than the second type of variability, the variability between groups.
The second type of variability in ANOVA is that due to the groups or treatments. Individuals given a calorie-restricted diet will lose some weight; individuals allowed to eat a calorie-rich diet likely will gain weight, therefore there will be variability (a difference) due to the treatment. So we can calculate the variability among groups. We get the corrected sum of squares for among groups

and the degrees of freedom for among groups

where i is the identity of the groups, is the grand mean as defined in Measures of Central Tendency (Chapter 3.1), is the group i mean, ni is the sample size within each group, N is the total sample size of all subjects for all groups, and k is the number of groups.
The sums of squares here is simply subtracting the mean of each population from the overall mean.
- If the Factor is not important in explaining the variation among individuals then all the population means will be similar and the sums of squares among populations would be small.
- If the Factor is important in explaining some of the variation among the individuals then all the population means will NOT be the same and the sums of squares among populations would be large.
Finally, we can identify the total variation in the entire experiment. We have the total sum of squares.

Thus, the insight of ANOVA is that variation in the dataset may be attributed to a portion explained by differences among the groups and differences among individual observations within each group. The inference comes from recognizing that if the among group effect is greater than the within group effect, then there will be a difference due to the treatment levels.
Mean squares
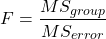
To decide whether the variation associated with the among group differences are greater than the within group variation, we calculate ratios of the sums of squares. These are called Mean Squares or MS for short. The ratio of the Mean Squares is called F, the test statistic for ANOVA.
For the one-way ANOVA we will have two Mean Squares and one F, tested with degrees of freedom for both the numerator  , and denominator
 ).
The Mean Square for (among) groups is

The Mean Square for error is

And finally, the value for F, the test statistic for ANOVA, is
Worked example with R
A factor with three levels, A, B, and C
group <- c("A", "A", "A", "B", "B", "B", "C", "C", "C")
and their responses, simulated
response <- c(10.8, 11.8, 12.8, 6.5, 7, 8, 3.8, 2.8, 3)
We create a data frame
all <- data.frame(group, response)
Of course, you could place the data into a worksheet and then import the worksheet into R. Regardless, we now have our dataset.
Now, call the ANOVA function, aov, and assign the results to an object (eg, Model.1)
Model.1 <- aov(response ~ group, data=all)
Now, visualize the ANOVA table
summary(Model.1)
and the output from R, the ANOVA table, is shown below
Note 4: Rcmdr: Statistics → Means → One-way ANOVA… see figures 2 and 3 below
Table 2. Output from aov() command, the ANOVA table, for the “Difference” outcome variable.
           Df   Sum Sq    Mean Sq   F value       Pr(>F)
group       2   111.16      55.58     89.49    0.0000341 ***
Residuals   6     3.73       0.62
---
Signif. codes: 0 '***' 0.001 '**' 0.01 '*' 0.05 '.' 0.1 ' ' 1
Let’s take the ANOVA table one row at a time
- The first row has subject headers defining the columns.
- The second row of the table “groups” contains statistics due to group, and provides the comparisons among groups.
- The third row, “Residuals” is the error, or the differences within groups.
Moving across the columns, then, for each row, we have in turn,
- the degrees of freedom (there were 3 groups, therefore 2 DF for group),
- the Sums of Squares, the Mean Squares,
- the value of F, and finally,
- the P-value.
R provides a helpful guide on the last line of the ANOVA summary table, the “Signif[icance] codes,” which highlights the magnitude of the P-value.
Note 5: On the use of “error” and “residuals.” Error refers to the difference between an observed value and the true population value. Residual is the difference between an observed value and a value predicted by a model. In ANOVA, the “error variance” or “residual variance” is the variation within groups unexplained by the tested factor. It is what remains after the effects of the model are accounted for.
What to report? ANOVA problems can be much more complicated than the simple one-way ANOVA introduced here. For complex ANOVA problems, report the ANOVA table itself! But for the one-way ANOVA it would be sufficient to report the test statistic, the degrees of freedom, and the p-value, as we have in previous chapters (eg, t-test, chi-square, etc.). Thus, we would report:
F = 89.49, df = 2 and 6, p = 0.0000341
where F = 89.49 is the test statistic, df = 2 (degrees of freedom for the among group mean square) and 6 (degrees of freedom for the within group mean square), and p = 0.0000341 is the p-value.
In Rcmdr, the appropriate command for the one-way ANOVA is simply
Rcmdr: Statistics → Means
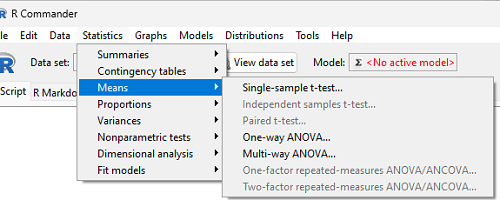
Figure 2. Screenshot Rcmdr select one-way ANOVA.
which brings up a simple dialog. R Commander anticipates factor (Groups) and Response variable. Optional, choose Pairwise comparisons of means for post-hoc test (Tukey’s) and, if you do not want to assume equal variances (see Chapter 13), select Welch F-test.
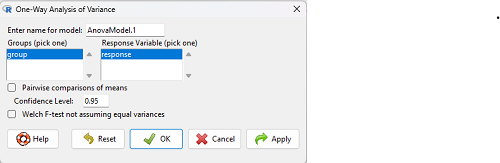
Figure 3. Screenshot Rcmdr select one-way ANOVA options.
Questions
1. Review the example ANOVA Table and confirm the following
- How many levels of the treatment were there?
- How many sampling units were there?
- Confirm the calculation of
 and using the formulas contained in the text.
- Confirm the calculation of F using the formula contained in the text.
- The degrees of freedom for the F statistic in this example were 2 and 6 (F2,6). Assuming a two-tailed test with Type I error rate of 5%, What is the critical value of the F distribution (see Appendix 20.4)
2. Repeat the one-way ANOVA using the simulated data, but this time, calculate the ANOVA problem for the “No.difference” response variable.
3. Leaf lengths from three strains of Arabidopsis thaliana plants grown in common garden are shown in Fig 2. Data are provided for you in the following R script.
arabid <- c("wt","wt","wt","AS1","AS1","AS1","AS2","AS2","AS2")
leaf <- c(4.909,5.736,5.108,6.956,5.809,6.888,4.768,4.209,4.065)
leaves <- data.frame(arabid,leaf)
- Write out a null and alternative hypotheses
- Conduct a test of the null hypothesis by one-way ANOVA
- Report the value of the test statistic, the degrees of freedom, and the P-value
- Do you accept or reject the null hypothesis? Explain your choice.
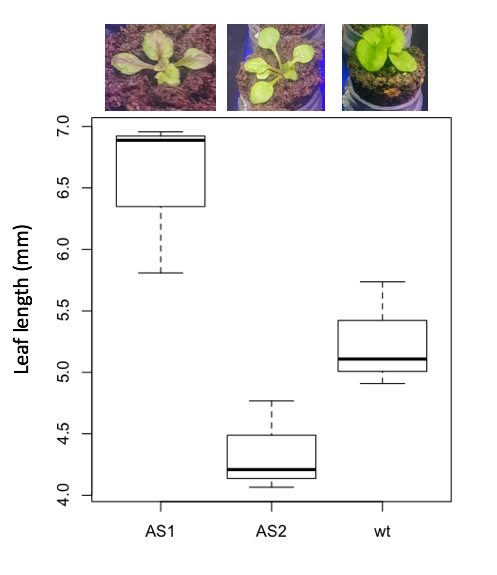
Figure 4. Box plot of lengths of leaves of a 10-day old plant from on of three strains of Arabidopsis thaliana.
4. Return to your answer to question 7 from Chapter 12.1 and review your answer and modify as appropriate to correct your language to that presented here about factors and levels.
5. Conduct the one-way ANOVA test on the Comet assay data presented question 7 from Chapter 12.1. Data are copied for your convenience to end of this page. Obtain the ANOVA table and report the value of the test statistics, degrees of freedom, and p-value.
a. Based on the ANOVA results, do you accept or reject the null hypothesis? Explain your choice.
Quiz Chapter 12.2
One-way ANOVA
Data used in this page
Difference, no difference
Table 12.2 Difference or No Difference
| Group | No.difference | Difference |
|---|---|---|
| A | 12.04822 | 11.336161 |
| A | 12.67584 | 13.476142 |
| A | 12.99568 | 12.96121 |
| A | 12.01745 | 11.746712 |
| A | 12.34854 | 11.275492 |
| B | 12.17643 | 7.167262 |
| B | 12.77201 | 5.136788 |
| B | 12.07137 | 6.820242 |
| B | 12.94258 | 5.318743 |
| B | 12.0767 | 7.153992 |
| C | 12.58212 | 3.344218 |
| C | 12.69263 | 3.792337 |
| C | 12.60226 | 2.444438 |
| C | 12.02534 | 2.576014 |
| C | 12.6042 | 4.575672 |
Comet assay, antioxidant properties of tea
Data presented in Chapter 12.1