18.6 – Compare two linear models
Introduction
Rcmdr (R) provides a very useful tool to compare models. Now, you can compare any two models, but this would be a poor strategy. Use this tool to perform in effect a stepwise test by hand. As one of the models, select for example the saturated model, then for the second model, select one in which you drop one model factor. In the example below, I dropped the two-way interaction from the saturated model (a logistic regression model, actually):
The model was Type.II diabetes = Treatment + Samples + Gender + BMI + Age + Gender:Treatment
where Type.II diabetes is a binomial (Yes,No) dependent variable and Treatment and Gender were categorical factors. The ANOVA table is shown below.
Anova(GLM.1, type="II", test="LR")
Analysis of Deviance Table (Type II tests)
Response: Type.II
                LR Chisq  Df Pr(>Chisq)
Treatment          0.266  7    0.9999
Samples           38.880  1    4.508e-10 ***
Gender             0.671  1    0.4127
BMI                2.259  1    0.1329
Age                2.064  1    0.1508
Treatment:Gender   1.803  1    0.1794
From this output we see that there are a number of terms that are not significant (P < 0.05), but with one exception (Treatment) they seem to contribute to the total variation (P values are between 0.13 and 0.4). So, we conclude that the saturated model is not the best fit model, and proceed to evaluate alternative models in search of the best one.
As a matter of practice I first drop the interaction term. Here’s the ANOVA table for the second model now without the interaction
Anova(GLM.1, type="II", test="LR")
Analysis of Deviance Table (Type II tests)
Response: Type.II
              LR Chisq Df Pr(>Chisq)
Treatment        0.266  7    0.9999
Samples         37.086  1    1.13e-09 ***
Gender           0.671  1    0.4127
BMI              2.017  1    0.1556
Age              1.794  1    0.1804
Both models look about the same. Which one is best? We now wish to know if dropping the interaction harms the model in any way. We will use the AIC (Akaike Information Criterion) to evaluate the models. AIC provides a way to assess which among a set of nested models is better. The preferred model is the one with the lowest AIC value.
To access the AIC calculation, just enter the script AIC(model name), where model name refers to one of the models you wish to evaluate (e.g., GLM.1), then submit the code
AIC(GLM.1)
50.65518

AIC(GLM.2)
50.45793
Thus, we prefer the second model (GLM.2) because the AIC is lower.
AIC does not provide a statistical test of model fit. To access the model comparison tool, simply select
Models → Hypothesis tests → Compare two models…
and the following screen will appear (Fig 1).
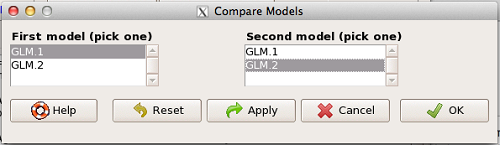
Figure 1. Screenshot Rcmdr compare models menu.
Select the two models to compare (in this case, GLM1 and GLM2), then press OK button. R output
anova(GLM.1, GLM.2, test="Chisq")
Analysis of Deviance Table
Model 1: Type.II ~ Treatment + Samples + Gender + BMI + Age + Gender:Treatment
Model 2: Type.II ~ Treatment + Samples + Gender + BMI + Age
    Resid. Df  Resid. Dev  Df  Deviance P(>|Chi|)
1          49      24.655
2          50      26.458  -1   -1.8027   0.1794
We see that P >0.05 (= 0.1794), which means the fit of the model is fine if we lose the one term.
Deviance
Those of you working with logistic regressions will see this new term, “deviance.” Deviance is a statistical term relevant to model fitting. Think of it like a chi-square test statistic. The idea is that you compare your fitted model against the data in which the only thing estimate is the intercept. Do the additional components of the model add significantly to the prediction of the original data? If they do, dropping the term will have a significant effect on the model fit and the P-value would be less than 0.05. In this example, we see that dropping the interaction term had little effect on the deviance score and in agreement, the P value is larger than 0.05. It means we can drop the term and the new model lacking the term is in some sense better: fewer predictors, a simpler model.
Questions
- Write up three learning outcomes for this page. Hint: Point your favorite generative AI to this page and ask for help.
Quiz Chapter 18.6
Compare two linear models
Chapter 18 contents
18.2 – Nonlinear regression
Introduction
The linear model is incredibly relevant in so many cases. A quick look “linear model” in PUBMED returns about 22 thousand hits; 3.7 million in Google Scholar; 3 thousand hits in ERIC database. These results compare to search of “statistics” in the same databases: 2.7 million (PUBMED), 7.8 million (Google Scholar), 61.4 thousand (ERIC). But all models are not the same.
Fit of a model to the data can be evaluated by looking at the plots of residuals (Fig 1), where we expect to find random distribution of residuals across the range of predictor variable.
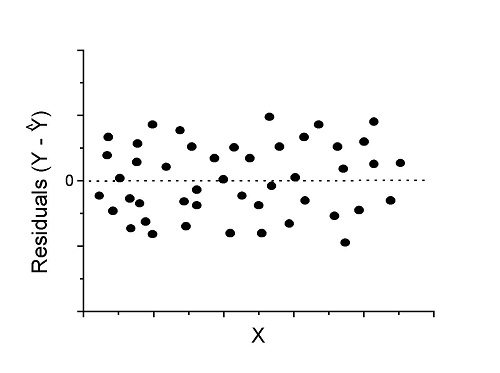
Figure 1. Ideal plot of residuals against values of X, the predictor variable, for a well-supported linear model fit to the data.
However, clearly, there are problems for which assumption of fit to line is not appropriate. We see this, again, in patterns of residuals, eg, Figure 2.
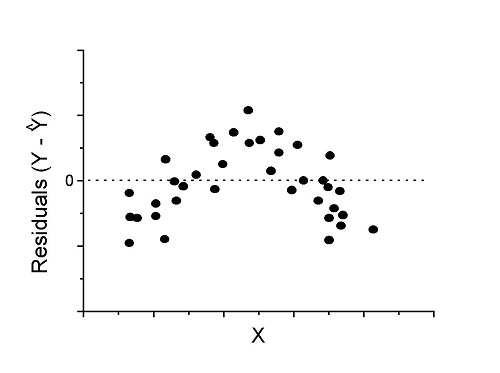
Figure 2. Example of residual plot; pattern suggests nonlinear fit.
Fitting of polynomial linear model
Fit simple linear regression, data set Yuan et al lifespan, listed below.
R code
LinearModel.1 <- lm(cumFreq~Months, data=yuan)

summary(LinearModel.1)

Call:
lm(formula = cumFreq ~ Months, data = yuan)

Residuals:
     Min       1Q   Median      3Q     Max
-0.11070 -0.07799 -0.01728 0.06982 0.13345

Coefficients:
                 Estimate Std. Error t value Pr(>|t|)
(Intercept)     -0.132709   0.045757   -2.90  0.0124 *
Months           0.029605   0.001854   15.97  6.37e-10 ***
---
Signif. codes: 0 '***' 0.001 '**' 0.01 '*' 0.05 '.' 0.1 ' ' 1

Residual standard error: 0.09308 on 13 degrees of freedom
Multiple R-squared: 0.9515, Adjusted R-squared: 0.9477
F-statistic: 254.9 on 1 and 13 DF, p-value: 6.374e-10
We see from the R2 (95%), a high degree of fit to the data. However, residual plot reveals obvious trend (Fig 3)
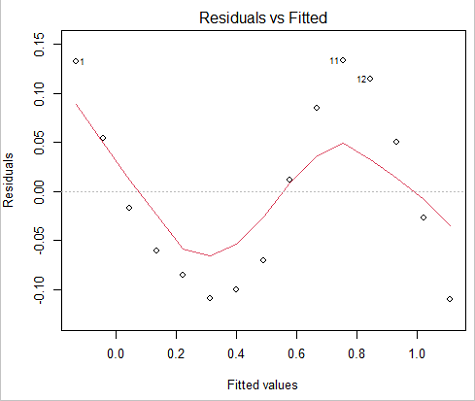
Figure 3. Residual plot, residuals against fitted values.
We can fit a polynomial regression.
First, a second order polynomial
LinearModel.2 <- lm(cumFreq ~ poly( Months, degree=2), data=yuan)

summary(LinearModel.2)

Call:
lm(formula = cumFreq ~ poly(Months, degree = 2), data = yuan)

Residuals:
     Min       1Q   Median      3Q     Max
-0.13996 -0.06720 -0.02338 0.07153 0.14277

Coefficients:
                           Estimate Std. Error  t value   Pr(>|t|)
(Intercept)                 0.48900    0.02458   19.891   1.49e-10 ***
poly(Months, degree = 2)1   1.48616    0.09521   15.609   2.46e-09 ***
poly(Months, degree = 2)2   0.06195    0.09521    0.651   0.528
---
Signif. codes: 0 '***' 0.001 '**' 0.01 '*' 0.05 '.' 0.1 ' ' 1

Residual standard error: 0.09521 on 12 degrees of freedom
Multiple R-squared: 0.9531, Adjusted R-squared: 0.9453
F-statistic: 122 on 2 and 12 DF, p-value: 0.0000000106
Second, try a third order polynomial
LinearModel.3 <- lm(cumFreq ~ poly(Months, degree = 3), data=yuan)

summary(LinearModel.3)

Call:
lm(formula = cumFreq ~ poly(Months, degree = 3), data = yuan)

Residuals:
      Min        1Q   Median       3Q      Max
-0.052595 -0.021533 0.001023 0.025166 0.048270

Coefficients:
                           Estimate Std. Error t value   Pr(>|t|)
(Intercept)                0.488995   0.008982  54.442   9.90e-15 ***
poly(Months, degree = 3)1  1.486157   0.034787  42.722   1.41e-13 ***
poly(Months, degree = 3)2  0.061955   0.034787   1.781   0.103
poly(Months, degree = 3)3 -0.308996   0.034787  -8.883   2.38e-06 ***
---
Signif. codes: 0 '***' 0.001 '**' 0.01 '*' 0.05 '.' 0.1 ' ' 1

Residual standard error: 0.03479 on 11 degrees of freedom
Multiple R-squared: 0.9943, Adjusted R-squared: 0.9927
F-statistic: 635.7 on 3 and 11 DF, p-value: 1.322e-12
Which model is best? We are tempted to compare R-squared among the models, but R2 turn out to be untrustworthy here. Instead, we compare using Akaike Information Criterion, AIC
R code/results
AIC(LinearModel.1,LinearModel.2, LinearModel.3)
              df       AIC
LinearModel.1  3 -24.80759
LinearModel.2  4 -23.32771
LinearModel.3  5 -52.83981
Smaller the AIC, better fit.
anova(RegModel.5,LinearModel.3, LinearModel.4)
Analysis of Variance Table

Model 1: cumFreq ~ Months
Model 2: cumFreq ~ poly(Months, degree = 2)
Model 3: cumFreq ~ poly(Months, degree = 3)
  Res.Df   RSS    Df Sum of Sq       F      Pr(>F)
1     13 0.112628
2     12 0.108789  1  0.003838  3.1719 0.1025
3     11 0.013311  1  0.095478 78.9004 0.000002383 ***
---
Signif. codes: 0 '***' 0.001 '**' 0.01 '*' 0.05 '.' 0.1 ' ' 1
Logistic regression
The Logistic regression is a classic example of nonlinear model.
R code
logisticModel <-nls(yuan$cumFreq~DD/(1+exp(-(CC+bb*yuan$Months))), start=list(DD=1,CC=0.2,bb=.5),data=yuan,trace=TRUE)
5.163059 : 1.0 0.2 0.5
2.293604 : 0.90564552 -0.07274945 0.11721201
1.109135 : 0.96341283 -0.60471162 0.05066694
0.429202 : 1.29060000 -2.09743525 0.06785993
0.3863037 : 1.10392723 -2.14457296 0.08133307
0.2848133 : 0.9785669 -2.4341333 0.1058674
0.1080423 : 0.9646295 -3.1918526 0.1462331
0.005888491 : 1.0297915 -4.3908114 0.1982491
0.004374918 : 1.0386521 -4.6096564 0.2062024
0.004370212 : 1.0384803 -4.6264657 0.2068853
0.004370201 : 1.0385065 -4.6269276 0.2068962
0.004370201 : 1.0385041 -4.6269822 0.2068989
summary(logisticModel)

Formula: yuan$cumFreq ~ DD/(1 + exp(-(CC + bb * yuan$Months)))

Parameters:
      Estimate  Std. Error  t value      Pr(>|t|)
DD    1.038504    0.014471    71.77   < 2e-16 ***
CC   -4.626982    0.175109   -26.42  5.29e-12 ***
bb    0.206899    0.008777    23.57  2.03e-11 ***
---
Signif. codes: 0 '***' 0.001 '**' 0.01 '*' 0.05 '.' 0.1 ' ' 1

Residual standard error: 0.01908 on 12 degrees of freedom

Number of iterations to convergence: 11
Achieved convergence tolerance: 0.000006909

> AIC(logisticModel)
[1] -71.54679
Logistic regression is a statistical method for modeling the dependence of a categorical (binomial) outcome variable on one or more categorical and continuous predictor variables (Bewick et al 2005).
The logistic function is used to transform a sigmoidal curve to a more or less straight line while also changing the range of the data from binary (0 to 1) to infinity (-∞,+∞). For event with probability of occurring p, the logistic function is written as
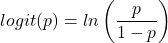
where ln refers to the natural logarithm.
The logit link function is used in models to transform a probability, which is restricted between 0 and 1, into the log-odds scale, which ranges from negative infinity to positive infinity. This transformation makes the relationship between predictors and the outcome linear. In other words, this is an odds ratio. It represents the effect of the predictor variable on the chance that the event will occur. Much of our contingency table work in Chapter 7 would be best analyzed with the logistic regression.
The logistic regression model then very much resembles the same as we have seen before.

In R and Rcmdr we use the glm() function to model the logistic function. Logistic regression is used to model a binary outcome variable. What is a binary outcome variable? It is categorical! Examples include: Living or Dead; Diabetes Yes or No; Coronary artery disease Yes or No. Male or Female. One of the categories could be scored 0, the other scored 1. For example, living might be 0 and dead might be scored as 1. (By the way, for a binomial variable, the mean for the variable is simply the number of experimental units with “1” divided by the total sample size.)
With the addition of a binary response variable, we are now really close to the Generalized Linear Model. Now we can handle statistical models in which our predictor variables are either categorical or ratio scale. All of the rules of crossed, balanced, nested, blocked designs still apply because our model is still of a linear form.
We write our generalized linear model

just to distinguish it from a general linear model with the ratio-scale Y as the response variable.
Think of the logistic regression as modeling a threshold of change between the 0 and the 1 value. In another way, think of all of the processes in nature in which there is a slow increase, followed by a rapid increase once a transition point is met, only to see the rate of change slow down again. Growth is like that. We start small, stay relatively small until birth, then as we reach our early teen years, a rapid change in growth (height, weight) is typically seed (well, not in my case … at least for the height). The fitted curve I described is a logistic one (other models exist too). Where the linear regression function was used to minimize the squared residuals as the definition of the best fitting line, now we use the logistic as one possible way to describe or best fit this type of a curved relationship between an outcome and one or more predictor variables. We then set out to describe a model which captures when an event is unlikely to occur (the probability of dying is close to zero) AND to also describe when the event is highly likely to occur (the probability is close to one).
A simple way to view this is to think of time being the predictor (X) variable and risk of dying. If we’re talking about the lifetime of a mouse (lifespan typically about 18-36 months), then the risk of dying at one months is very low, and remains low through adulthood until the mouse begins the aging process. Here’s what the plot might look like, with the probability of dying at age X on the Y axis (probability = 0 to 1) (Fig 4).
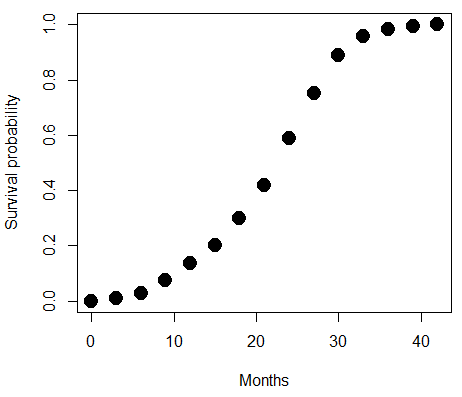
Figure 4. Lifespan of 1881 mice from 31 inbred strains (Data from Yuan et al (2012) available at https://phenome.jax.org/projects/Yuan2).
We ask — of all the possible models we could draw, which best fits the data? The curve fitting process is called the logistic regression.
With some minor, but important differences, running the logistic regression is the same as what you have been doing so far for ANOVA and for linear regression. In Rcmdr, access the logistic regression function by invoking the Generalized Linear Model (Fig 5).
Rcmdr: Statistics → Fit models → Generalized linear model.
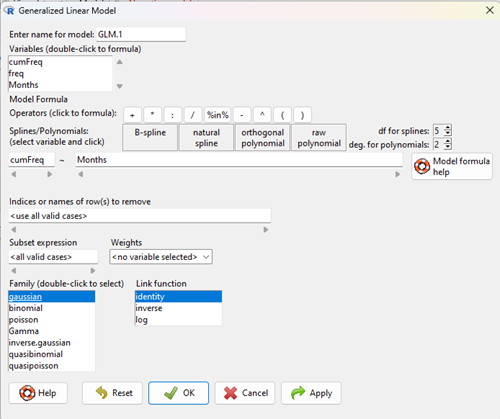
Figure 5. Screenshot Rcmdr GLM menu. For logistic on ratio-scale dependent variable, select gaussian family and identity link function.
Select the model as before. The box to the left accepts your binomial dependent variable; the box at right accepts your factors, your interactions, and your covariates. It permits you to inform R how to handle the factors: Crossed? Just enter the factors and follow each with a plus. If fully crossed, then the interactions may be specified with “:” to explicitly call for a two-way interaction between two (A:B) or a three-way interaction between three (A:B:C) variables. In the later case, if all of the two way interactions are of interest, simply typing A*B*C would have done it. If nested, then use %in% to specify the nesting factor.
R output
> GLM.1 <- glm(cumFreq ~ Months, family=gaussian(identity), data=yuan)

> summary(GLM.1)

Call:
glm(formula = cumFreq ~ Months, family = gaussian(identity),
data = yuan)

Deviance Residuals:
Min 1Q Median 3Q Max
-0.11070 -0.07799 -0.01728 0.06982 0.13345

Coefficients:
Estimate Std. Error t value Pr(>|t|)
(Intercept) -0.132709 0.045757 -2.90 0.0124 *
Months 0.029605 0.001854 15.97 6.37e-10 ***
---
Signif. codes: 0 '***' 0.001 '**' 0.01 '*' 0.05 '.' 0.1 ' ' 1

(Dispersion parameter for gaussian family taken to be 0.008663679)

Null deviance: 2.32129 on 14 degrees of freedom
Residual deviance: 0.11263 on 13 degrees of freedom
AIC: -24.808

Number of Fisher Scoring iterations: 2
Assessing fit of the logistic regression model
Some of the differences you will see with the logistic regression is the term deviance. Deviance in statistics simply means compare one model to another and calculate some test statistic we’ll call “the deviance.” We then evaluate the size of the deviance like a chi-square goodness of fit. If the model fits the data poorly (residuals large relative to the predicted curve), then the deviance will be small and the probability will also be high — the model explains little of the data variation. On the other hand, if the deviance is large, then the probability will be small — the model explains the data, and the probability associated with the deviance will be small (significantly so? You guessed it! P < 0.05).
The Wald test statistic

where n and β refers to any of the n coefficient from the logistic regression equation and SE refers to the standard error if the coefficient. The Wald test is used to test the statistical significance of the coefficients. It is distributed approximately as a chi-squared probability distribution with one degree of freedom. The Wald test is reasonable, but has been found to give values that are not possible for the parameter (eg, negative probability).
Likelihood ratio tests are generally preferred over the Wald test. For a coefficient, the likelihood test is written as

where L0 is the likelihood of the data when the coefficient is removed from the model (ie, set to zero value), whereas L1 is the likelihood of the data when the coefficient is the estimated value of the coefficient. It is also distributed approximately as a chi-squared probability distribution with one degree of freedom.
Questions
- Write up three learning outcomes for this page. Hint: Point your favorite generative AI to this page and ask for help.
- What is the primary difference between linear regression and logistic regression?
- What type of dependent variable is used in logistic regression?
- What is the purpose of the sigmoid (or logistic) function in this model?
- What is the role of a significance test (eg, a Wald test) in logistic regression?
- Why is the LRT generally considered more reliable than the Wald test for logistic regression, especially with smaller sample sizes?
Quiz Chapter 18.2
Nonlinear regression
Data set
Yuan data
| Months | freq | cumFreq |
|---|---|---|
| 0 | 0 | 0 |
| 3 | 0.010633 | 0.010633 |
| 6 | 0.017012 | 0.027645 |
| 9 | 0.045189 | 0.072834 |
| 12 | 0.064327 | 0.137161 |
| 15 | 0.064859 | 0.20202 |
| 18 | 0.09782 | 0.299841 |
| 21 | 0.118554 | 0.418394 |
| 24 | 0.171186 | 0.58958 |
| 27 | 0.162148 | 0.751728 |
| 30 | 0.137161 | 0.888889 |
| 33 | 0.069644 | 0.958533 |
| 36 | 0.024455 | 0.982988 |
| 39 | 0.011696 | 0.994684 |
| 42 | 0.005316 | 1 |