19.2 – Bootstrap sampling
Introduction
Bootstrapping is a general approach to estimation or statistical inference that utilizes random sampling with replacement (Kulesa et al. 2015). In classic frequentist approach, a sample is drawn at random from the population and assumptions about the population distribution are made in order to conduct statistical inference. By resampling with replacement from the sample many times, the bootstrap samples can be viewed as if we drew from the population many times without invoking a theoretical distribution. A clear advantage of the bootstrap is that it allows estimation of confidence intervals without assuming a particular theoretical distribution and thus avoids the burden of repeating the experiment.
Base install of R includes the boot package. The boot package allows R users to work with most functions, and many authors have provided helpful packages. I highlight a couple packages
install packages lmboot, confintr
Example data set, Tadpoles from Chapter 14, copied to end of this page for convenience (scroll down or click here).
Bootstrapped 95% Confidence interval of population mean
Recall classic frequentist (large-sample) approach to confidence interval estimates of mean by R
x = round(mean(Tadpole$Body.mass),2); x
n = length(Tadpole$Body.mass); n
s = sd(Tadpole$Body.mass); s
error = qt(0.975,df=n-1)*(s/sqrt(n)); error
lower_ci = round(x-error,3)
upper_ci = round(x+error,3)
paste("95% CI of ", x, " between:", lower_ci, "&", upper_ci)
Output results are
> n = length(Tadpole$Body.mass); n
[1] 13
> s = sd(Tadpole$Body.mass); s
[1] 0.6366207
> error = qt(0.975,df=n-1)*(s/sqrt(n)); error
[1] 0.384706
> paste("95% CI of ", x, " between:", lower_ci, "&", upper_ci)
[1] "95% CI of 2.41 between: 2.025 & 2.795"
We used the t-distribution because both  the population mean and
 the population standard deviation were unknown. Thus, 95 out of 100 confidence intervals would be expected to include the true value.
Bootstrap equivalent
library(confintr)
ci_mean(Tadpole$Body.mass, type=c("bootstrap"), boot_type=c("stud"), R=999, probs=c(0.025, 0.975), seed=1)
Output results are
Two-sided 95% bootstrap confidence interval for the population mean based on 999 bootstrap replications
and the student method

Sample estimate: 2.412308
Confidence interval:
    2.5%    97.5%
2.075808 2.880144
where stud is short for student t distribution (another common option is the percentile method — replace stud with perc), R = 999 directs the function to resample 999 times. We set seed=1 to initialize the pseudorandom number generator so that if we run the command again, we would get the same result. Any integer number can be used. For example, I set seed = 1 for output below
Confidence interval:
    2.5%    97.5%
2.075808 2.880144
compared to repeated runs without initializing the pseudorandom number generator:
Confidence interval:
    2.5%    97.5%
2.067558 2.934055
and again
Confidence interval:
    2.5%    97.5%
2.067616 2.863158
Note that the classic confidence interval is narrower than the bootstrap estimate, in part because of the small sample size (i.e., not as accurate, does not actually achieve the nominal 95% coverage). Which to use? The sample size was small, just 13 tadpoles. Bootstrap samples were drawn from the original data set, thus it cannot make a small study more robust. The 999 samples can be thought as estimating the sampling distribution. If the assumptions of the t-distribution hold, then the classic approach would be preferred. For the Tadpole data set, Body.mass was approximately normally distributed (Anderson-Darling test = 0.21179, p-value = 0.8163). For cases where assumption of a particular distribution is unwarranted (e.g., what is the appropriate distribution when we compare medians among samples?), bootstrap may be preferred (and for small data sets, percentile bootstrap may be better). To complete the analysis, percentile bootstrap estimate of confidence interval are presented.
The R code
ci_mean(Tadpole$Body.mass, type=c("bootstrap"), boot_type=c("perc"), R=999, probs=c(0.025, 0.975), seed=1)
and the output
Two-sided 95% bootstrap confidence interval for the population mean based on 999 bootstrap replications
and the percent method
Sample estimate: 2.412308
Confidence interval:
    2.5%    97.5%
2.076923 2.749231
In this case, the bootstrap percentile confidence interval is narrower than the frequentist approach.
Model coefficients by bootstrap
R code
Enter the model, then set B, the number of samples with replacement.
myBoot <- residual.boot(VO2~Body.mass, B = 1000, data = Tadpoles)
R returns two values:
bootEstParam, which are the bootstrap parameter estimates. Each column in the matrix lists the values for a coefficient. For this model,bootEstParam$[,1]is the intercept andbootEstParam$[,2]is the slope.origEstParam, a vector with the original parameter estimates for the model coefficients.seed, numerical value for the seed; use seed number to get reproducible results. If you don’t specify the seed, then seed is set to pick any random number.
While you can list the $bootEstParam, not advisable because it will be a list of 1000 numbers (the value set with B)!
Get necessary statistics and plots
#95% CI slope
quantile(myBoot$bootEstParam[,2], probs=c(.025, .975))
R returns
    2.5%    97.5%
335.0000 562.6228
#95% CI intercept
quantile(myBoot$bootEstParam[,1], probs=c(.025, .975))
R returns
     2.5%     97.5%
-881.3893 -310.8209
Slope
#plot the sampling distribution of the slope coefficient
par(mar=c(5,5,5,5)) #setting margins to my preferred values
hist(myBoot$bootEstParam[,2], col="blue", main="Bootstrap Sampling Distribution",
xlab="Slope Estimate")
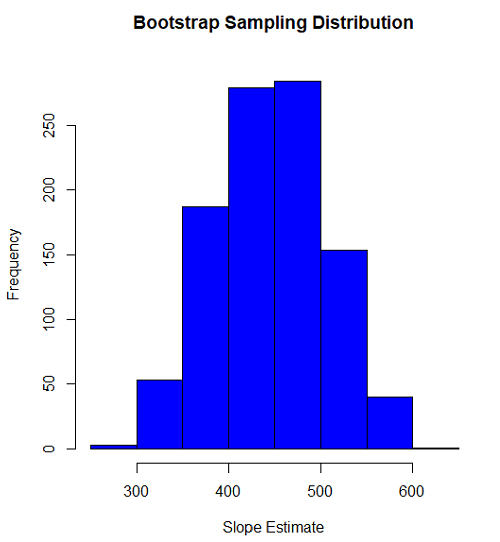
Figure 1. histogram of bootstrap estimates for slope
Intercept
#95% CI intercept
quantile(myBoot$bootEstParam[,1], probs=c(.025, .975))
par(mar=c(5,5,5,5))
hist(myBoot$bootEstParam[,1], col="blue", main="Bootstrap Sampling Distribution",
xlab="Intercept Estimate")
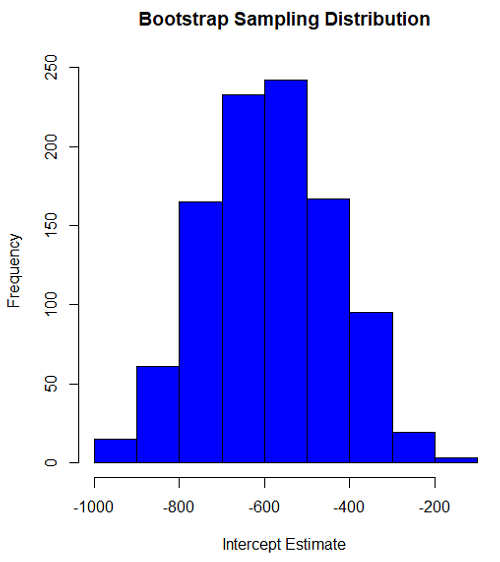
Figure 2. Histogram of bootstrap estimates for intercept.
Questions
edits: pending
Data set used this page (sorted)
| Gosner | Body mass | VO2 |
| I | 1.76 | 109.41 |
| I | 1.88 | 329.06 |
| I | 1.95 | 82.35 |
| I | 2.13 | 198 |
| I | 2.26 | 607.7 |
| II | 2.28 | 362.71 |
| II | 2.35 | 556.6 |
| II | 2.62 | 612.93 |
| II | 2.77 | 514.02 |
| II | 2.97 | 961.01 |
| II | 3.14 | 892.41 |
| II | 3.79 | 976.97 |
| NA | 1.46 | 170.91 |
Chapter 19 contents
- Introduction
- Jackknife sampling
- Bootstrap sampling
- Monte Carlo methods
- Ch19 References and suggested readings
8.6 – Confidence limits for the estimate of population mean
Introduction
In Chapter 3.4 and Chapter 8.3, we introduced the concept of providing a confidence interval for estimates. We gave a calculation for an approximate confidence interval for proportions and for the Number Needed to Treat (Chapter 7.3). Even an approximate confidence interval gives the reader a range of possible values of a population parameter from a sample of observations.
In this chapter we review and expand how to calculate the confidence interval for a sample mean,  . Because is derived from a sample of observations, we use the t-distribution to calculate the confidence interval. Note that if the population was known (population standard deviation), then you would use normal distribution. This was the basis for our recommendation to adjust your very approximate estimate of a confidence interval for an estimate by replacing the “2” with “1.96” when you multiply the standard error of the estimate (SE) in the equation estimate
 . As you can imagine, the approximation works for large sample size, but is less useful as sample size decreases.
Consider ; it is a point estimate of , the population mean (a parameter). But our estimate of is but one of an infinite number of possible estimates. The confidence interval, however, gives us a way to communicate how reliable our estimate is for the population parameter. A 95% confidence interval, for example, tells the reader that we are willing to say (95% confident) the true value of the parameter is between these two numbers (a lower limit and an upper limit). The point estimate (the sample mean) will of course be included between the two limits.
Instead of 95% confidence, we could calculate intervals for 99%. Since 99% is greater than 95%, we would communicate our certainty of our estimate.
Note 1: Again, the caveats about p-value extend to confidence intervals. See Chapter 8.2.
Question 1: For 99% confidence interval, the lower limit would be smaller than the lower limit for a 95% confidence interval.
- True

- False
When we set the Type I error rate,  (alpha) = 0.05 (5%), that means that 5% of all possible sample means from a population with mean, , will result in t values that are larger than
 OR smaller than
 .
Why the t-distribution?
We use the t-test because, technically, we have a limited sample size and the t-distribution is more accurate than the normal distribution for small samples. Note that as sample size increases, the t-distribution is not distinguishable from the normal distribution and we could use  (Fig 1).
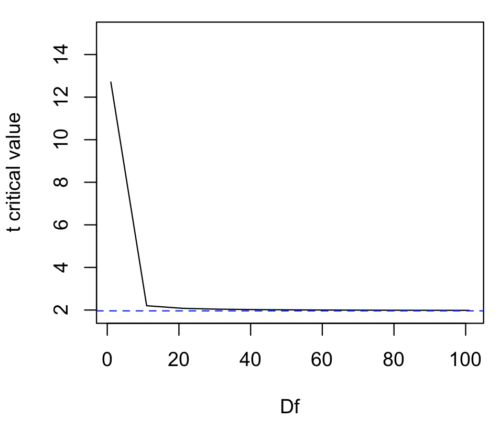
Figure 1. Critical values at Type I rate of 5% of t-distribution  . Blue dashed line is z = 1.96.
Here’s the equation for calculating the confidence interval based on the t-distribution. These set the limits around our estimate of the sample mean. Together, they’re called the 95% confidence interval,  .

Here’s a simplified version of the same thing, but generalized to any Type I level…
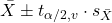
This statistic allows us to say that we are 95% confident that the interval includes the true value for . For this confidence interval you need to identify the critical t value at 5%. Thus, you need to know the degrees of freedom for this problem, which is simply  , the sample size minus one.
It is straightforward to calculate these by hand, but…
Set the Type I error rate, calculate the degrees of freedom (df):
 samples for one sample test
- pairs of samples for paired test
 samples for two independent sample test
and lookup the critical value from the t table (or from the t distribution in R). Of course, it is easier to use R.
In R, for the one tail critical value with seven degrees of freedom, type at the R prompt
qt(c(0.05), df=7, lower.tail=FALSE)
[1] 1.894579
For the two-tail critical value
qt(c(0.025), df=7, lower.tail=FALSE)
[1] 2.364624
Or, if you prefer to use R Commander, then follow the menu prompts to bring up the t quantiles function (Fig 2 and Fig 3).
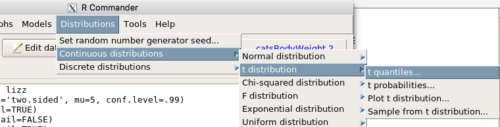
Figure 2. Drop down menu to get t-distribution.
Note 2: Quantiles divide probability distribution into equal parts or intervals. Quartiles have four groups, deciles have ten groups, and percentiles have 100 groups.
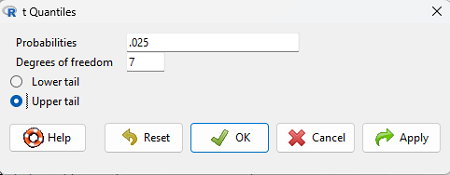
Figure 3. Menu for t quantiles, with values entered for the two-tail example.
You should confirm that what R calculates agrees with the critical values tabulated in the Table of Critical values for the t distribution provided in the Appendix.
A worked example
Let’s revisit our lizard example from last time (see Chapter 8.5). Prior to conducting any inference test, we decide acceptable Type I error rates (cf justify alpha discussion in Ch8.1); For this example, we set Type I error rate to be 1% for a 99% confidence interval.
The Rcmdr output was
t.test(lizz$bm, alternative='two.sided', mu=5, conf.level=.99)
data: lizz$bm
t = -1.5079, df = 7, p-value = 0.1753
alternative hypothesis: true mean is not equal to 5
99 percent confidence interval:
1.984737 6.199263
sample estimates:
mean of x
4.092
Sort through the output and identify what you need to know.
Question 1: What was the sample mean?
- 5
- -1.5079
- 7
- 0.1753
- 1.984737
- 6.199263
- 4.092
Question 2: What was the most likely population mean?
- 5
- Answer
- -1.5079
- 7
- 0.1753
- 1.984737
- 6.199263
- 4.092
Question 3: This was a “one-tailed” test of the null hypothesis?
- True
- False
The output states “alternative hypothesis: true mean is not equal to 5” — so it was a two-tailed test.
Question 4: What was the lower limit of the confidence interval?
- 5
- -1.5079
- 7
- 0.1753
- 1.984737
- 6.199263
- 4.092
The 99% confidence interval,  , is
 , which means we are 99% certain that the population mean is between
 (lower limit) and
 (upper limit). In Chapter 8.5 we calculated the , is
 .
Confidence intervals by nonparametric bootstrap sampling.
Bootstrapping is a general approach to estimation or statistical inference that utilizes random sampling with replacement (Kulesa et al. 2015). In classic frequentist approach, a sample is drawn at random from the population and assumptions about the population distribution are made in order to conduct statistical inference. By resampling with replacement from the sample many times, the bootstrap samples can be viewed as if we drew from the population many times without invoking a theoretical distribution. A clear advantage of the bootstrap is that it allows estimation of confidence intervals without assuming a particular theoretical distribution and thus avoids the burden of repeating the experiment. Which method to prefer? For cases where assumption of a particular distribution is unwarranted (eg, what is the appropriate distribution when we compare medians among samples?), bootstrap may be preferred (and for small data sets, percentile bootstrap may be better). We cover bootstrap sampling of confidence intervals in Chapter 19.2 Bootstrap sampling.
Conclusions
The take home message is simple.
- All estimates should — must? — be accompanied by a Confidence Interval
- The more confident we wish to be, the wider the confidence interval will be
Note that the confidence interval concept combines DESCRIPTION (the population mean is between these limits) and INFERENCE (and we are 95% certain about the values of these limits). It is good statistical practice to include estimates of confidence intervals for any estimate you share with readers. Any statistic that can be estimated should be accompanied by a confidence interval and, as you can imagine, formulas are available to do just this. For example, earlier this semester we calculated NNT.
Questions
- To gain practice with calculations of confidence intervals, calculate the approximate confidence interval, the 95% and the 99% confidence intervals based on the t distribution, for each of the following.
-
- = 13,
 = 1.3,
 = 10
- = 13, = 1.3, = 30
- = 13, = 2.6, = 10
- = 13, = 2.6, = 30
Quiz Chapter 8.6
Confidence limits for the estimate of population mean
Chapter 8 contents
- Introduction
- The null and alternative hypotheses
- The controversy over proper hypothesis testing
- Sampling distribution and hypothesis testing
- Tails of a test
- One sample t-test
- Confidence limits for the estimate of population mean
- References and suggested readings